

Abstract
Adequate dialysis is difficult to define because we have not identified the toxic solutes that contribute most to uremic illness. Dialysis prescriptions therefore cannot be adjusted to control the levels of these solutes. The current solution to this problem is to define an adequate dose of dialysis on the basis of fraction of urea removed from the body. This has provided a practical guide to treatment as the dialysis population has grown over the past 25 years. Indeed, a lower limit to Kt/Vurea (or the related urea reduction ratio) is now established as a quality indicator by the Centers for Medicare and Medicaid for chronic hemodialysis patients in the United States. For the present, this urea-based standard provides a useful tool to avoid grossly inadequate dialysis. Dialysis dosing, however, based on measurement of a single, relatively nontoxic solute can provide only a very limited guide toward improved treatment. Prescriptions which have similar effects on the index solute can have widely different effects on other solutes. The dose concept discourages attempts to increase the removal of such solutes independent of the index solute. The dose concept further assumes that important solutes are produced at a constant rate relative to body size, and discourages attempts to augment dialysis treatment by reducing solute production. Identification of toxic solutes would provide a more rational basis for the prescription of dialysis and ultimately for improved treatment of patients with renal failure.
Dialysis cannot be prescribed rationally because we do not know what we are trying to remove. We have not identified the toxic solutes that accumulate and make people sick when their kidneys fail. So we cannot rate treatment on the basis of its ability to control the levels of these solutes.
As we cannot measure levels of toxic solutes, we rate treatment on the basis of fraction of urea removed from the body. The fractional removal of this single solute is said to define a “dose” of dialysis. With thrice weekly treatment, the physician has prescribed an adequate dose of dialysis if approximately two-thirds of the urea is removed from the body at each session (1). Acceptance of urea removal as a “dose” allowed standardization of treatment as the hemodialysis population grew to more than 350,000 in the United States alone. However, as a guide to future improvements, the urea removal standard is fundamentally flawed. First, in measuring the fraction of any solute removed, we ignore the question of how much is left in the patient. We end up prescribing dialysis without reference to the rate at which solutes are produced or to other routes by which they may be cleared. Even more importantly, the concept of a dialysis “dose” wrongly implies that all important solutes behave alike.
The dose concept is borrowed from drug treatment, where physicians manipulate the levels of a single compound: increase the dose, and levels in the body will rise. If the treatment removes a substance, the direction must be reversed: increase the dose, and levels in the body should fall. However, a treatment that removes different kinds of solutes cannot be characterized by a dose. As reviewed in the following sections, given changes in the dialysis prescription may have widely different effects on different solutes. There can thus be no dose of dialysis. To optimize dialysis, we need to identify the solutes that are important to remove.
The Development of Kt/Vurea
The parameter we employ to represent the fractional removal of urea is Kt/Vurea, which is usually calculated from the pre- to posttreatment urea reduction ratio with small adjustments made for the volume removed by ultrafiltration and the estimated urea production rate (1,2). Kt/Vurea was adopted based on the results of the National Cooperative Dialysis Study (NCDS) (3). Review of this study serves to introduce both the utility and limitations of Kt/Vurea as a measure of treatment. In 1974, the NIH sponsored a conference on the “Adequacy of Dialysis” (4). Only approximately 20,000 people in the United States were on maintenance dialysis, which had first been performed in 1961. However, the number was expected to grow rapidly because Medicare funding for dialysis had been approved, and it was considered essential that authorities “agree, to the extent possible, on generally acceptable parameters of what constitutes adequate dialysis” (4).
The 1974 conferees focused more on alleviating residual uremic signs and symptoms than on improving survival. Looking back, we can presume that uremic signs and symptoms were prominent because solute clearances were low by present standards and because the consequences of renal failure were less obscured by co-morbid conditions than they are in today’s patients. Pericarditis occurred in as many as 20% of patients, and uremic bleeding was a major concern. Nerve dysfunction manifested by impaired cognitive function and peripheral neuropathy was considered the most characteristic feature of inadequate treatment (5). However, the conference participants were already finding that uremic defects were difficult to quantify (6).
The 1974 conferees considered several means to both standardize and improve dialysis. Sargent and Gotch (7) had developed urea kinetic modeling, but applied it differently from how we do today. They aimed for a pretreatment blood urea nitrogen (BUN) of about 80 mg/dl, and used their model to reduce treatment time in patients who had a low protein intake, residual native kidney function, or high dialytic clearance. On the basis of observations that peritoneal dialysis patients appeared healthier than hemodialysis patients with similar blood urea concentrations, Scribner and Babb (8) suggested that better results could be obtained by increasing the clearance of “middle molecules” with molecular size between 300 and 2000 Da. Henderson et al. (9) had developed hemofiltration to remove even larger solutes, but it was not widely tested. Chemical studies had failed to reveal which uremic solutes were toxic. The conferees concluded that a trial comparing different treatments in matched patients was required to define a standard for “adequate” dialysis, setting the stage for the NCDS, which was performed between 1978 and 1981 (3).
In the NCDS, 151 patients received thrice weekly hemodialysis in a 2 × 2 design to test the effect of achieving higher and lower BUN concentrations and of using shorter or longer treatment times. The initial analysis published in 1981 showed that the groups with time-averaged BUN concentrations of approximately 50 mg/dl fared better than those with time-averaged BUN concentrations of approximately 80 mg/dl, while the difference between treatment times averaging 3.3 hours and 4.5 hours was not significant (3). Reanalysis of the original results by Gotch and Sargent (10), however, showed that Kt/Vurea predicted treatment failure significantly better than BUN. Morbid events ended study participation in about 50% of the patients with Kt/Vurea values between 0.4 and 0.8 as compared with only about 10% of those with Kt/Vurea values between 0.9 and 1.5.
The development of Kt/Vurea ranks easily as the most important theoretical development in the history of dialysis. It constituted a major, evidence-based step forward from prescribing treatment based on achieving target blood urea levels. It also allowed treatment to be standardized based on the readily available urea nitrogen assay while the identity of toxic uremic solutes remained unknown. However, the adoption of Kt/Vurea did not, as has sometimes been supposed, actually make it possible to measure the detoxification of patients without identifying the toxins. In basing treatment on urea removal as reflected by Kt/Vurea rather than on blood urea concentration, we acknowledge that urea itself is not very toxic, as was known by dialysis pioneers (11,12). We make, however, two important assumptions that have not been verified and indeed seem unlikely to be true. We assume that important uremic toxins all behave like urea, so that they are similarly affected by changes in the blood flow, dialysate flow, dialyzer construction, and treatment schedule. We also assume that important uremic toxins are produced at a rate that is stable and are produced in proportion to body water volume in all patients.
The limitations of these assumptions were well known to the developers of Kt/Vurea. They were obliged, however, to work with the data available, and urea was the only solute measured in the NCDS. The time difference between short and long treatments was considered by some to test the “middle molecule hypothesis” because the clearances for solutes with size greater than 300 Da depended largely on membrane area and time with the dialyzers then used. However, as no “middle molecules” were assayed, the investigators could not determine whether longer treatment had in fact lowered levels of such solutes. The only possible substitute for urea levels as a laboratory measure of adequacy was therefore a parameter describing urea removal. In discussing the limitations of Kt/Vurea, we should emphasize that any measurement of dialysis adequacy based on the removal of a single solute would have similar limitations.
Solute Size: The Problem of Large Solutes
The failure of Kt/Vurea to characterize the behavior of one class of solutes is well known. These are solutes of large size. In the 1960s, hemodialysis was performed with membranes, which provided very limited clearance of solutes with size greater than 1000 Da. Treatment with these membranes wakened patients from coma, relieved vomiting, and partially reversed other uremic symptoms. This provided evidence, which remains convincing, that some important uremic toxins are small. As noted before, Scribner and Babb (8) hypothesized that outcomes could be improved by increasing the removal of “middle molecules” with size ranging from 300 to 2000 Da. No toxins of this size were identified, but the middle molecule hypothesis encouraged the development of membranes permeable to larger solutes. As such membranes came into use, the definition of “middle molecules” shifted upward, so that by 2003, the European Toxin Work Group (EUTox) used this term to characterize solutes with size ranging from 500 to 60,000 Da, which is close to the size of albumin (13).
The shift in the definition of middle molecules reflected a change in clinical interest. Attention was focused on the potential toxicity of low molecular weight proteins and protein fragments and particularly on β2-microglobulin with size approximately 11,800 Da. Modern membrane materials are permeable to molecules of this size but, because large solutes move slowly in solution, they diffuse through dialysis membranes less rapidly than small molecules. Their dialytic clearance is therefore much lower than that of urea and is less dependent on blood and dialysate flow during conventional treatment. Clinical trials have focused on increasing the removal of large solutes independent of urea clearance, first by increasing the membrane capacity and, more recently, by supplementing dialysis with ultrafiltration (14–16). The results obtained so far have been equivocal, and the results of the newest trials incorporating increased ultrafiltration are eagerly awaited.
It should be noted that as interest shifted to solutes around the size of β2-microglobulin, the question whether it was important to remove solutes in the size range around 1000 Da was not answered, but rather abandoned. Several uremic solutes in this size range have been identified, but none has attracted much interest (13). With modern membrane materials, the clearance of such solutes could be increased to a high fraction of the dialyzer plasma flow by using dialyzers with larger membrane areas than those we now employ to achieve high urea clearances. The extent to which this would reduce plasma levels (which would depend not just on fractional clearance but also on the volume of distribution and on any nonrenal clearance) has not been tested for any solute of this size.
Solute Binding to Plasma Proteins
Characteristics other than large size can make uremic solutes behave differently from urea. One of these is binding to plasma proteins, chiefly albumin (17–19). The dialytic clearance of bound solutes is low because only the free, unbound solute concentration contributes to the gradient driving diffusion across the dialysis membrane (20,21). When expressed as multiples of normal, levels of these compounds are therefore higher than the levels of urea in hemodialysis patients. Unlike uremic solutes in the size range around 1000 Da, protein-bound solutes have attracted considerable interest and there is reason to suspect that some of them are toxic (18,22,23). The native kidney, unlike the dialyzer, can achieve high clearance rates for bound solutes by active secretion. Presumably, the combination of protein binding and tubular secretion represents an evolutionary adaptation, which allows for excretion of toxic molecules while keeping their concentrations in the extracellular fluid very low (24). This theoretical argument has been backed by laboratory and clinical evidence for the toxicity of indoxyl sulfate and p-cresol sulfate, which are the two most extensively studied bound solutes (22,23).
The bound solutes provide a striking example of the limitations of urea-based dialysis “dosing.” Two dialysis prescriptions that remove urea equally well can have very different effects on bound solutes. As we have adopted urea removal as the standard for dialysis prescription, we employ dialyzer sizes and dialysate flows, which remove most of the urea from the blood during a single pass through the dialyzer. The use of larger dialyzers and higher dialysate flows could not greatly increase the urea clearance and would not significantly lower plasma urea levels, (Fig. 1). As long as dialysis efficacy is measured by Kt/Vurea, increases in these parameters are not warranted. Indeed, restricting the dialysate flow to 1.2–1.5 times the blood flow has been considered cost effective because higher dialysate flows produce only small increases in urea clearance (25,26). However, increasing the dialyzer size and dialysate flow increases the clearance and could reduce the plasma levels of protein-bound uremic solutes (Fig. 1) (27). The clearance of such solutes can also be increased out of proportion to urea clearance by other means, including high volume ultrafiltration and the addition of a sorbent to the dialysate (28–30).
Fig. 1.
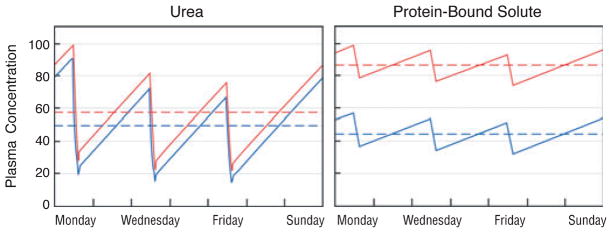
The predicted effect of increasing dialyzer size and dialysate flow on the plasma concentration of urea (left panel) as compared with a solute, which is 95% bound to plasma proteins (right panel). In the left panel, the red line depicts urea levels obtained with a conventional dialysis prescription designed to achieve single pool Kt/Vurea of 1.4 with a blood flow (Qb) of 360 ml/minute and a dialysate flow (Qd) of 500 ml/minute during a dialysis session lasting 3.5 hours. As depicted by the blue line, the predicted effect on urea levels of doubling both Qd and the mass transfer area coefficient KoA would be to reduce the time-averaged urea concentration by only about 15%. The reduction in time-averaged concentration (broken lines) is small because the urea clearance is a large fraction of the blood flow with the conventional prescription and the urea reduction ratio is already about 70%. The right panel depicts the effect of the same two prescriptions on plasma levels of a solute, which is 95% bound to plasma proteins. With the conventional prescription (red line), the clearance of the bound solute is less than a tenth that of urea and the solute reduction ratio is only about 20%. Doubling Qd and KoA would nearly double the clearance of the bound solute. If solute production stayed constant and the solute was cleared by no other route, this would reduce time-averaged concentration by almost 50% (blue line). Solute concentration profiles were obtained with a previously described computer program and using a distribution volume for the bound solute of 0.2 l/kg body weight, similar to the value observed by Martinez et al. (67). for p-cresol sulfate (68). The peak predialysis concentration has been set to 100 arbitrary units for both solutes.
Solute Sequestration and Volume of Distribution
Some solutes are sequestered, or held in compartments where their concentration does not equilibrate rapidly with that of the plasma (31,32). Application of a high dialytic clearance may rapidly lower the plasma concentration of such solutes while removing only a small portion of the total body content. When this happens, intermittent treatment will be followed by a rebound in the plasma solute concentration.
There is some sequestration of urea that has a modest effect on its removal by dialysis (2). Sequestration of urea was originally thought to reflect restricted diffusion of urea between cell water and the extracellular fluid. It was later shown that the sequestration of urea reflects slow removal of urea from parts of the body with lower blood supply as compared with those with higher blood supply (33–35). Other solutes may be sequestered to a greater degree than urea. Available measurements suggest that this is the case for creatinine, various guanidines, uric acid, and methylamine (34,36–38). Like protein-bound solutes, sequestered solutes can respond differently from urea to changes in the dialysis prescription. In particular, levels of sequestered solutes may be lowered more than levels of urea by increasing dialysis duration or frequency (Fig. 2). Sequestration is most often modeled by assuming that a solute is distributed in two body compartments. Solute is removed from the first compartment, often considered to be the extracellular fluid, by dialysis, and diffuses passively between the two compartments (39). A two-compartment model may prove inadequate to describe the behavior of some organic solutes, as has proven to be the case for phosphate (40). Studies to date, however, have not proceeded beyond application of a two-compartment model to a limited number of solutes.
Fig. 2.
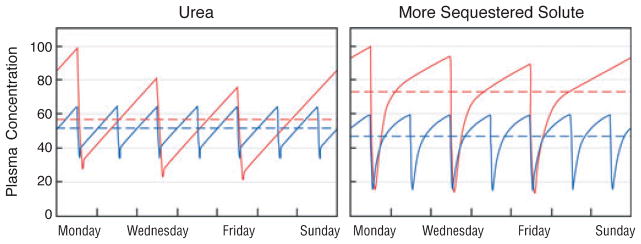
The predicted effect of increasing dialysis frequency from three to seven times per week on the plasma concentration of urea (left panel) as compared with a more sequestered solute (right panel). In the left panel, the red line again depicts urea levels obtained with a conventional dialysis prescription designed to achieve single pool Kt/Vurea of 1.4 during a dialysis session lasting 3.5 hours. The blue line depicts the predicted effect on urea levels of dividing the same 10.5 hours of total treatment time into daily 1.5-hour sessions while leaving other elements of the prescription constant. The reduction in time-averaged concentration (broken lines) is only about 10%. The right panel depicts the effect of the same two prescriptions on levels of a hypothetical solute, which is distributed in a 12-l compartment including the plasma, which is readily accessible to the dialyzer and a second 36-l compartment with passive movement between the first and second compartments characterized by an inter compartmental diffusion coefficient of 40 ml/minute. With conventional thrice weekly treatment (red line), the latter part of each treatment removes relatively little solute because the solute concentration in the first, accessible compartment has already been reduced to low levels. The plasma concentration exhibits prominent rebound following the end of each treatment as the first compartment is refilled from the second. Daily treatment with the shorter sessions results in more effective solute removal with a predicted reduction in the time-averaged solute concentration of about 35% (blue line). Solute concentration profiles were obtained with a previously described computer program assuming constant rates of solute production and no solute clearance by other routes (68).
A special issue that may be dealt with under the heading of sequestration is solute movement in and out of erythrocytes. Urea is unusual in that selective membrane transporters facilitate its movement in and out of cells. Urea is thus removed from both erythrocyte and plasma water as blood passes through the dialyzer, so that with adequate membrane size and dialysate flow, the blood passing through the dialyzer is largely cleared of urea (2,34). For molecules without facilitated transport, clearance cannot exceed plasma flow, even when the solute is contained in both plasma and erythrocyte water. Creatinine, for instance, diffuses out of erythrocytes less than 1/1000th as fast as urea, although it is not much larger in size (34). As a result, the dialytic creatinine clearance is lower than the dialytic urea clearance and, unlike the urea clearance, is dependent on hematocrit. It is possible that some solutes are taken up into erythrocytes during passage through the dialyzer, with the result that their clearance is lower than the plasma flow even though their size is small, and they do not bind to plasma proteins (38).
Even if there is no sequestration, volume of distribution is a major determinant of the effect of dialysis on the plasma levels of different solutes. This is perhaps the most commonly overlooked limitation of using urea to represent the effect of dialysis on all small solutes. Urea has a volume of distribution that is close to the total body water. Some solutes appear to have larger volumes of distribution, including some guanidines and methylamine (37,38). The theoretical effect of a large volume of distribution, independent of sequestration, is to make the value of increasing treatment duration more nearly equal to the value of increasing treatment frequency. The alternate possibility of a volume of distribution smaller than body water has received almost no attention. However, it does seem plausible that some toxic solutes are excluded from cell water and have a volume of distribution similar to the extracellular fluid volume. The effect would be the opposite of a large volume of distribution, namely to enhance the value of increasing frequency while rendering it nearly useless to increase treatment duration and/or solute clearance (Fig. 3).
Fig. 3.
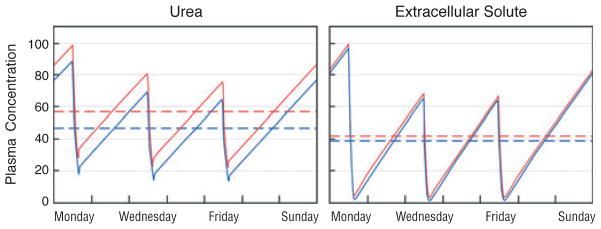
The predicted effect of increasing Kt/Vurea on the plasma concentration of urea (left panel) as compared with a small solute, which is distributed only in the extracellular fluid (right panel). In the left panel, the red line again depicts urea levels obtained with a conventional dialysis prescription designed to achieve single pool (sp)Kt/Vurea of 1.4 during a dialysis session lasting 3.5 hours. The blue line depicts the predicted effect on urea levels of increasing the urea clearance by 15% and the session length to 4 hours so that spKt/Vurea is increased by close to 30%. This increase is similar in magnitude to that achieved in the “high-dose” arm of the HEMO study (16). Its effect is to reduce time-averaged urea levels by about 18%. The right panel depicts the effect of the same two prescriptions on levels of a hypothetical small, unbound solute, which is distributed only in the extracellular fluid. As the clearance is high relative to the volume of distribution, the conventional prescription removes the solute almost completely. The increases in session length and clearance, which together provide a 30% higher “dose” of dialysis as measured by Kt/Vurea, reduce the time-averaged solute concentration by less than 10% (blue line). Solute concentration profiles were obtained with a previously described computer program assuming constant rates of solute production and no solute clearance by other routes (68).
Clearly, solutes with different sequestration patterns or volumes of distribution will respond to changes in the dialysis prescription in different, even opposing, ways. If solutes with differing behaviors are toxic, it could be very difficult to determine which of two dialysis prescriptions is better overall. It has been suggested that the exceptional results reported with slow, thrice weekly dialysis are attributable in part to the effect of increased treatment duration on sequestered solute levels (41). The presence of toxins with small distribution volumes could account for the impression obtained in the early days of dialysis that good results cannot be obtained with twice weekly treatment. It is interesting to note that the native kidney solves this problem by operating continuously. When clearance is applied continuously, solute levels depend only on solute production and are independent of sequestration and volumes of distribution. However, this cannot be the case with intermittent treatment. The problem of solutes being differently distributed in the body, like the problem of protein binding, has not been solved, but rather passed over in the adoption of urea as an index solute.
The Refinement of Kt/Vurea: eKt/Vurea and StdKt/Vurea
Two important refinements have been proposed to make Kt/Vurea more accurately reflect the effect of different dialysis prescriptions. It should be emphasized that while these refinements allow more accurate comparison of the effect of different prescriptions on urea levels, they do not address the problem of solutes that behave differently from urea. The first of these refinements is equilibrated Kt/Vurea, or eKt/Vurea (2,42). The original urea kinetic model employed by Gotch and Sargent treated urea as if it were removed from a single, well-mixed compartment, hence the designation single pool or spKt/Vurea.
As noted before, however, urea does not behave as if it were being removed from a single pool, but rather exhibits compartmental behavior as revealed by a modest rebound over the first hour after the end of dialysis treatment. With conventional thrice weekly treatment, the magnitude of this rebound increases as the treatment time is reduced. Thrice weekly treatments of different duration need to achieve close to the same urea concentration 1 hour postdialysis rather than immediately postdialysis to achieve similar concentration profiles through the week. The effect of treatment is the same as if urea had been removed from a single compartment at a lesser clearance (Fig. 4). This theoretically equivalent treatment of a single, fully equilibrated compartment can be characterized by eKt/Vurea, which is slightly less than spKt/Vurea. To avoid making patients wait for posttreatment blood sampling to determine eKt/Vurea, formulas have been developed that allow eKt/Vurea to be derived from spKt/Vurea as determined from urea levels measured at the beginning and end of treatment (42–45).
Fig. 4.

The relationship of equilibrated Kt/Vurea or eKt/Vurea with single pool (sp)Kt/Vurea. Points A and B depict the measured plasma urea nitrogen concentrations at the beginning and end of a 3-hour dialysis session. If urea were removed from a single well-mixed compartment, the urea concentration would have fallen along the broken line and treatment, which produced the 73% urea reduction ratio depicted here, would be characterized by an spKt/Vurea of approximately 1.30. However, the true urea concentration curve is represented by the solid line, reflecting sequestration of urea. This curve dips below the theoretical single compartment curve during treatment, reflecting rapid removal of urea from a readily accessible first compartment. It rebounds after treatment as urea moves into the first compartment from a second compartment, which has been less effectively cleared, and then rises at a slower, steady rate reflecting urea generation. The effect on urea values through the week is the same as if urea had been removed from a single compartment at a lesser clearance so that its concentration fell along the dotted line to point C and then did not rebound. This theoretically equivalent treatment of a fully equilibrated single compartment could be characterized by an eKt/Vurea of approximately 1.13. Use of eKt/Vurea is required to compare urea removal during sessions of different lengths, as the urea rebound is greater after shorter sessions. Values for the reduction ratio presented here are approximations; values obtained for individual dialysis session would differ slightly depending on ultrafiltration and urea generation.
Interest in more frequent dialysis has prompted further modification of spKt/Vurea to formulas for standard Kt/Vurea, or stdKt/Vurea (1,46–48). While spKt/Vurea and eKt/Vurea describe the effect of a single treatment, stdKt/Vurea is intended to provide a measure of the treatment received through a whole week, so that the effect of prescriptions employing different numbers of weekly treatments can be compared. Different ways of calculating a stdKt/Vurea have been devised. The easiest to use are formulas that derive stdKt/Vurea from spKt/Vurea and eKt/Vurea incorporating adjustments for treatment duration and frequency (1,47). Other expressions to characterize the weekly “dose” of dialysis have also been devised (49–51). All these expressions and stdKt/Vurea share important limitations. Like spKt/Vurea and eKt/Vurea, they are based on urea measurements and assume that two prescriptions that have the same effect on one small solute will have the same effect on other small solutes; there is, as yet, no evidence that these indices predict clinical effect. The original spKt/Vurea formulation of Gotch and Sargent (10) was adopted because it separated the good from the bad outcomes in patients in a randomized trial. The upward drift of the target spKt/Vurea from 1.0 to 1.4 occurred without the support of a trial, and the HEMO study subsequently showed that a further increase from approximately 1.4 to 1.7 afforded no benefit (52). However, spKt/Vurea, often modified to eKt/Vurea, has remained in use to prescribe thrice weekly dialysis treatment because it did once predict benefit. No such evidence supports the use of the formulas intended to characterize more frequent treatment.
In the absence of clinical evidence, formulas intended to characterize the effect of frequent treatment can best be expressed as hypotheses. When we use a formula based on urea levels, we hypothesize that for any given rate of urea production, some feature of the weekly plasma urea concentration profile should be the same for prescriptions with different numbers of weekly treatments. Concentration profiles obtained with different treatment frequencies cannot be superimposed, so if prescriptions are adjusted to obtain similar predialysis urea concentrations, they will not provide the same time-averaged urea concentration and vice versa.
It has been suggested that hemodialysis prescriptions should be adjusted to achieve the same average pretreatment urea concentrations for any given rate of urea production (Fig. 5) (46). However, such hypotheses provide very limited guidance to patients wishing to pursue dialysis that is more intensive than conventional thrice weekly in-center treatment. For example, equal values for stdKt/Vurea can be obtained by thrice weekly treatment for 8 hours, and by six times weekly treatment for 2 hours and 20 minutes (Fig. 5). The equality of stdKt/Vurea, however, provides little assurance that these very different regimens have the same clinical effect. In calculating stdKt/Vurea, we continue to ignore the fact that prescriptions that have similar effects on urea may have different effects on other solutes. All the while, we move one step further away from the clinical data that initially supported the use of Kt/Vurea. Formulas for stdKt/Vurea have been shown to predict very accurately what will happen to urea levels when the dialysis prescription is changed, but not what will happen to patients. This testifies at once to our success in analyzing urea kinetics and our failure to identify toxic uremic solutes.
Fig. 5.

Comparison of the effect of two intensive dialysis prescriptions on plasma urea levels. The red line depicts the effect of a weekly total time of 24 hours divided into three treatments lasting 8 hours. The blue line depicts the effect of a total of 14 hours divided into six treatments lasting 2 hours and 20 minutes. The blood flow, dialysate flow, and dialyzer are presumed to be the same so that the urea clearance is the same. Frequent treatment for a shorter total time results in a higher time-averaged urea concentration (dashed line). However, the average of the peak pretreatment urea concentration values through the week is the same for both prescriptions, so that they would provide the same standard Kt/Vurea by one formulation of this parameter. It remains uncertain, however, that these two treatments would have the same clinical effect even independent of differences in extracellular volume and inorganic ion control.
Adjusting for Native Kidney Function and Nonrenal Clearance
Urea was chosen to assess the effect of dialysis for historical reasons (31). As the most abundant solute excreted by the kidneys, it rises to the highest concentration in the blood when the kidneys fail, and it was relatively easy to measure. However, urea provides a poor index of the capacity of the native kidney to clear small solutes. In an average-sized person with normal kidneys, the GFR is about 120 ml/minute. The clearance of creatinine, which is accomplished by filtration with aminor component of secretion, is about 140 ml/minute. The clearance of many small solutes is higher, due to more effective tubular secretion. The clearance of the major serotonin metabolite 5-hydroxyindoleacetic acid, for instance, is close to the renal plasma flow or about five times the GFR. The clearance of urea, in contrast, averages only about half the GFR and varies widely with extracellular fluid volume and urine flow. A substance for which evolution has provided a relatively low clearance would seem, a priori, an unlikely choice to represent the as-yet-unknown uremic toxins.
In hemodialysis, the relationship of urea with other small solutes is reversed. Rapid transport through the erythrocyte membrane allows urea clearance to rise to a large fraction of the dialyzer blood flow. The clearance of creatinine and other small solutes, in contrast, is limited to the dialyzer plasma flow. Active secretion, which selectively increases the clearance of some solutes in the native kidney, is not present. The ratio of dialytic to native kidney clearance is thus higher for urea than for any other solute.
As the ratio of dialytic to native kidney clearance is uniquely high for urea, the prescription of dialysis based on urea kinetics tends to obscure the potential importance of residual native kidney function. The current KDOQI guidelines allow the dialysis “dose” to be reduced by a fixed amount when the residual urea clearance is ≥2 ml/min (1). The European ERA-EDTA guidelines allow a continuous reduction in dosage with increasing residual function and also assess residual function by urea clearance (53). If these urea-based standards are applied, patients with residual function will have plasma urea concentrations only slightly lower than those without residual function. However, the presence of residual function has a larger effect on plasma concentrations of solutes that are secreted by the native kidney, including those that bind to plasma proteins (54). Lower concentrations of such solutes could contribute to the superior outcomes observed in hemodialysis patients with residual function.
Perhaps, the clearest example of excessive confidence in urea as an index of native kidney function was provided by the original 1997 Kidney Disease Outcomes and Quality Initiative (KDOQI) guidelines for the initiation of hemodialysis. The guidelines recommended that dialysis be initiated when the GFR fell to approximately 10 ml/minute/1.73 m2. The recommendation to initiate dialysis at this point was not based on evidence of clinical benefit, but rather on the seeming incongruity of allowing the endogenous urea clearance to fall below the time-averaged dialytic urea clearance recommended for anephric patients. In essence, the guideline suggested that physicians declare the native kidney inadequate when it failed to remove urea as well as the dialysis machine. The guideline has since been revised and a controlled study has shown that dialysis can safely be initiated based on the appearance of symptoms rather than at a specified GFR(55).
For some solutes, it may be necessary to consider endogenous nonrenal clearance when estimating the effect of dialysis on plasma levels. The effect of nonrenal clearance is to limit the reduction in solute levels achieved by increasing the intensity of dialysis. Low molecular weight proteins may be cleared by a nonrenal process, which becomes relatively more important as the GFR falls. Along with delayed equilibration between the interstitial fluid and plasma, nonrenal clearance is presumably responsible for the finding that a nearly 10-fold increase in β2-microglobulin clearance produced only about a 15% reduction in predialysis β2-microglobulin levels in the HEMO study (56,57). Whether there is important nonrenal clearance of any small uremic solutes remains unknown.
The Problem of Solute Production
In prescribing dialysis to achieve a target Kt/Vurea, we assume that uremic toxins are produced in proportion to the body water volume, which is roughly proportional to body weight. It has been pointed out that this assumption is not biologically probable. Among animals, native kidney size and metabolic rate are proportional not to body weight but more nearly to body surface area, which varies with weight to the three-fourths power among different species (58–60). In the absence of information to the contrary, it seems logical to assume that the production of uremic toxins is also proportional to body surface area. This assumption would require that smaller patients get relatively more, and larger patients relatively less, dialysis than we prescribe currently (61,62).
For most adult patients, the error we may make in prescribing dialysis based on body weight rather than on surface area is modest. There is a larger problem with fixing the product of clearance and time relative to body size, in that it ignores possible differences in solute production among individuals. It assumes that toxic solutes are produced at a constant rate proportional to body size in all patients, and has discouraged attempts to reduce solute production. Interventions that reduce the solute production could lower solute levels without increasing dialysis time and cost. Uremic solutes made in the colon provide a particularly attractive target for such interventions (63–65). As they are made in an isolated compartment by microbes, their production could prove simpler to suppress than the production of other solutes. Early results suggest that increasing dietary fiber could suppress the production of uremic solutes made by colon microbes from amino acids that escape digestion in the small intestine (66). It remains to be shown whether reducing the production of such solutes will improve clinical outcomes.
Summary
Hemodialysis treatment must accomplish more than the removal of waste solutes. The benefit of different dialysis prescriptions also depends on how effectively extracellular fluid volume and inorganic ion concentrations are controlled. Judging the effect of dialysis prescriptions on waste solute removal presents a particularly difficult problem, however, because we do not know what we are trying to remove.
The current solution to the problem of waste solute removal is to define an adequate dose of dialysis on the basis of the fraction of urea removed from the body. This has provided a practical guide to treatment as the dialysis population has grown over the past 25 years. A lower limit to Kt/Vurea (or the related urea reduction ratio) is now a quality indicator established by the Centers for Medicare and Medicaid for chronic hemodialysis patients in the United States. For the present, a minimal standard based on urea seems useful to avoid grossly inadequate treatment. The concept of a dialysis dose based on measurement of a single solute, however, does not provide a useful guide toward improved treatment. It ignores the fact that prescriptions that have similar effects on the index solute can have widely different effects on other solutes. The magnitude of such differences may increase when we compare regimens that depart markedly from conventional, thrice weekly incenter dialysis. The dose concept further assumes that important solutes are produced at a constant rate relative to body size, and discourages attempts to augment dialysis treatment by reducing solute production.
Ultimately, the benefits of new treatments must be established by clinical trials. Trials comparing treatments that differ in duration, frequency, and other parameters can be performed without knowing which solutes are toxic. However, such trials are difficult and expensive, and their number will continue to be limited. Identification of toxic solutes would provide a more rational basis for the design of trials and ultimately for improved treatment of patients with renal failure.
Acknowledgments
TLS was supported by a National Kidney Foundation Fellowship. Other support was provided by the NIH (R01 DK080123).
Footnotes
Competing Financial Interest
The authors have no financial interests to disclose.
References
- 1.Hemodialysis Adequacy 2006 Work Group. Clinical practice guidelines for hemodialysis adequacy, update 2006. Am J Kidney Dis. 2006;48(Suppl 1):S2–S90. doi: 10.1053/j.ajkd.2006.03.051. [DOI] [PubMed] [Google Scholar]
- 2.Depner TA. Prescribing Hemodialysis: A Guide to Urea Modeling. Norwall, MA: Kluwer Academic Publishers; 1991. [Google Scholar]
- 3.Lowrie EG, Laird NM, Parker TF, Sargent JA. Effect of the hemodialysis prescription of patient morbidity: report from the National Cooperative Dialysis Study. N Engl J Med. 1981;305:1176–1181. doi: 10.1056/NEJM198111123052003. [DOI] [PubMed] [Google Scholar]
- 4.Burton BT. Adequacy of dialysis. Introduction: purpose of the conference. Kidney Int. 1975;7(Suppl 2):S1. [PubMed] [Google Scholar]
- 5.Teschan PE. Electroencephalographic and other neurophysiological abnormalities in uremia. Kidney Int. 1975;7(Suppl 2):S210–S216. [PubMed] [Google Scholar]
- 6.Tyler HR. Neurological aspects of uremia: an overview. Kidney Int. 1975;7(Suppl 2):S188–S193. [PubMed] [Google Scholar]
- 7.Sargent JA, Gotch FA. The analysis of concentration dependence of uremic lesions in clinical studies. Kidney Int. 1975;7(Suppl 2):S35–S44. [PubMed] [Google Scholar]
- 8.Scribner BH, Babb AL. Evidence for toxins of “middle” molecular weight. Kidney Int. 1975;7(Suppl 2):349–351. [PubMed] [Google Scholar]
- 9.Henderson LW, Ford C, Colton CK, Bluemle LW, Bixler HJ. Uremic blood cleansing by diafiltration using a hollow fiber ultrafilter. Trans Am Soc Artif Intern Organs. 1970;16:107–112. [PubMed] [Google Scholar]
- 10.Gotch FA, Sargent JA. A mechanistic analysis of the National Cooperative Dialysis Study (NCDS) Kidney Int. 1985;28:526–534. doi: 10.1038/ki.1985.160. [DOI] [PubMed] [Google Scholar]
- 11.Schreiner G, Maher J. Biochemistry of Uremia, in Uremia. Springfield, IL: Charles Thomas; 1960. [Google Scholar]
- 12.Johnson WJ, Hagge WW, Wagoner RD, Dinapoli RP, Rosevear JW. Effects of urea loading in patients with far-advanced renal failure. Mayo Clin Proc. 1972;47:21–29. [PubMed] [Google Scholar]
- 13.Vanholder R, De Smet R, Glorieux G, Argiles A, Baurmeister U, Brunet P, Clark W, Cohen G, De Deyn PP, Deppisch R, Descamps-Latscha B, Henle T, Jorres A, Lemke HD, Massy ZA, Passlick-Deetjen J, Rodriguez M, Stegmayr B, Stenvinkel P, Tetta C, Wanner C, Zidek W. Review on uremic toxins: classification, concentration, and interindividual variability. Kidney Int. 2003;63:1934–1943. doi: 10.1046/j.1523-1755.2003.00924.x. [DOI] [PubMed] [Google Scholar]
- 14.Depner TA. “Artificial” hemodialysis versus “natural” hemofiltration. Am J Kidney Dis. 2008;52:403–406. doi: 10.1053/j.ajkd.2008.07.007. [DOI] [PubMed] [Google Scholar]
- 15.Thomas G, Jaber BL. Convective therapies for removal of middle molecular weight uremic toxins in end-stage renal disease: a review of the evidence. Semin Dial. 2009;22:610–614. doi: 10.1111/j.1525-139X.2009.00665.x. [DOI] [PubMed] [Google Scholar]
- 16.Eknoyan G, Beck GJ, Cheung AK, Daugirdas JT, Greene T, Kusek JW, Allon M, Bailey J, Delmez JA, Depner TA, Dwyer JT, Levey AS, Levin NW, Milford E, Ornt DB, Rocco MV, Schulman G, Schwab SJ, Teehan BP, Toto R. Effect of dialysis dose and membrane flux in maintenance hemodialysis. N Engl J Med. 2002;347:2010–2019. doi: 10.1056/NEJMoa021583. [DOI] [PubMed] [Google Scholar]
- 17.Gulyassy PF. Can dialysis remove protein bound toxins that accumulate because of renal secretory failure? ASAIO J. 1994;40:92–94. [PubMed] [Google Scholar]
- 18.Jourde-Chiche N, Dou L, Cerini C, Dignat-George F, Vanholder R, Brunet P. Protein-bound toxins – update 2009. Semin Dial. 2009;22:334–339. doi: 10.1111/j.1525-139X.2009.00576.x. [DOI] [PubMed] [Google Scholar]
- 19.Meijers BK, Bammens B, Verbeke K, Evenepoel P. A review of albumin binding in CKD. Am J Kidney Dis. 2008;51:839–850. doi: 10.1053/j.ajkd.2007.12.035. [DOI] [PubMed] [Google Scholar]
- 20.Lesaffer G, De Smet R, Lameire N, Dhondt A, Duym P, Vanholder R. Intradialytic removal of protein-bound uraemic toxins: role of solute characteristics and of dialyser membrane. Nephrol Dial Transplant. 2000;15:50–57. doi: 10.1093/ndt/15.1.50. [DOI] [PubMed] [Google Scholar]
- 21.Meyer TW, Leeper EC, Bartlett DW, Depner TA, Lit YZ, Robertson CR, Hostetter TH. Increasing dialysate flow and dialyzer mass transfer area coefficient to increase the clearance of protein-bound solutes. J Am Soc Nephrol. 2004;15:1927–1935. doi: 10.1097/01.asn.0000131521.62256.f0. [DOI] [PubMed] [Google Scholar]
- 22.Niwa T. Indoxyl sulfate is a nephro-vascular toxin. J Ren Nutr. 2010;20:S2– S6. doi: 10.1053/j.jrn.2010.05.002. [DOI] [PubMed] [Google Scholar]
- 23.Meijers BK, Van Kerckhoven S, Verbeke K, Dehaen W, Vanrenterghem Y, Hoylaerts MF, Evenepoel P. The uremic retention solute p-cresyl sulfate and markers of endothelial damage. Am J Kidney Dis. 2009;54:891–901. doi: 10.1053/j.ajkd.2009.04.022. [DOI] [PubMed] [Google Scholar]
- 24.Roch-Ramel F, Besseghir K, Murer H. Renal excretion and tubular transport of organic anions and cations. In: Windhager E, editor. Handbook of Physiology, Section 8: Renal Physiology. Oxford: Oxford University Press; 1992. pp. 2188–2262. [Google Scholar]
- 25.Kult J, Stapf E. Changing emphasis in modern hemodialysis therapies: cost-effectiveness of delivering higher doses of dialysis. Int J Artif Organs. 2007;30:577–582. doi: 10.1177/039139880703000704. [DOI] [PubMed] [Google Scholar]
- 26.Bhimani JP, Ouseph R, Ward RA. Effect of increasing dialysate flow rate on diffusive mass transfer of urea, phosphate and beta2-microglobulin during clinical haemodialysis. Nephrol Dial Transplant. 2010;25:3990–3995. doi: 10.1093/ndt/gfq326. [DOI] [PMC free article] [PubMed] [Google Scholar]
- 27.Luo FJ, Patel KP, Marquez IO, Plummer NS, Hostetter TH, Meyer TW. Effect of increasing dialyzer mass transfer area coefficient and dialysate flow on clearance of protein-bound solutes: a pilot crossover trial. Am J Kidney Di. 2009;53:1042–1049. doi: 10.1053/j.ajkd.2009.01.265. [DOI] [PMC free article] [PubMed] [Google Scholar]
- 28.Bammens B, Evenepoel P, Verbeke K, Vanrenterghem Y. Removal of the protein-bound solute p-cresol by convective transport: a randomized crossover study. Am J Kidney Dis. 2004;44:278–285. doi: 10.1053/j.ajkd.2004.04.033. [DOI] [PubMed] [Google Scholar]
- 29.Meyer TW, Peattie JW, Miller JD, Dinh DC, Recht NS, Walther JL, Hostetter TH. Increasing the clearance of protein-bound solutes by addition of a sorbent to the dialysate. J Am Soc Nephrol. 2007;18:868–874. doi: 10.1681/ASN.2006080863. [DOI] [PubMed] [Google Scholar]
- 30.Meert N, Eloot S, Waterloos MA, Van Landschoot M, Dhondt A, Glorieux G, Ledebo I, Vanholder R. Effective removal of protein-bound uraemic solutes by different convective strategies: a prospective trial. Nephrol Dial Transplant. 2009;24:562–570. doi: 10.1093/ndt/gfn522. [DOI] [PubMed] [Google Scholar]
- 31.Depner TA. Uremic toxicity: urea and beyond. Semin Dial. 2001;14:246–251. doi: 10.1046/j.1525-139x.2001.00072.x. [DOI] [PubMed] [Google Scholar]
- 32.Schneditz D, Daugirdas JT. Compartment effects in hemodialysis. Semin Dial. 2001;14:271–277. doi: 10.1046/j.1525-139x.2001.00066.x. [DOI] [PubMed] [Google Scholar]
- 33.Heaf JG, Jensen SB, Jensen K, Ali S, von Jessen F. The cellular clearance theory does not explain the post-dialytic small molecule rebound. Scand J Urol Nephrol. 1998;32:350–355. doi: 10.1080/003655998750015322. [DOI] [PubMed] [Google Scholar]
- 34.Schneditz D, Platzer D, Daugirdas JT. A diffusion-adjusted regional blood flow model to predict solute kinetics during haemodialysis. Nephrol Dial Transplant. 2009;24:2218–2224. doi: 10.1093/ndt/gfp023. [DOI] [PubMed] [Google Scholar]
- 35.Depner TA, Rizwan S, Cheer AY, Wagner JM, Eder LA. High venous urea concentrations in the opposite arm. A consequence of hemodialysis-induced compartment disequilibrium. Trans Am Soc Artif Intern Organs. 1991;37:M141–M143. [PubMed] [Google Scholar]
- 36.Ziolko M, Pietrzyk JA, Grabska-Chrzastowska J. Accuracy of hemodialysis modeling. Kidney Int. 2000;57:1152–1163. doi: 10.1046/j.1523-1755.2000.00942.x. [DOI] [PubMed] [Google Scholar]
- 37.Eloot S, Torremans A, De Smet R, Marescau B, De Wachter D, De Deyn PP, Lameire N, Verdonck P, Vanholder R. Kinetic behavior of urea is different from that of other water-soluble compounds: the case of the guanidino compounds. Kidney Int. 2005;67:1566–1575. doi: 10.1111/j.1523-1755.2005.00238.x. [DOI] [PubMed] [Google Scholar]
- 38.Ponda MP, Quan Z, Melamed ML, Raff A, Meyer TW, Hostetter TH. Methylamine clearance by haemodialysis is low. Nephrol Dial Transplant. 2009;25:1608–1613. doi: 10.1093/ndt/gfp629. [DOI] [PMC free article] [PubMed] [Google Scholar]
- 39.Eloot S, Torremans A, De Smet R, Marescau B, De Deyn PP, Verdonck P, Vanholder R. Complex compartmental behavior of small water-soluble uremic retention solutes: evaluation by direct measurements in plasma and erythrocytes. Am J Kidney Dis. 2007;50:279–288. doi: 10.1053/j.ajkd.2007.05.009. [DOI] [PubMed] [Google Scholar]
- 40.Spalding EM, Chamney PW, Farrington K. Phosphate kinetics during hemodialysis: evidence for biphasic regulation. Kidney Int. 2002;61:655–667. doi: 10.1046/j.1523-1755.2002.00146.x. [DOI] [PubMed] [Google Scholar]
- 41.Charra B, Terrat JC, Vanel T, Chazot C, Jean G, Hurot JM, Lorriaux C. Long thrice weekly hemodialysis: the Tassin experience. Int J Artif Organs. 2004;27:265–283. doi: 10.1177/039139880402700403. [DOI] [PubMed] [Google Scholar]
- 42.Tattersall JE, DeTakats D, Chamney P, Greenwood RN, Farrington K. The post-hemodialysis rebound: predicting and quantifying its effect on Kt/V. Kidney Int. 1996;50:2094–2102. doi: 10.1038/ki.1996.534. [DOI] [PubMed] [Google Scholar]
- 43.Depner T, Beck G, Daugirdas J, Kusek J, Eknoyan G. Lessons from the Hemodialysis (HEMO) Study: an improved measure of the actual hemodialysis dose. Am J Kidney Dis. 1999;33:142–149. doi: 10.1016/s0272-6386(99)70272-6. [DOI] [PubMed] [Google Scholar]
- 44.Daugirdas JT, Greene T, Depner TA, Leypoldt J, Gotch F, Schulman G, Star R. Factors that affect postdialysis rebound in serum urea concentration, including the rate of dialysis: results from the HEMO Study. J Am Soc Nephrol. 2004;15:194–203. doi: 10.1097/01.asn.0000103871.20736.0c. [DOI] [PubMed] [Google Scholar]
- 45.Leypoldt JK, Cheung AK. Revisiting the hemodialysis dose. Semin Dial. 2006;19:96–101. doi: 10.1111/j.1525-139X.2006.00132.x. [DOI] [PubMed] [Google Scholar]
- 46.Gotch FA. Is Kt/V urea a satisfactory measure for dosing the newer dialysis regimens? Semin Dial. 2001;14:15–17. doi: 10.1046/j.1525-139x.2001.00003-4.x. [DOI] [PubMed] [Google Scholar]
- 47.Leypoldt JK, Jaber BL, Zimmerman DL. Predicting treatment dose for novel therapies using urea standard Kt/V. Semin Dial. 2004;17:142–145. doi: 10.1111/j.0894-0959.2004.17212.x. [DOI] [PubMed] [Google Scholar]
- 48.Daugirdas JT, Depner TA, Greene T, Levin NW, Chertow GM, Rocco MV. Standard Kt/V urea: a method of calculation that includes effects of fluid removal and residual kidney clearance. Kidney Int. 2010;77:637–644. doi: 10.1038/ki.2009.525. [DOI] [PubMed] [Google Scholar]
- 49.Casino FG, Lopez T. The equivalent renal urea clearance. a new parameter to assess dialysis dose. Nephrol Dial Transplant. 1996;11:1574–1581. [PubMed] [Google Scholar]
- 50.Depner TA, Bhat A. Quantifying daily hemodialysis. Semin Dial. 2004;17:79– 84. doi: 10.1111/j.0894-0959.2004.17201.x. [DOI] [PubMed] [Google Scholar]
- 51.Lopot F, Nejedly B, Sulkova S. Physiology in daily hemodialysis in terms of the time average concentration/time average deviation concept. Hemodial Int. 2004;8:39–44. doi: 10.1111/j.1492-7535.2004.00073.x. [DOI] [PubMed] [Google Scholar]
- 52.Gotch F. The basic, quantifiable parameter of dialysis prescription is Kt/V urea; treatment time is determined by the ultrafiltration requirement; all three parameters are of equal importance. Blood Purif. 2007;25:18– 26. doi: 10.1159/000096392. [DOI] [PubMed] [Google Scholar]
- 53.Section II. Haemodialysis adequacy. Nephrol Dial Transplant. 2002;17(Suppl 7):16–31. [PubMed] [Google Scholar]
- 54.Marquez IO, Tambra S, Luo FY, Li Y, Plummer NS, Hostetter TH, Meyer TW. Contribution of residual function to removal of protein-bound solutes in hemodialysis. Clin J Am Soc Nephrol. 2011;6:290–296. doi: 10.2215/CJN.06100710. [DOI] [PMC free article] [PubMed] [Google Scholar]
- 55.Cooper BA, Branley P, Bulfone L, Collins JF, Craig JC, Fraenkel MB, Harris A, Johnson DW, Kesselhut J, Li JJ, Luxton G, Pilmore A, Tiller DJ, Harris DC, Pollock CA. A randomized, controlled trial of early versus late initiation of dialysis. New Engl J Med. 2010;363:609–619. doi: 10.1056/NEJMoa1000552. [DOI] [PubMed] [Google Scholar]
- 56.Cheung AK, Rocco MV, Yan G, Leypoldt JK, Levin NW, Greene T, Agodoa L, Bailey J, Beck GJ, Clark W, Levey AS, Ornt DB, Schulman G, Schwab S, Teehan B, Eknoyan G. Serum beta-2 microglobulin levels predict mortality in dialysis patients: results of the HEMO Study. J Am Soc Nephrol. 2006;17:546–555. doi: 10.1681/ASN.2005020132. [DOI] [PubMed] [Google Scholar]
- 57.Ward RA, Greene T, Hartmann B, Samtleben W. Resistance to inter-compartmental mass transfer limits beta2-microglobulin removal by post-dilution hemodiafiltration. Kidney Int. 2006;69:1431–1437. doi: 10.1038/sj.ki.5000048. [DOI] [PubMed] [Google Scholar]
- 58.Schmidt-Nielsen K. Scaling: Why is animal size so important? Cambridge: Cambridge University Press; 1984. [Google Scholar]
- 59.Singer MA, Morton AR. Mouse to elephant: biological scaling and Kt/V. Am J Kidney Dis. 2000;35:306–309. doi: 10.1016/s0272-6386(00)70341-6. [DOI] [PubMed] [Google Scholar]
- 60.Beuchat CA. Structure and concentrating ability of the mammalian kidney: correlations with habitat. Am J Physiol. 1996;271:R157–R179. doi: 10.1152/ajpregu.1996.271.1.R157. [DOI] [PubMed] [Google Scholar]
- 61.Sarkar SR, Kuhlmann MK, Kotanko P, Zhu F, Heymsfield SB, Wang J, Meisels IS, Gotch FA, Kaysen GA, Levin NW. Metabolic consequences of body size and body composition in hemodialysis patients. Kidney Int. 2006;70:1832–1839. doi: 10.1038/sj.ki.5001895. [DOI] [PubMed] [Google Scholar]
- 62.Spalding EM, Chandna SM, Davenport A, Farrington K. Kt/V underestimates the hemodialysis dose in women and small men. Kidney Int. 2008;74:348–355. doi: 10.1038/ki.2008.185. [DOI] [PubMed] [Google Scholar]
- 63.Evenepoel P, Meijers BK, Bammens BR, Verbeke K. Uremic toxins originating from colonic microbial metabolism. Kidney Int. 2009;76(Suppl 114):S12–S19. doi: 10.1038/ki.2009.402. [DOI] [PubMed] [Google Scholar]
- 64.Schepers E, Glorieux G, Vanholder R. The gut: the forgotten organ in uremia? Blood Purif. 2010;29:130–136. doi: 10.1159/000245639. [DOI] [PubMed] [Google Scholar]
- 65.Aronov P, Luo FY, Plummer NS, Quan Z, Hostetter TH, Meyer TW. The multiplicity of colon-derived uremic solutes. J Am Soc Nephrol. 2011 ePub ahead of print. [Google Scholar]
- 66.Meijers BK, De Preter V, Verbeke K, Vanrenterghem Y, Evenepoel P. p-Cresyl sulfate serum concentrations in haemodialysis patients are reduced by the prebiotic oligofructose-enriched inulin. Nephrol Dial Transplant. 2009;25:219–224. doi: 10.1093/ndt/gfp414. [DOI] [PubMed] [Google Scholar]
- 67.Martinez AW, Recht NS, Hostetter TH, Meyer TW. Removal of p-cresol sulfate by hemodialysis. J Am Soc Nephrol. 2005;16:3430–3436. doi: 10.1681/ASN.2005030310. [DOI] [PubMed] [Google Scholar]
- 68.Walther JL, Bartlett DW, Chew W, Robertson CR, Hostetter TH, Meyer TW. Downloadable computer models for renal replacement therapy. Kidney Int. 2006;69:1056–1063. doi: 10.1038/sj.ki.5000196. [DOI] [PubMed] [Google Scholar]