Abstract
Regulatory T cells (Treg) are critical in maintaining immune tolerance and suppressing autoimmunity. The transcription factor Foxp3 serves as a master switch that controls the development and function of Treg. Foxp3 expression is epigenetically regulated by DNA methylation, and DNA methyltransferase (DNMT) inhibitors can induce Foxp3 expression in naive CD4+ T cells. We showed that EGCG, a major green tea polyphenol, could act as a dietary DNMT inhibitor, and induced Foxp3 and IL-10 expression in CD4+ Jurkat T cells at physiologically relevant concentrations in vitro. We further showed that mice treated with EGCG in vivo had significantly increased Treg frequencies and numbers in spleen and lymph nodes and had inhibited T cell response. Induction of Foxp3 expression correlated with a concomitant reduction in DNMT expression and a decrease in global DNA methylation. Our data suggested that EGCG can induce Foxp3 expression and increase Treg frequency via a novel epigenetic mechanism. While the DNMT inhibitory effects of EGCG was not as potent as pharmacologic agents such as 5-aza-2′-deoxycytidine, the ability of dietary agents to target similar mechanisms offers opportunities for potentially sustained and longer-term exposures with lower toxicity. Our work provides the foundation for future studies to further examine and evaluate dietary strategies to modulate immune function.
Keywords: Regulatory T cells, Foxp3, DNA methylation, Green tea polyphenols
1. Introduction
Regulatory T cells (Treg) play a pivotal role in the maintenance of immune tolerance and the suppression of autoimmunity [1,2]. Disruption of Treg development and function results in immune dysregulation and autoimmune diseases. Treg differentiation is regulated by Foxp3, a member of the forkhead/winged-helix family of transcription factors which serves as a master regulator for Treg generation [3]. Recent reports demonstrated that the expression and stability of Foxp3 is epigenetically regulated [4]. Several groups identified conserved noncoding regions within the Foxp3 locus that are specifically unmethylated in Treg, allowing Foxp3 expression, but heavily methylated in naïve CD4+ T cells, where Foxp3 expression is repressed [5,6]. Demethylation of Foxp3 promoter in naïve CD4+ T cells using DNA methyltransferase (DNMT) inhibitors such as 5-aza-2′-deoxycytidine (Aza) results in de-repressed and stable expression of Foxp3, and the subsequent differentiation of naïve CD4+ T cells into Treg [4]. The epigenetic regulation of Foxp3 can be potentially exploited in generating suppressive Treg for therapeutic purposes, and is of significant clinical importance for the suppression of autoimmune diseases. However, a major disadvantage in using potent DNA methylation inhibitors such as Aza as a therapeutic is their associated toxicity [7,8].
Epigallocatechin-3-gallate (EGCG) is the major polyphenol in green tea, and is responsible for much of the health promoting properties of green tea, including anti-inflammatory and anti-carcinogenic effects [9]. Recent studies indicate that EGCG can alter gene expression by inhibiting DNMT activities, resulting in the reactivation of methylation-silenced genes [10,11]. Several diet-derived compounds have been shown to control gene expression via epigenetic modifications [12,13], and may be a novel mechanism by which diet affects immune regulation and enhance Treg numbers and function with lower toxicity. In this study, we examined the ability of EGCG in inducing Treg in vitro and in vivo. We hypothesized that EGCG, via its DNMT inhibitory activity, can induce Foxp3 promoter demethylation, resulting in the differentiation and expansion of Treg.
2. Materials and methods
2.1. Cell culture and in vitro treatments
Human Jurkat leukemic CD4+ T cell line was obtained from ATCC (Manassas, VA), and was maintained in RPMI1640 medium supplemented with 10% fetal bovine serum. Jurkat T cells were adjusted to a cell concentration of 1 × 10⁶ cells/mL, and were incubated in the presence or absence of Aza (Sigma, St. Louis, MO) (5 μM) or EGCG (Sigma) at 2, 10, or 50 μM for 24 h to 72 h. For EGCG treatments, media were removed each day and cells were replenished with fresh media containing EGCG. For green tea treatments, green tea (2%, w/v) was brewed for 2 min in boiling water with constant stirring, and sterilized by filtration using a 0.22 μm filter. Green tea was purchased from Harney & Sons (Millerton, NY). EGCG content was determined by HPLC [14]. The average EGCG concentration in 2% green tea was 598 ± 31 μg/mL.
2.2. Animal studies and in vivo treatments
Eight-week old Balb/c male mice were purchased from Jackson Laboratory (Bar Harbor, ME). All mice were housed in a temperature- and humidity-controlled environment. Food and water were provided ad libitum. Mice were either left untreated, or injected i.p. daily with 1 mg EGCG per mouse (50 mg/kg) for a total of 7 days. Mice were sacrificed on day 8 by CO2 asphyxiation, and lymphoid organs including thymus, spleen and lymph nodes from individual mice were collected. All procedures involving animals and their care were conducted in accordance with the guidelines as specified in the animal protocol approved by the Oregon State University Institutional Laboratory Animal Care and Use Committee.
2.3. Plasma EGCG
Plasma EGCG was measured by HPLC following enzymatic hydrolysis. Plasma (200 μL) collected from untreated mice or at various time points from mice administered EGCG i.p. was mixed with 20 μL of 10% ascorbic acid containing 2.5 mM diethylenetriamine pentaacetic acid (DTPA). The sample was then subjected to enzymatic hydrolysis (45 min, 37 °C) using 790 U β-glucuronidase and 38 U sulfatase prepared in 0.4 M sodium phosphate buffer (pH 5.0) containing 2.5 mM DTPA. Samples were rapidly chilled on ice and EGCG was extracted three times using 2 mL of ethyl acetate. Extracts were combined, dried under nitrogen gas, reconstituted in 200 μL of 2% formic acid, and injected on an HPLC-Coularray system (ESA Inc., Chelmsford, MA). Samples were separated by binary gradient at 0.9 mL/min as described [15], with minor modifications, using an Xterra RP-C18 column (100 mm × 3.9 mm id, 3.5 μm, Waters, Milford, MA). Mobile phase A consisted of 899:100:1 water/acetonitrile/formic acid containing EDTA (150 mg/L) and mobile phase B consisted of 699:300:1 water/acetonitrile/formic acid containing EDTA (150 mg/L) and the gradient was delivered as follows: 1–99% B from 0 to 7 min, returning to initial conditions over 2 min, and then the system was re-equilibrated at 1% for 4 min. EGCG was detected using potential settings of 200, 270, 340, and 410 mV and was quantified at its dominant electrochemical potential relative to external standards.
2.4. Foxp3, IL-10, and DNA methyltransferase expression
Total RNA was isolated using Trizol reagent (Invitrogen, Carlsbad, CA). One microgram of total RNA was reverse transcribed into cDNA using SuperScript III First-Strand Synthesis SuperMix for qRT-PCR (Invitrogen). Real time PCR was performed using gene-specific primers as follows: Foxp3 (forward: 5′-CGGACCATCTTCTGGATGAG-3′, reverse: 5′-TTGTCGGATGATGCCACAG-3′), IL-10 (forward: 5′-GCTGGAGGACTTTAAGGGTTACCT-3′, reverse: 5′-CTTGATGTCTGGGTCTTGGTTCT-3′), DNMT1 (forward: 5′-GTGGGGGACTGTGTCTCTGT-3′, reverse: 5′-TGAAAGCTGCATGTCCTCAC-3′), DNMT3a (forward: 5′-CACACAGAAGCATATCCAGGAGTG-3′, reverse: 5′-AGTGGACTGGGAAACCAAATACCC-3′), DNMT3b (forward: 5′-AATGTGAATCCAGCCAGGAAAGGC-3′, reverse: 5′-ACTGGATTACACTCCAGGAACCGT-3′), and GAPDH (forward: 5′-CGAGATCCCTCCAAAATCAA-3′, reverse: 5′-TTCACACCCATGACGAACAT-3′). Real time PCR reactions were performed using DyNAmo HS SYBR Green qPCR kit (New England Biolabs). Gene copies were determined using the standard curve method. A standard curve was generated from serial dilutions of purified plasmid DNA that encoded for each gene of interest. Data represent the copy number of the gene of interest normalized to the copy number of housekeeping gene (GAPDH).
2.5. Genomic DNA isolation and global DNA methylation analyses
Genomic DNA was isolated using DNeasy Blood and Tissue kit (Qiagen, Valencia, CA). Global DNA methylation was measured using SuperSense Methylated DNA Quantification Kit (Epigentek, Brooklyn, NY), and was reported as relative fluorescence units (RFU) per 100 ng genomic DNA.
2.6. Quantification of Treg frequency and numbers
Spleen, lymph nodes, and thymus from individual mouse were made into single cell suspensions. Red blood cells were removed from splenocytes by incubating with red blood cell lysis buffer (150 mM NH4Cl, 1 mM KHCO3, 0.1 mM EDTA, pH 7.2). Total cell number from each organ was determined using the Z1 Coulter Particle Counter (Beckman Coulter). The frequency of Treg was determined by flow cytometry using Mouse Regulatory T Cell Staining kit (eBioscience, San Diego, CA), where Treg were identified by a combination of cell surface expression of CD4 and CD25, and intracellular expression of Foxp3. Data were acquired using FACSCalibur (BD Biosciences, San Jose, CA). A minimum of 20,000 events in the lymphocyte gate were collected. Data analyses were performed using Summit software (DakoCytomation, Carpinteria, CA). Total Treg was calculated based on Treg frequency and total cell numbers per lymphoid organ.
2.7. Ex vivo T cell functional assays
T cell proliferation and IFNγ production in mice treated with EGCG were assessed ex vivo. Splenocytes from individual mice were seeded at 2 × 10⁵ cells per well in 96-well tissue culture plates, and stimulated with 5 μg/mL plate-bound anti-CD3 antibodies (eBiosciences) for 48 h. At the end of incubation, culture supernatants were collected to determine IFNγ production using Mouse IFNγ Ready-SET-Go ELISA kit (eBiosciences). T cell proliferation was determined using standard MTT proliferation assay [16].
Treg suppression assay was performed as described [17] with the following modifications: CD4+CD25+ Treg and CD4+CD25− T cells were isolated from the spleens of individual untreated or EGCG-treated mice using MACS cell separation columns and mouse CD4+CD25+ Regulatory T Cell Isolation Kit (Miltenyi Biotech, Auburn, CA). Graded doses of purified CD4+CD25+ Treg isolated from untreated or EGCG-treated mice were co-cultured in 96-well plates with 1 × 10⁵ cells CD4+CD25− responder T cells (isolated from untreated mice only) in the presence of 1 μg/mL plate-bound anti-CD3 (eBioscience) and 1 × 10⁵ accessory cells (mitomycin C-treated, T cell depleted splenocytes) for 72 h at 37 °C. Responder:Treg ratios ranged from 1:1 to 16:1 per well. T cell proliferation was determined using standard MTT proliferation assay. Percent suppression was determined by the following equation:
2.8. Statistical analysis
Statistical analyses were performed using GraphPad Prism Version 5.02 (GraphPad, La Jolla, CA). All data were reported as mean ± SEM. P values were determined using unpaired t test or one-way ANOVA where appropriate. Statistical significance was defined as P ≤ 0.05.
3. Results
3.1. EGCG and green tea induced Foxp3 and IL-10 expression in Jurkat T cells
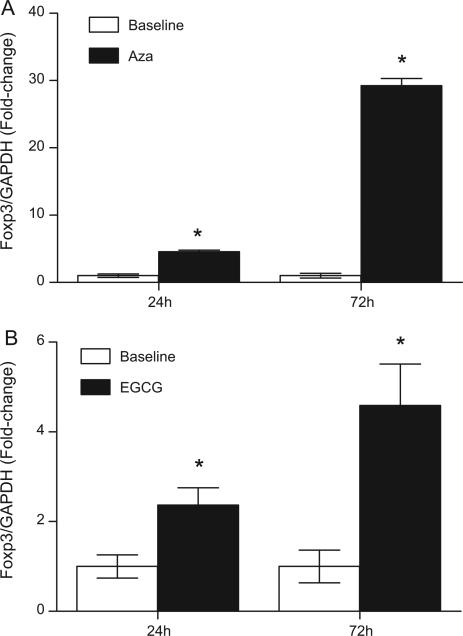
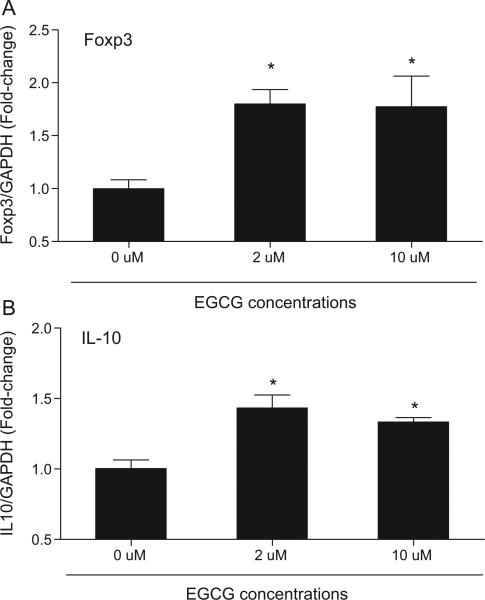
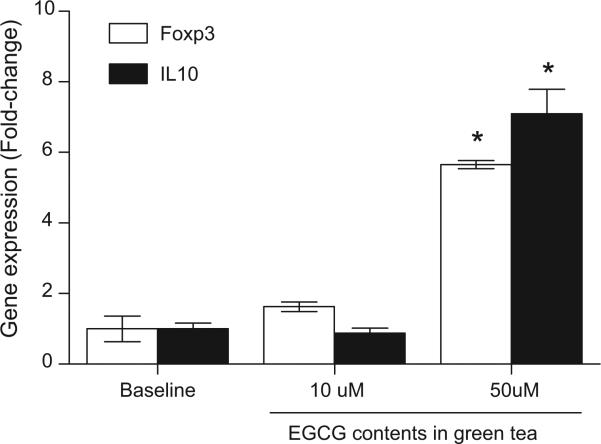
The ability of EGCG to induce Foxp3 expression was tested in Jurkat T cells, a human CD4+ leukemic T cell line. Aza, a potent DNMT inhibitor that has been reported to induce Foxp3 expression in CD4+ T cells was used as a positive control [6]. Both EGCG and Aza induced a significant increase in Foxp3 expression compared to baseline control (Fig. 1). In agreement with previous reports, Aza was a potent inducer of Foxp3 expression, and Jurkat T cells treated with 5 μM Aza had an average of 4.6-fold and 29.3-fold increase in Foxp3 expression at 24 h and 72 h, respectively (Fig. 1A). Jurkat cells treated with 50 μM EGCG had an average of 2.4-fold and 4.6-fold increased in Foxp3 expression at 24 h and 72 h, respectively (Fig. 1B). To determine if EGCG at physiologically relevant concentrations (<10 μM) [18–20] can similarly induce Foxp3 expression, Jurkat T cells were treated with 2 μM and 10 μM EGCG for 72 h and tested for Foxp3 expression (Fig. 2). The expression of IL-10, an immunosuppressive cytokine that is expressed in Treg, was also tested. Significant induction of both Foxp3 (Fig. 2A) and IL-10 (Fig. 2B) expression were detected in Jurkat T cells treated with 2 μM and 10 μM EGCG. Next, to determine if green tea, as a whole food, could similarly induce Foxp3 and IL-10 expression, Jurkat T cells were treated with diluted green tea containing the equivalence of 10 μM and 50 μM EGCG for 72 h (Fig. 3). Both Foxp3 and IL-10 expression were significantly induced (5.7-fold and 7.1-fold, respectively) with green tea at 50 μM EGCG equivalence compared to untreated cells. Cells treated with green tea at 10 μM EGCG did not significantly induce Foxp3 and IL-10 expression.
Fig. 1.
EGCG and Aza induced Foxp3 expression in Jurkat T cells in vitro. Jurkat T cells were left untreated (baseline), or treated with Aza at 5 μM (A) or EGCG at 50 μM (B) for 24 h or 72 h. At the end of incubation, cells were harvested and analyzed for Foxp3 expression by real time PCR. Foxp3 gene expression was normalized to GAPDH housekeeping gene. Data represent mean normalized fold-change ± SEM. *P < 0.05 versus baseline. Results are representative of a minimum of three independent experiments.
Fig. 2.
EGCG induced Foxp3 and IL-10 expression at physiologically relevant concentrations in Jurkat T cells in vitro. Jurkat T cells were treated with 0, 2 or 10 μM EGCG for 72 h. At the end of incubation, cells were harvested and analyzed for Foxp3 (A) or IL-10 (B) expression by real time PCR. Gene expression was normalized to GAPDH housekeeping gene. Data represent mean normalized fold-change ± SEM. *P < 0.05 versus 0 μM. Results are representative of a minimum of three independent experiments.
Fig. 3.
Green tea induced Foxp3 and IL-10 expression in Jurkat T cells in vitro. Jurkat T cells were left untreated (baseline), or treated with diluted green tea containing the equivalence of 10 and 50 μM EGCG for 72 h. At the end of incubation, cells were harvested and analyzed for Foxp3 (open bar) or IL-10 (solid bar) expression by real time PCR. Gene expression was normalized to GAPDH housekeeping gene. Data represent mean normalized fold-change ± SEM. *P < 0.05 versus baseline. Results are representative of two independent experiments.
3.2. EGCG decreased global DNA methylation and DNMT expression in Jurkat T cells
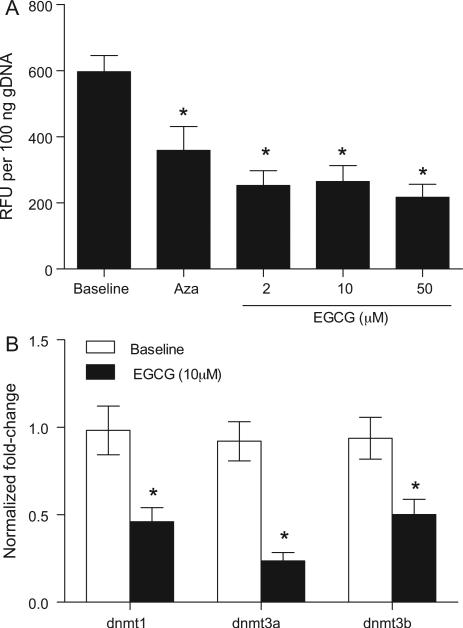
EGCG is a dietary DNMT inhibitor that can reactivate methylation-silenced genes by DNA demethylation [10,11]. We tested whether EGCG treatment would reduce DNA methylation and DNMT expression (DNMT1, DNMT3a and DNMT3b) in Jurkat T cells. Jurkat T cells treated with Aza and EGCG at all three EGCG doses tested had significantly reduced global DNA methylation compared to baseline (Fig. 4A). Administration of 10 μM (Fig. 4B) or 50 μM EGCG (data not shown) also significantly decreased the expression of all three DNMTs tested.
Fig. 4.
EGCG decreased global DNA methylation and DNMT expression in Jurkat T cells in vitro. (A) Jurkat T cells were left untreated (baseline), or treated with Aza at 5 μM or EGCG at 2, 10, or 50 μM for 72 h. At the end of incubation, genomic DNA was isolated from each group and analyzed for global DNA methylation. Data represents mean relative fluorescence units (RFU) ± SEM per 100 ng DNA. Results are representative of three independent experiments. (B) Jurkat T cells were left untreated (baseline), or treated with EGCG at 10 μM. Gene expression of DNMT1, DNMT3a, and DNMT3b were determined after 48 h by real time PCR. Gene expression was normalized to GAPDH housekeeping gene. Data represents mean normalized fold-change ± SEM. Results are representative of three independent experiments. *P < 0.05 versus baseline.
3.3. EGCG increased Treg frequencies and numbers in vivo
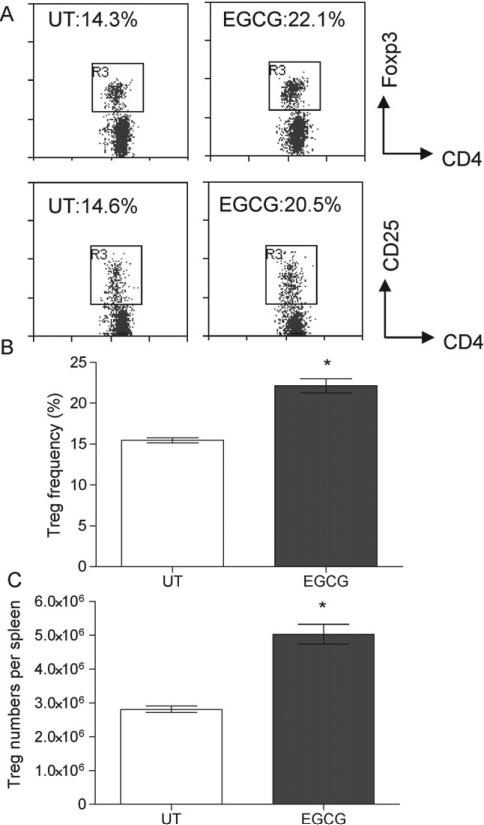
To determine the effects of EGCG on Treg numbers in vivo, Balb/c mice were injected i.p. with EGCG daily for 7 days (50 mg/kg). To assess systemic availability of EGCG using this treatment regimen, we measured plasma EGCG concentrations at various time points following i.p. EGCG administration. Plasma EGCG peaked between 5 and 30 min (7.0 ± 0.4 μM and 7.8 ± 0.8 μM, respectively), decreased to 2.0 ± 0.3 μM by 2 h post-injection, and returned to baseline levels below detection limit (<0.1 μM) by 24 h post-injection which was comparable to untreated controls. Plasma EGCG levels in mice that received seven daily EGCG injections had similar EGCG bioavail-ability compared to mice that received a single injection. Significant increases in both Treg frequencies and numbers were observed in the spleens, pancreatic lymph nodes, and mesenteric lymph nodes of mice treated with EGCG (Fig. 5 and Table 1). For example, in the spleens, there were an average of 1.4-fold increase in Treg frequency and 1.8-fold increase in Treg numbers in EGCG-treated mice compared to untreated control. The observed increase in Treg numbers in EGCG-treated mice reflected both an increase in Treg frequency (Table 1), as well as an overall increase in CD4+ T cells (Table 2). The relative ratio of CD4+ T cells, CD8+ T cells, and CD19+ B cells in the spleens of EGCG-treated mice were not significantly altered with EGCG treatments (Table 2).
Fig. 5.
EGCG increased Treg in mice in vivo. Balb/c mice (4 mice per group) were left untreated or injected i.p. with 50 mg/kg EGCG daily for 7 days. Treg frequencies in the spleens in individual mice were determined by flow cytometry 1 day post-last injection. (A) Representative flow cytometry plots of CD4+Foxp3+ Treg and CD4+CD25+ T cells in untreated and EGCG-treated mice. (B) Frequencies and (C) total numbers of Treg in untreated (open bar) and EGCG-treated (solid bar) mice. Data represents mean ± SEM. Results are representative of a minimum of 3 independent experiments. *P < 0.05 versus untreated control.
Table 1.
Treg frequencies and absolute numbers in various lymphoid organs in untreated and EGCG-treated mice.a
| Untreated CD4+ Treg (%) | EGCG-treated CD4+ Treg (%) | Untreated total Treg # | EGCG-treated total Treg # | |
|---|---|---|---|---|
| Spleen | 15.5 ± 0.6 | 22.1 ± 1.7* | 2.8 ± 0.2 × 10⁶ | 5.0 ± 0.6 × 10⁶* |
| PLNb | 12.0 ± 0.3 | 14.6 ± 0.5* | 1.3 ± 0.2 × 10⁵ | 4.7 ± 0.2 × 10⁵* |
| MLNb | 10.1 ± 0.6 | 12.4 ± 0.1* | 2.7 ± 0.5 × 10⁵ | 6.5 ± 1.2 × 10⁵* |
| ILNb | 12.3 ± 0.5 | 13.9 ± 0.6* | 2.6 ± 0.3 × 10⁵ | 2.8 ± 0.4 × 10⁵ |
CD4+Foxp3+ Treg were identified by flow cytometry (n = 4 per treatment group).
PLN = pancreatic lymph nodes, MLN = mesenteric lymph nodes, ILN = inguinol lymph nodes.
P≤ 0.05 compared to untreated control in respective lymphoid organs.
Table 2.
Frequencies and absolute numbers of T and B cells in the spleens of untreated and EGCG-treated mice.a
| Lymphocytes frequency (%) |
Absolute number (per spleen) |
|||||
|---|---|---|---|---|---|---|
| CD4+ | CD8+ | CD19+ | CD4+ | CD8+ | CD19+ | |
| Untreated | 30.9 ± 0.4 | 13.4 ± 0.4 | 55.8 ± 0.7 | 1.8 ± 0.1 × 10⁷ | 7.9 ± 0.3 × 10⁶ | 3.3 ± 0.1 × 10⁷ |
| EGCG | 29.6 ± 1.4 | 13.5 ± 0.2 | 56.9 ± 1.5 | 2.3 ± 0.2 × 10⁷* | 10.4 ± 0.6 × 10⁶* | 4.4 ± 0.2 × 10⁷* |
n = 4 mice per treatment group.
P≤ 0.05 compared to untreated control in respective cell types.
3.4. EGCG-treated mice had reduced T cell proliferation and cytokine production
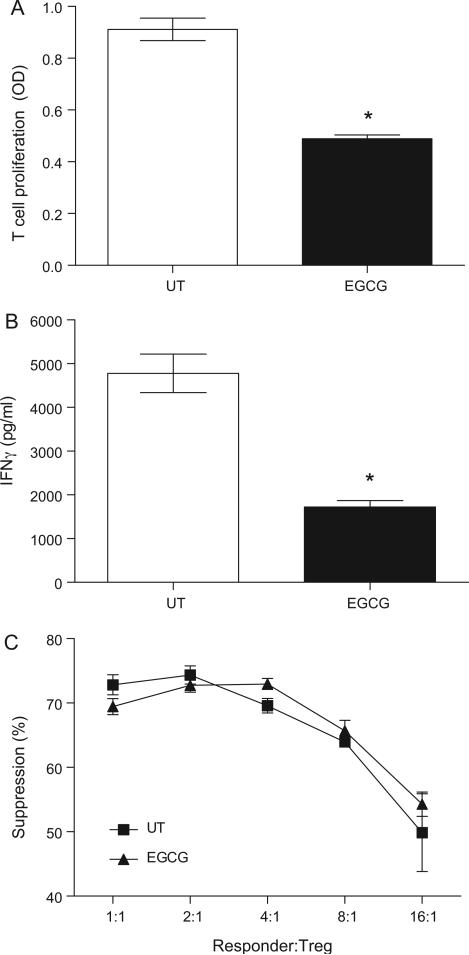
We next determined if EGCG suppressed T cell functions in mice. T cell activation and differentiation, as determined by T cell proliferative capacity and IFNγ production, respectively, were evaluated ex vivo after EGCG treatments. Mice treated with EGCG had significantly reduced T cell proliferative capacity when stimulated with anti-CD3 ex vivo (Fig. 6A). Reduced T cell proliferation correlated with a significant reduced production of IFNγ (Fig. 6B) and IL-2 (data not shown). The suppressive activities of Treg isolated from untreated and EGCG-treated mice were determined using an in vitro suppression assay (Fig. 6C). Treg isolated from untreated and EGCG-treated mice had similar suppressive effects.
Fig. 6.
EGCG reduced T cell proliferation and IFNγ production ex vivo. Balb/c mice (4 mice per group) were left untreated (open bar), or injected i.p. with 50 mg/kg EGCG daily for 7 days (solid bar). At the end of treatments, spleens from individual mice were harvested and splenocytes were stimulated ex vivo with 5 μg/mL plate-bound anti-CD3 for 48 h. T cell proliferation was determined by MTT assay (A), and IFNγ production in the culture supernatant was determined by IFNγ-specific ELISA (B). Splenocytes cultured in media only (unstimulated control) had minimal T cell proliferation and IFNγ production (data not shown). Data represent mean ± SEM. Results are representative of three independent experiments. *P < 0.05 versus untreated control. (C) Suppressive function of Treg isolated from untreated (■) or EGCG-treated (▲) mice were determined using standard Treg suppression assay. 1 × 10⁵ CD4+CD25− responder T cells were co-cultured with purified Treg isolated from individual untreated or EGCG-treated mice at various responder:Treg ratio in the presence of 1 μg/mL plate-bound anti-CD3 and 1 × 10⁵ mitomycin C-treated accessory cells. Suppression of cell proliferation was determined by MTT assay after 72 h incubation. Data represent mean ± SEM. Results are representative of two independent experiments.
4. Discussion
The transcription factor Foxp3 is epigenetically regulated and is critical for the development and function of Treg. Demethylation of the Foxp3 locus using potent DNMT inhibitors such as Aza results in a strong induction of Foxp3 in CD4+CD25− T cells with stable suppressive activities. In this study, we showed that EGCG, a diet-derived DNMT inhibitor, can similarly induce Foxp3 expression in Jurkat T cells at physiologically relevant concentrations in vitro. Foxp3 expression was associated with reduced DNMT expression and DNA demethylation in EGCG-treated cells. Furthermore, mice treated with EGCG in vivo had significantly increased Treg numbers in spleen and lymph nodes and inhibited T cell response. Our data suggested that EGCG may epigenetically modify Foxp3 methylation and promote Treg induction and expansion.
Treg plays a critical role in the maintenance of tolerance and the control of autoimmunity [1–3]. Stable expression of Foxp3 is crucial in maintaining Treg phenotype and suppressive function. Increasing evidence indicates that Foxp3 expression is controlled by epigenetic mechanisms [5,6]. In naive CD4+ T cells, methylation of CpG residues at the Foxp3 locus represses Foxp3 expression. In contrast, the Foxp3 locus in Treg is completely demethylated, allowing for Foxp3 expression. In addition to DNA methylation, histone acetylation/methylation, and Foxp3 acetylation status also contribute to the stability of Foxp3 expression [21,22]. In humans, Treg is a rare cell population and CD4+CD25+Foxp3+ Treg represents only 1–3% of total T cells. Strategies that can induce and/or expand Treg have potentially significant clinical applications for the treatment of autoimmune diseases and prolonging allograft survival. Naturally occurring Treg arise in the thymus, but Treg can also be induced by peripheral conversion of naive Foxp3−CD4+CD25− T cells into Foxp3+ Treg by tolerogenic antigen treatments in vivo, or in vitro exposure of naive CD4+CD25− T cells to TGFβ (adaptive/induced Treg) [6]. However, in vitro TGFβ-induced Treg have been shown to have unstable Foxp3 expression, attributed to incomplete demethylation at the Foxp3 locus. In contrast, treatment of CD4+CD25− T cells with DNMT inhibitors such as Aza results in complete demethylation of the Foxp3 locus and induces stable Foxp3 expression, and exerts immune suppressive function. The use of pharmacologic agents to alter epigenetically regulated genes for expansion of Treg has been of considerable clinical interest. However, while demethylating agents such as Aza induces stable Foxp3 expression, its use is associated with strong cellular toxicity. As an alternative, the use of natural products including dietary phytochemicals with known epigenetic modulatory activities can potentially be utilized for epigenetic therapy with relative ease of administration and lower toxicity.
Several dietary polyphenols have been reported to affect DNA methylation. For example, the consumption of genistein, an isoflavone from soybean altered the methylation patterns in mice [23,24], and tea polyphenols (catechin, epicatechin, and EGCG) and flavonoids (quercetin, fisetin, and myricetin) had DNMT inhibitory activities in vitro [10,13,25]. Among the various dietary constituents, EGCG, the major polyphenol in green tea, has demonstrated to be one of the more potent DNMT inhibitors, and this inhibitory activity has been associated with the reactivation of methylation-silenced genes in cancer cells. EGCG has been associated with a variety of health promoting activities, including anti-inflammatory and anti-carcinogenic effects [9]. Several studies demonstrated that EGCG and green tea polyphenols have immune suppressive effects on T cell in vitro, and limited in vivo studies showed EGCG had inhibitory effects on autoimmune disease progression [26–29]. However, to date the mechanisms by which EGCG suppresses immune (and autoimmune) responses is not well understood. We hypothesize that one of the mechanisms by which EGCG suppresses T cell function and inhibits autoimmune response is by specifically inducing and/or enhancing Treg numbers and function via epigenetic mechanisms. Supporting this hypothesis is a recent report that showed EGCG enhanced the functionality of human Treg in vitro [30]. Dietary polyphenols inhibit DNMT activities by various mechanisms, and EGCG has been shown to directly inhibit DNMT enzymatic activity [25]. In our in vitro culture system, we showed that EGCG also reduced the gene expression of all three DNMTs (DNMT 1, DNMT3a, and DNMT3b) tested, which correlated with reduced DNA methylation in EGCG-treated Jurkat T cells (Fig. 4). As expected of a dietary DNMT inhibitor, EGCG was not as potent as Aza in inducing Foxp3 expression. Nevertheless, Foxp3 expression was induced with EGCG at physiologically relevant concentrations (Figs. 2 and 3).
Our in vivo animal data suggested that EGCG could increase the frequency and number of Treg in various lymphoid organs (Fig. 5 and Table 1). In one human study, oral ingestion of green tea extract resulted in plasma EGCG concentration of ~4 μM at 90 min [19]. Our EGCG bioavailability data indicated that i.p. EGCG injections resulted in peak plasma EGCG concentration of 7–8 μM between 5 and 30 min post-injection, and reduced to 2~μM by 2 h post-injection. Thus the in vivo effects observed in the current study were achieved using EGCG concentrations that were within physiologically attainable doses of EGCG. While our data suggest that EGCG could increase Treg in vivo, additional tracking experiments will need to be performed to definitively conclude whether Treg is being induced from naive T cell populations, or whether increased Treg is due to expansion of existing Treg. Furthermore, in addition to DNMT inhibitory activities, EGCG is known to exert multiple effects on numerous additional targets, including the induction of cell cycle arrest and apoptosis, and the inhibition of MAP kinase and growth factor-related signaling [31]. We do not propose that Foxp3 is the only target of EGCG, nor do we suggest that the increase in Treg is solely due to epigenetic mechanisms, as EGCG likely act via a combination of mechanisms in modulating immune response. Nevertheless the DNMT inhibitory effect of EGCG on Foxp3 expression represents a novel and previously uncharacterized mechanism of action that can potentially contribute to the induction and/or enhancement of Treg frequency and function.
The use of dietary approaches to modulate immune function is a novel and potentially promising strategy that can affect immune regulation and disease outcomes with lower toxicity. In autoimmune diseases, environmental factors, including dietary factors, contribute significantly to diseases susceptibility and outcome [32–34]. Indeed, a recent study indicated that dietary intervention early in life was feasible in decreasing the risk of autoimmune type 1 diabetes [35]. In addition, epidemiological studies indicate that populations in countries which traditionally consume large quantities of green tea, such as China and Japan, have one of the lowest disease incidences of autoimmune type 1 diabetes [36]. The use of dietary strategies to epigenetically promote Treg differentiation and Foxp3 expression represents a novel mechanism that has the potential to modulate immune responses and autoimmunity. Although dietary agents may not be as potent as pharmacologic agents, their ability to target similar mechanisms offers opportunities for sustained and longer-term exposures without associated toxicity. Our work provides the foundation for future studies to further evaluate dietary strategies to modulate immune function.
Acknowledgments
This work was supported by grants from Oregon Agricultural Experiment Station (OR00735), Oregon State University Environmental Health Science Center (NIEHS P30 ES00210), and Linus Pauling Institute Pilot Grant Program.
Abbreviations
- Treg
regulatory T cells
- DNMT
DNA methyltransferase
- Aza
5-aza-2′-deoxycytidine
- EGCG
epigallocatechin-3-gallate
- RFU
relative fluorescence units
References
- 1.Feuerer M, Hill JA, Mathis D, Benoist C. Foxp3+ regulatory T cells: differentiation, specification, subphenotypes. Nat Immunol. 2009;10:689–95. doi: 10.1038/ni.1760. [DOI] [PubMed] [Google Scholar]
- 2.Vignali DA, Collison LW, Workman CJ. How regulatory T cells work. Nat Rev Immunol. 2008;8:523–32. doi: 10.1038/nri2343. [DOI] [PMC free article] [PubMed] [Google Scholar]
- 3.Campbell DJ, Ziegler SF. FOXP3 modifies the phenotypic and functional properties of regulatory T cells. Nat Rev Immunol. 2007;7:305–10. doi: 10.1038/nri2061. [DOI] [PubMed] [Google Scholar]
- 4.Lal G, Bromberg JS. Epigenetic mechanisms of regulation of Foxp3 expression. Blood. 2009;114:3727–35. doi: 10.1182/blood-2009-05-219584. [DOI] [PMC free article] [PubMed] [Google Scholar]
- 5.Floess S, Freyer J, Siewert C, Baron U, Olek S, Polansky J, et al. Epigenetic control of the foxp3 locus in regulatory T cells. PLoS Biol. 2007;5:e38. doi: 10.1371/journal.pbio.0050038. [DOI] [PMC free article] [PubMed] [Google Scholar]
- 6.Lal G, Zhang N, van der Touw W, Ding Y, Ju W, Bottinger EP, et al. Epigenetic regulation of Foxp3 expression in regulatory T cells by DNA methylation. J Immunol. 2009;182:259–73. doi: 10.4049/jimmunol.182.1.259. [DOI] [PMC free article] [PubMed] [Google Scholar]
- 7.Momparler RL, Bouffard DY, Momparler LF, Dionne J, Belanger K, Ayoub J. Pilot phase I–II study on 5-aza-2′-deoxycytidine (Decitabine) in patients with metastatic lung cancer. Anticancer Drugs. 1997;8:358–68. doi: 10.1097/00001813-199704000-00008. [DOI] [PubMed] [Google Scholar]
- 8.Juttermann R, Li E, Jaenisch R. Toxicity of 5-aza-2′-deoxycytidine to mammalian cells is mediated primarily by covalent trapping of DNA methyltransferase rather than DNA demethylation. Proc Natl Acad Sci USA. 1994;91:11797–801. doi: 10.1073/pnas.91.25.11797. [DOI] [PMC free article] [PubMed] [Google Scholar]
- 9.Crespy V, Williamson G. A review of the health effects of green tea catechins in in vivo animal models. J Nutr. 2004;134:3431S–40S. doi: 10.1093/jn/134.12.3431S. [DOI] [PubMed] [Google Scholar]
- 10.Fang MZ, Wang Y, Ai N, Hou Z, Sun Y, Lu H, et al. Tea polyphenol (−)-epigallocatechin-3-gallate inhibits DNA methyltransferase and reactivates methylation-silenced genes in cancer cell lines. Cancer Res. 2003;63:7563–70. [PubMed] [Google Scholar]
- 11.Berletch JB, Liu C, Love WK, Andrews LG, Katiyar SK, Tollefsbol TO. Epigenetic and genetic mechanisms contribute to telomerase inhibition by EGCG. J Cell Biochem. 2008;103:509–19. doi: 10.1002/jcb.21417. [DOI] [PMC free article] [PubMed] [Google Scholar]
- 12.Dashwood RH, Ho E. Dietary histone deacetylase inhibitors: from cells to mice to man. Semin Cancer Biol. 2007;17:363–9. doi: 10.1016/j.semcancer.2007.04.001. [DOI] [PMC free article] [PubMed] [Google Scholar]
- 13.Fang M, Chen D, Yang CS. Dietary polyphenols may affect DNA methylation. J Nutr. 2007;137:223S–8S. doi: 10.1093/jn/137.1.223S. [DOI] [PubMed] [Google Scholar]
- 14.Santana-Rios G, Orner GA, Xu M, Izquierdo-Pulido M, Dashwood RH. Inhibition by white tea of 2-amino-1-methyl-6-phenylimidazo[4,5-b]pyridine-induced colonic aberrant crypts in the F344 rat. Nutr Cancer. 2001;41:98–103. doi: 10.1080/01635581.2001.9680618. [DOI] [PMC free article] [PubMed] [Google Scholar]
- 15.Neilson AP, Green RJ, Wood KV, Ferruzzi MG. High-throughput analysis of cate-chins and the aflavins by high performance liquid chromatography with diode array detection. J Chromatogr A. 2006;1132:132–40. doi: 10.1016/j.chroma.2006.07.059. [DOI] [PubMed] [Google Scholar]
- 16.Mosmann T. Rapid colorimetric assay for cellular growth and survival: application to proliferation and cytotoxicity assays. J Immunol Methods. 1983;65:55–63. doi: 10.1016/0022-1759(83)90303-4. [DOI] [PubMed] [Google Scholar]
- 17.Pop SM, Wong CP, Culton DA, Clarke SH, Tisch R. Single cell analysis shows decreasing FoxP3 and TGFbeta1 coexpressing CD4+CD25+ regulatory T cells during autoimmune diabetes. J Exp Med. 2005;201:1333–46. doi: 10.1084/jem.20042398. [DOI] [PMC free article] [PubMed] [Google Scholar]
- 18.Kim S, Lee MJ, Hong J, Li C, Smith TJ, Yang GY, et al. Plasma and tissue levels of tea catechins in rats and mice during chronic consumption of green tea polyphenols. Nutr Cancer. 2000;37:41–8. doi: 10.1207/S15327914NC3701_5. [DOI] [PubMed] [Google Scholar]
- 19.Nakagawa K, Okuda S, Miyazawa T. Dose-dependent incorporation of tea catechins, (−)-epigallocatechin-3-gallate and (−)-epigallocatechin, into human plasma. Biosci Biotechnol Biochem. 1997;61:1981–5. doi: 10.1271/bbb.61.1981. [DOI] [PubMed] [Google Scholar]
- 20.Lambert JD, Lee MJ, Diamond L, Ju J, Hong J, Bose M, et al. Dose-dependent levels of epigallocatechin-3-gallate in human colon cancer cells and mouse plasma and tissues. Drug Metab Dispos. 2006;34:8–11. doi: 10.1124/dmd.104.003434. [DOI] [PubMed] [Google Scholar]
- 21.Tao R, de Zoeten EF, Ozkaynak E, Chen C, Wang L, Porrett PM, et al. Deacetylase inhibition promotes the generation and function of regulatory T cells. Nat Med. 2007;13:1299–307. doi: 10.1038/nm1652. [DOI] [PubMed] [Google Scholar]
- 22.van Loosdregt J, Vercoulen Y, Guichelaar T, Gent YY, Beekman JM, van Beekum O, et al. Regulation of Treg functionality by acetylation-mediated Foxp3 protein stabilization. Blood. 2009;115:965–74. doi: 10.1182/blood-2009-02-207118. [DOI] [PubMed] [Google Scholar]
- 23.Day JK, Bauer AM, DesBordes C, Zhuang Y, Kim BE, Newton LG, et al. Genistein alters methylation patterns in mice. J Nutr. 2002;132:2419S–23S. doi: 10.1093/jn/132.8.2419S. [DOI] [PubMed] [Google Scholar]
- 24.Dolinoy DC, Weidman JR, Waterland RA, Jirtle RL. Maternal genistein alters coat color and protects Avy mouse offspring from obesity by modifying the fetal epigenome. Environ Health Perspect. 2006;114:567–72. doi: 10.1289/ehp.8700. [DOI] [PMC free article] [PubMed] [Google Scholar]
- 25.Lee WJ, Shim JY, Zhu BT. Mechanisms for the inhibition of DNA methyltransferases by tea catechins and bioflavonoids. Mol Pharmacol. 2005;68:1018–30. doi: 10.1124/mol.104.008367. [DOI] [PubMed] [Google Scholar]
- 26.Pae M, Ren Z, Meydani M, Shang F, Meydani SN, Wu D. Epigallocatechin-3-gallate directly suppresses T cell proliferation through impaired IL-2 utilization and cell cycle progression. J Nutr. 2010;140:1509–15. doi: 10.3945/jn.110.124743. [DOI] [PubMed] [Google Scholar]
- 27.Bayer J, Gomer A, Demir Y, Amano H, Kish DD, Fairchild R, et al. Effects of green tea polyphenols on murine transplant-reactive T cell immunity. Clin Immunol. 2004;110:100–8. doi: 10.1016/j.clim.2003.10.006. [DOI] [PubMed] [Google Scholar]
- 28.Haqqi TM, Anthony DD, Gupta S, Ahmad N, Lee MS, Kumar GK, et al. Prevention of collagen-induced arthritis in mice by a polyphenolic fraction from green tea. Proc Natl Acad Sci USA. 1999;96:4524–9. doi: 10.1073/pnas.96.8.4524. [DOI] [PMC free article] [PubMed] [Google Scholar]
- 29.Fu Z, Zhen W, Yuskavage J, Liu D. Epigallocatechin gallate delays the onset of type 1 diabetes in spontaneous non-obese diabetic mice. Br J Nutr. 2010;105:1218–25. doi: 10.1017/S0007114510004824. [DOI] [PMC free article] [PubMed] [Google Scholar]
- 30.Yun JM, Jialal I, Devaraj S. Effects of epigallocatechin gallate on regulatory T cell number and function in obese v. lean volunteers. Br J Nutr. 2010;103:1771–7. doi: 10.1017/S000711451000005X. [DOI] [PubMed] [Google Scholar]
- 31.Lambert JD, Yang CS. Mechanisms of cancer prevention by tea constituents. J Nutr. 2003;133:3262S–7S. doi: 10.1093/jn/133.10.3262S. [DOI] [PubMed] [Google Scholar]
- 32.Lefebvre DE, Powell KL, Strom A, Scott FW. Dietary proteins as environmental modifiers of type 1 diabetes mellitus. Annu Rev Nutr. 2006;26:175–202. doi: 10.1146/annurev.nutr.26.061505.111206. [DOI] [PubMed] [Google Scholar]
- 33.Akerblom HK, Vaarala O, Hyoty H, Ilonen J, Knip M. Environmental factors in the etiology of type 1 diabetes. Am J Med Genet. 2002;115:18–29. doi: 10.1002/ajmg.10340. [DOI] [PubMed] [Google Scholar]
- 34.Knip M, Veijola R, Virtanen SM, Hyoty H, Vaarala O, Akerblom HK. Environmental triggers and determinants of type 1 diabetes. Diabetes. 2005;54(Suppl. 2):S125–36. doi: 10.2337/diabetes.54.suppl_2.s125. [DOI] [PubMed] [Google Scholar]
- 35.Knip M, Virtanen SM, Seppa K, Ilonen J, Savilahti E, Vaarala O, et al. Dietary intervention in infancy and later signs of beta-cell autoimmunity. N Engl J Med. 2010;363:1900–8. doi: 10.1056/NEJMoa1004809. [DOI] [PMC free article] [PubMed] [Google Scholar]
- 36.Karvonen M, Viik-Kajander M, Moltchanova E, Libman I, LaPorte R, Tuomilehto J. Incidence of childhood type 1 diabetes worldwide. Diabetes Mondiale (DiaMond) Project Group. Diabetes Care. 2000;23:1516–26. doi: 10.2337/diacare.23.10.1516. [DOI] [PubMed] [Google Scholar]


