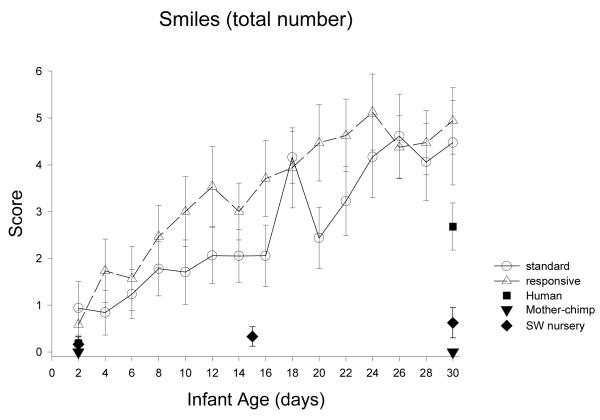
Abstract
The aims of this article are to describe the neurobehavioral integrity of chimpanzee newborns, to investigate how early experiences affect the neurobehavioral organization of chimpanzees, and to explore species differences by comparing chimpanzee newborns to a group of typically developing human newborns. Neurobehavioral integrity related to orientation, motor performance, arousal, and state regulation of 55 chimpanzee (raised in four different settings) and 42 human newborns was measured with the Neonatal Behavioral Assessment Scale (NBAS) a semi-structured 25-minute interactive assessment. Thirty-eight chimpanzees were tested every other day from birth, and analyses revealed significant developmental changes in 19 of 27 NBAS scores. The cross-group and cross-species comparisons were conducted at 2 and 30 days of age. Among the 4 chimpanzee groups, significant differences were found in 23 of 24 NBAS scores. Surprisingly, the cross-species comparisons revealed that the human group was distinct in only 1 of 25 NBAS scores (the human group had significantly less muscle tone than all the chimpanzee groups). The human group was indistinguishable from at least one of the chimpanzee groups in the remaining 24 of 25 NBAS scores. The results of this study support the conclusion that the interplay between genes and environment, rather than genes alone or environment alone, accounts for phenotypic expressions of newborn neurobehavioral integrity in hominids.
Keywords: ape, infant, epigenesis, social cognition, early development, NBAS, Brazelton test, emotion
What are the inborn capacities of chimpanzees? How do chimpanzees compare to humans? These questions typify the long-standing scientific interest in ‘what makes us human’ (e.g., Burghardt, 2009; de Waal, 1982; Fouts & Mills, 1997; Goodall, 1986; Hayes, 1951; Kellogg & Kellogg, 1933; Wrangham, 2009; Wrangham, McGrew, de Waal, & Heltne, 1994; Zlatev, Racine, Sinha, & Itkonen, 2008). The current article presents a detailed study of the neurobehavioural integrity of newborn chimpanzees, which was part of a larger project that documented imitative (e.g., Bard, 2007; Custance, Whiten, & Bard, 1995), cognitive (e.g., Bard & Gardner, 1996; Bard, Fragazsy, & Visalberghi, 1995; Bard, Todd, Bernier, Love & Leavens, 2006), and socio-emotional development (e.g., Bard, 2009, 2005, 2003, 1998a,b; Russell, Bard, & Adamson, 1996; van IJzendoorn, Bard, Bakermans-Kranenberg, & Ivan, 2009) in a comparative perspective. Comparative developmental studies are valuable for understanding hominid evolution (e.g., Boesch, 2007; Johnson-Pynn, Fragaszy, & Cummins-Sebree, 2003), and essential for delineating those characteristics that are uniquely human (e.g., Bjorklund, 2006; Leavens, Bard, & Hopkins, in press).
The currently most popular theory in comparative psychology suggests that humans have unique motivations for cooperation, which is the foundation for complex species-unique cultural learning (e.g., the cultural intelligence hypothesis: Herrmann, Hernandez-Lloreda, Call, Hare, & Tomasello, 2009). These motivations to share emotions and social experiences, it is argued, begin with the joint attentional skills of 9-12 month-old human infants. Unfortunately, most of the studies of comparative social cognition disregard the effects of both development and early experiences in apes while demonstrating that human joint attentional skills depend on early developmental experiences of emotional engagements with caregivers and objects, as well as cognitively-based triadic coordination (Bard & Leavens, 2009; Leavens, Hopkins & Bard, 2005; Tomasello & Carpenter, 2005). A Behavioral Intervention project, conducted from 1987-1995 at the Yerkes Research Center (Bard, 1996: Bard & Gardner, 1996), studied chimpanzees from birth through the first year of life to document how differential experiences impacted social, emotional, and cognitive outcomes. It is evident that chimpanzee groups differ in mutual gaze – an index of engagement with caregivers (Bard et al., 2005), differ in object manipulation – an index of engagement with objects (Bard & Gardner, 1996; Menzel, 1964a,b), and differ in the quality of attachment bonds (van IZjendoorn et al., 2009), the building blocks of complex social cognition. The cross-species and cross group comparisons of newborns (and the effect of 30 days of postnatal development) are described here to specify how early rearing environments impact the developing organizational systems of orientation, motor performance, and behavioural state.
We now know quite a lot about the abilities of human newborns (Kugiumutzakis, 1999; Meltzoff & Moore, 1989; Trevarthen & Aitken, 2001), and our knowledge of chimpanzees is steadily growing. The current detailed study of chimpanzee newborns from multiple settings, with multiple outcomes, in comparison with humans of the same age, is exceedingly rare. It is well known that genetics and environment interact in complex ways to influence human behavior and development (see especially Garcia Coll, Bearer, & Lerner, 2004), but comparative psychologists have generally underemphasized the role of gene-environment interactions in the comparative behavioural outcomes of nonhuman primates. Exceptionally, compelling evidence of the effects of environmental variables on gene expression is well documented in rhesus monkey development (e.g., Suomi, 2006).
Comparative rates of development vary across biobehavioural systems. Chimpanzees exhibit independent locomotion earlier than humans. Human infants crawl around 9 months, and chimpanzee infants walk quadrupedally around 5 months (Riesen & Kinder, 1952). In terms of early cognitive development, chimpanzees reach the Stage 4 of Piagetian sensorimotor intelligence before a year of age, but with less complexity in their object-object manipulations than human infants (Hallock & Worobey, 1984; Mathieu & Bergeron, 1981; Poti & Spinozzi, 1994; Vauclair & Bard, 1983 - note that these studies were conducted with chimpanzees raised in the impoverished nurseries of biomedical research centres and compared to humans raised in artifact-rich western industrialized settings). Leavens et al (2005) suggest that human infants develop pointing at 9-12 months when they encounter the Referential Problem Space (based on locomotor inability to obtain desired out-of-reach objects). They argue that the more advanced locomotor ability of chimpanzees is responsible for their bypassing this problem space in infancy and explains why chimpanzees do not developing pointing at 9-12 months in the wild (but note that caged environments impose an equivalent inability to obtain desired objects outside the cage, and captive chimpanzees enter the Referential Problem Space and readily point: Leavens, Hopkins, & Bard, 2008). However, wariness of strangers develops in humans around 5 to 7 months and averaged 6 months in chimpanzees (Bard & Macdonald, unpublished data, and see Bard, 2009, and Bard, in press for review of evolution of social cognition). Chimpanzee infants are faster (e.g., motor development), slower (e.g., cognitive development), or the same (e.g., emotional development) in reaching human developmental milestones, depending on the system assessed. Therefore, in this study, we decided to compare chimpanzees and humans at the same chronological age. Moreover, we considered the neonatal period to be 30 days for both species.
The aims of this article are to describe the neurobehavioral integrity of chimpanzee newborns, to investigate how early experiences might affect the neurobehavioral organization of chimpanzees, and to explore species differences by comparing chimpanzee newborns to a group of typically developing human newborns. The focus is on phenotypic expressions in newborns, highlighting the effects of relatively limited post-natal experiences. Evidence of change across the first 30 days of life, and differences among chimpanzee groups will demonstrate the effects of maturation and experience, reflecting inherent flexibility in the species. Comparing the postnatal neurobehavioral integrity of chimpanzees to that of humans will illuminate species differences. By considering multiple chimpanzee groups, with differing early experiences, in comparison with a human group, those differences attributable to species (i.e., genetic differences) will be delineated from those attributable to rearing experiences. Moreover, the interaction of genes (at the high level of species) and environment will be manifest if the range of differential chimpanzee outcomes includes those phenotypic outcomes found in the human group. The variety of assessed neurobehavioral systems (e.g., state regulation, arousal, motor, and orientation) will illuminate differential comparability between species, and fully describe neurobehavioural organization of chimpanzee newborns.
Neonatal Behavioral Assessment Scale (NBAS: Brazelton, 1984; Brazelton & Nugent, 1995)
The neurobehavioral systems of newborns are well described and measured with Brazelton’s Neonatal Behavioral Assessment Scale (NBAS: 1984), and with repeated testing can account for the effects of maturation and postnatal experience. The NBAS has been successfully used with newborn chimpanzees (e.g., Bard, 1994c; Bard, Platzman, Lester, & Suomi, 1992, 2001; Bard, Hopkins, & Fort, 1990; Hallock, Worobey, & Self, 1989) and so the NBAS will be a good platform for making cross-species comparisons and documenting the effects of genes, postnatal experience, and gene-rearing interactions on behavioural outcomes (i.e., phenotypic expression).
The neurobehavioral integrity of chimpanzee and human newborns was measured with the Neonatal Behavioral Assessment Scale (NBAS: Brazelton, 1984; Brazelton & Nugent, 1995), a semi-structured 25-minute interactive assessment conducted by examiners trained to the same standard (i.e., Brazelton certified). The NBAS, a rich multi-faceted test, was developed as an assessment of individual differences in how well a baby was adapting to life outside the womb (Brazelton, 1984). In addition to the assessment of reflexes and physiological status (i.e., skin color, startles, tremors) as is found in other newborn assessments (e.g., Apgar scores), the NBAS focuses on how well the infant manages behavioural state changes (STATE REGULATION) in response to demands, e.g., attending to the environment and responding to social partners (ORIENTATION). Individual infants differ in their sensitivity to endogenous and exogenous stimuli (RANGE OF STATE), and in the maturity of their motoric system (MOTOR) (Lester, 1984). How the newborn develops from 2 to 30 days, becoming more organized, reflects the complex interaction of genetic and environmental variables in ‘adaptations to extra-uterine life’ (Brazelton, 1984; Brazelton & Nugent, 1995; Nugent, Lester, & Brazelton, 1989).
The day-to-day comparisons of ST and RC chimpanzees, and the multi-group comparisons for all NBAS items, as well as the cluster scores, are reported here. Previous reports have presented analysis of cluster scores (Bard, 2005; in French, Bard, Platzman, Lester, & Suomi, 2001), or preliminary samples (Bard, et al., 1992) or addressed questions of laterality, especially of reflexes (Fagot & Bard, 1995; Bard, et al., 1990; Hopkins & Bard, 1993, 1996: Redshaw, 1989). Data from 42 human and 55 chimpanzee newborns are analyzed here for the multi-group analyses of 21 items and 4 clusters of the NBAS. These four clusters represent 4 different behavioral domains, attention, motor ability, arousal, and coping, that are of increasing importance in development, especially of social cognition. Multi-group comparisons will illuminate the extent of flexibility in chimpanzee developments across these different domains. Therefore, how chimpanzee development compares with human development will illuminate how neonatal behavior is organized in hominids across these important domains.
ORIENTATION concerns the infants’ ability to attend to auditory and visual stimuli, and assesses responses to both animate and inanimate stimuli. When NBAS testing began, the functioning of the newborn chimpanzee visual system was not known, although infant chimpanzees’ perception of faces and other stimuli appeared comparable to that of human infants Bard et al (1992) compared that 13 Yerkes nursery chimpanzee and 42 human newborns and found that they oriented equally well to sights and sounds, oriented better to social stimuli than inanimate stimuli, and improved developmentally. There was one item which was stated to be a ‘species’ difference: newborn chimpanzees were significantly more alert than newborn humans. With a larger sample of nursery infants, Bard (2005) found chimpanzees had better orientation than the human infants at 2 days, but were not different at 30 days. Interestingly, Hallock et al., (1989) found that the orientation abilities of 7 mother-raised chimpanzees was nearly identical to humans at 2 days, but was significantly poorer than humans at 30 days. In the current paper, we report comparative performance on each of the orientation items for multiple chimpanzee groups in comparison to a human group.
MOTOR concerns the muscular tone and amount of active movement of the infant. This was the focus of many of the early comparative studies (e.g., Riesen & Kinder, 1952), and the general consensus was that chimpanzees have advanced motoric development compared to humans, with clearly much more motoric strength as adults. Bard et al. (1990) found that many reflexes of the neonatal human were also found in the chimpanzee neonate, and some were similarly lateralized (i.e., hand-to-mouth: Hopkins & Bard, 1996) and some were not (i.e., stepping). By 3-5 months of age chimpanzee infants are fully supporting their own weight by clinging to their mothers hair (at 3 months) and moving around quadrapedally (by 5 months) (in the wild: Goodall, 1986; Plooij, 1984; in the laboratory: Jacobsen, Jacobsen, & Yoshioka, 1931; Riesen & Kinder, 1952; in home-rearing, it is somewhat earlier, Gardner & Gardner, 1989). Hallock et al. (1989) found that newborn chimpanzees had better head control than humans, Riesen & Kinder confirm that all head control items of the Gesell tests are achieved much earlier by chimpanzee than humans, but attributes this most to the relatively smaller head of the chimpanzee (p. 59). Here we consider each of the 5 items of the motor scale of the NBAS for multiple groups of chimpanzees.
RANGE concerns the emotional arousal and arousability of infants. Newborn infants have a range of behavioral states and manage their state organization, e.g., becoming alert in response to stimulation, or becoming unavailable in response to overstimulation (Brazelton, 1979, 1984). Typically, behavioural states are classified with Prechtl’s six state system: States 1 and 2 are deep and REM sleep, State 3 is drowsy, State 4 is quiet and alert, State 5 is fussy, and State 6 is crying (Prechtl & O’Brien, 1982). When NBAS testing began, it was not known for sure whether chimpanzees cry or fuss in the same manner as do human newborns, although it was know that chimpanzee toddlers had ‘temper tantrums’ , and when older such tempter tantrums included high intensity screaming (Goodall, 1986; van Lawick-Goodall, 1968). In early testing, State 5 fussiness was identified with ‘hoo’ and ‘whimper’ facial and vocal expressions, and State 6 crying was identified with scream vocalizations and a ‘cry’ face (see Bard, 1998a, 2000, 2003 for more details of crying and emotional expressions in infant chimpanzees). Descriptions of chimpanzees’ peak of arousal, number of behavioral state changes, and the timing of crying are important to document as little is known about the influence of early experiences in this neurobehavioural system (Hallock et al., 1989; Plooij, 1984; Yerkes & Tomilin, 1935; Zeskind & Marshall, 1991).
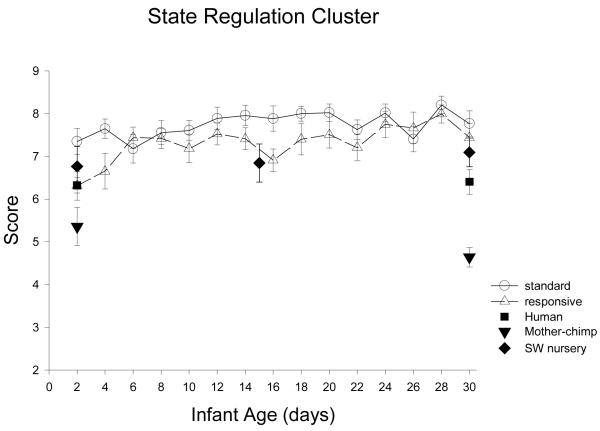
REGULATION concerns the coping of infants, measuring how well they use their own resources (hand-to-mouth, self-quieting), or resources provided by the examiner (cuddliness, consolability) to maintain a quiet behavioral state. Hallock et al (1989) did not find any differences between mother-reared chimpanzee and human newborns in the regulation cluster, but Bard et al. (2001) found better regulatory abilities in nursery chimpanzees compared to humans, especially at 30 days of age. Exploration of the item by item coping abilities in chimpanzee infants will help to specify those particular environmental conditions that might foster the ability to use relatively more endogenous (self-directed behaviors) or relatively more exogenous (social partner) stimuli to regulate arousal.
Study Aims
The first ‘study’ concerned day-to-day changes in NBAS when chimpanzees were tested every other day from birth through 30 days, comparing two groups of nursery chimpanzees from the Yerkes Center. The chimpanzees in the two groups did not differ genetically, all were born to chimpanzees residing at the Yerkes Center, and, in fact, some shared mothers and/or fathers. But the groups differed in early experiences (see methods for more details). One group was raised in a Responsive Care (RC) nursery. For 4 hours per day 5 days a week, the RC group interacted with trained human researchers in a manner that was designed to increase their species-typical development (see Bard, 1996 and below for details). During the remaining 20 hours per day during the week, and for 48 hours during the weekend, the experiences of the RC group were equivalent to those of the second group, Standard Care (ST). In the ST nursery, newborns were placed in an incubator for temperature regulation, given a bottle, a diaper change, and a health check initially every 2 hours, changing to every 4 hours by the end of the neonatal period. In the ST nursery, caregivers interacted briefly with the newborns holding them in their arms for feedings, and sometimes rocking them to sleep.
For these two Yerkes Nursery groups of chimpanzees, the NBAS was administered every other day, from 2 or 3 days after birth to 30 days of age, to assess developmental change. The developmental information was important, if there were group differences, to ascertain when during development, the effects became evident. With the large number of chimpanzees in each group it was also possible to look for genetic differences between males and females. The main aims of this study was to describe group differences, sex differences, and age differences on the items and clusters of the NBAS for chimpanzees raised at the Yerkes Nursery to determine the impact of the RC intervention (n=17) compared to ST care (n=21) on the development of neurobehavioral integrity in chimpanzees.
The second ‘study’ compared the neurobehavioural integrity of chimpanzee newborns from these two Yerkes nurseries to two additional groups of chimpanzee newborns: chimpanzees raised at the Southwest Foundation for Biomedical Research (SW) nursery, and chimpanzees raised with their biological mothers at the Institute for Primate Studies (Mother). In the SW nursery, caregivers interacted with chimpanzee newborns on a schedule with feedings at 2-4 hour intervals, and otherwise the infants remained in an incubator (at night) or in a baby rocker (during the day). In the SW nursery, the caregiver interacted with the newborns very briefly while wearing a protective mask covering the face.
In the second study, the aim was to document differences among chimpanzee groups. Differences among the nursery-reared groups would reveal the effects of relatively more (RC) and relatively less (SW) contact with human caregivers. The RC intervention involved an additional 4 hours of more ‘species-typical’ interactions (e,g., constant physical contact & feeding on demand), and if these experiences were important, this group was expected to have outcomes more similar to the Mother group than the other chimpanzee groups. If the mother reared group was distinct among the chimpanzee groups, however, then we would conclude that neonatal behavior of chimpanzees is affected by the change from the biologically relevant caregiving (24 hours of constant physical contact with feeding on demand) to the artificial caregiving of a nursery (placement in incubator or crib with a scheduled routine for feeding and caregiver contact).
The expanded number of chimpanzee groups is useful to illustrate diversity or universal characteristics, allowing greater certainty in comparative conclusions. The added dimension of comparing multiple groups across the neonatal period is important, as newborns become adapted to their extra-uterine environment (Brazelton, 1984). Greater differences among the chimpanzee groups at 30 days of age, than at 2 days of age, would indicate the influence of post-natal rearing environments on performance in NBAS items (e.g., Bard, 2005).
The third study question relates to how these four groups of chimpanzees compare to a group of typically developing humans (infants born in middle to upper-middle class, two-parent families in Eastern US). If species effects are dominant, we would expect to find that the human group is distinct from all the chimpanzees at birth and at 30 days of postnatal life. Strong evidence for the importance of genetic factors in the behavior and organization of the newborn would be provided by this finding. If the human group is not distinct, then there may be evidence that particular environmental variables can be linked with neurobehavioural outcomes, with similar effects in the phenotypic expressions of both chimpanzee and human newborns. This would be support for epigenetic effects, in the sense that the phenotypic expressions of the ‘chimpanzee’ genome would differ as a result of interaction with environment so as to not be distinct from the phenotypic expression of the ‘human’ genome. It is acknowledged that statements about what is prototypic neurobehavioural organization for humans are limited by the use of only a single group in the current study.
Thus, three patterns of outcomes could be identified with the cross-species and cross-group comparisons: ‘Genetic’ differences, by which we mean species differences, in which the human group is distinctly different from all groups of chimpanzees; ‘Environmental’ differences, by which we mean rearing differences, in which there are significant differences among the chimpanzee groups; and ‘Gene-environment interactions’ or epigenesis (Gottlieb, 2007; Jablonka & Lamb, 2007), by which we mean that there is evidence for species by rearing interactions in which the range of chimpanzee outcomes includes the human outcomes (i.e., where the human group is similar to one or more of the chimpanzee groups, or intermediate among the chimpanzee groups).
Methods
SUBJECTS, SETTINGS, and MATERIALS
Test dates for all chimpanzees and humans were determined by chronological age after a full-term birth. Note that full-term gestation for humans is approximately 266 days, or 38 weeks, from conception to birth, and average full-term gestation for chimpanzees is approximately 240 days, or 34 weeks from the day of ovulation to birth.
Test items, test administration, and scoring were in accord with instructions given in the manual by Brazelton (1984). Any modifications, exceptions, or additions are specifically noted in the text.
Yerkes Regional Primate Research Center Nursery chimpanzees
Standard Care (ST) nursery
Twenty one chimpanzees (11 females) were placed in the Standard Care (ST) nursery of the Yerkes Regional Primate Research Center of Emory University, Atlanta, GA, from as soon as it was apparent that their biological mothers did not exhibit sufficient maternal behaviors to care for them (i.e., within 24 hours of birth: see Bard, 1994a, 2003 for further information on adequate and inadequate maternal care at Yerkes). From 1987 – 1995, the standard care (ST) nursery practices at Yerkes consisted of placement in incubators for most of the first 30 days of life for temperature regulation (until reaching 2000 grams in weight). Care staff wore white lab coats, over white uniforms, and washed with soap before contacting the babies. Human care staff provided milk in bottles, initially on a 2-hour schedule and then on a 4-hour schedule. Typically the care staff held the newborns in their lap when giving bottles, and some sat on rocking chairs. Typically the care staff would change diapers and conduct health checks surrounding these scheduled contacts.
Responsive Care nursery (RC)
Seventeen chimpanzees (9 females) were placed in Responsive Care (RC) nursery of the Yerkes Regional Primate Research Center of Emory University, Atlanta, GA from soon after birth, when it was apparent that their biological mothers were not providing adequate care (i.e., from minutes to a few hours after birth). From 1991-1995, the Responsive Care programme was conducted by researchers in the Great Ape Nursery 4 hours daily, in the afternoons, Monday through Friday. During the rest of the time, these infants experienced ST interactions with primate care staff. For the 4 hours daily of RC, however, these infants were with a human research assistant, who had been specially trained to provide support, feeding, grooming, and parenting as much like a chimpanzee mother from the wild as was possible (see Bard, 1996 for more details).
The general differences between ST and RC nursery experiences in the first 30 days were that RC caregivers remained in 100% cradling contact with the infant, and that feeding, cleaning, and playing were ‘on-demand’ rather than by schedule. Moreover, RC caregivers were physically active by walking while the infants were in cradling contact, providing kinaesthetic, visual, and auditory stimulation, exposing the infants to the sights and sounds of numerous people and chimpanzees throughout the Yerkes Centre. RC infants were encouraged to develop motoric competence by partially supporting their own weight. RC infants were encouraged to be socially active with older chimpanzees in the nursery, by viewing (but not interacting with) adult chimpanzees on the GAW, and by interacting with humans researchers and staff. RC caregivers encouraged the development of appropriate chimpanzee species-typical social vocalizations, gestures, and emotional expressions (more so as the infants developed past the neonatal period: Bard et al., under revision).
Southwest Foundation for Biomedical Research (SW) Nursery chimpanzees
Ten chimpanzees (2 females) born at the Southwest Foundation for Biomedical Research (SW) and raised in the nursery, were given NBAS testing at 2, 15, and 30 days. These infants were also in incubators for some days when placed in the nursery shortly after birth. Their contact with human care staff was on a schedule, initially every 2 hours, and then every 4 hours. However, contact was limited in at least 2 ways. Caregivers always wore gloves covering their hands, biosafety hair nets covering their hair, and biosafety face masks covering their nose and mouth to prevent the spread of infectious diseases. Secondly, the time spent at each visit was short at SW as often infants were returned to the incubator immediately after feeding, or given a bottle propped rather than being held. Infants were often placed in a mechanical rocker for most of the day to give them vestibular stimulation. Contact with people was minimized in the SW nursery.
Mother-raised chimpanzees (Mother)
Seven mother-raised chimpanzees (2 females) from the Institute for Primate Studies, Norman Oklahoma (Hallock et al., 1989) were included as subjects. The data reported here included only the seven infants that were consistently raised by their chimpanzee mothers (at least throughout the neonatal period). These infants were removed temporarily from maternal care only for the purposes of running the NBAS tests (details reported in Hallock et al., 1989). So, except for the 20-30 minutes on day 2 and on day 30 that the infant was being tested by the NBAS examiner, these chimpanzee infants experienced 100% cradling contact with their biological chimpanzee mothers, for 24 hours a day, for each of their first 30 days of life. Chimpanzee mothers engage in playful interactions, grooming, and motoric stimulation, even with their newborn babies (see Bard, 1994a, 2002, and Bard et al., 2005 for details of chimpanzee parenting in captive settings).
A Human group (Providence, RI USA)
The human group consisted of 42 healthy fullterm newborns (38-42 weeks gestational age, 2800 – 4200 grams at birth, with Apgar scores of 8-10 at 1 and 5 minutes) from Providence RI, US born primarily to Caucasian, middle- to upper-class socioeconomic status two-parent families (see Lester et al., 1989 for further details).
PROCEDURE
All infants were all assessed with the Brazelton Neonatal Behavioral Assessment Scale (NBAS: Brazelton, 1979, 1984; Brazelton & Nugent, 1995). The exam is semi-structured with procedures designed from least to most intrusive, and the infant is presumed to move from a sleeping state (Prechtl’s states 1 & 2) at the start of the exam to a crying one at the end (Prechtl’s states 6). The procedures are organized in terms of administration. Low tactile handling and assessments of reflexes are early in the exam. The moderately stimulating assessments are in the middle of the exam (including most of the motor items). The most intrusive items (defensive, TNR reflex and Moro) are usually reserved for administration at the end of the exam. Orientation items are assessed when the infants are in a maximally available state, which is typically around the middle of the exam. NBAS examiners are trained to use a variety of different techniques in order to always assess the best performance of each infant (Brazelton & Nugent, 1985).
The Brazelton test has been widely used with human infants in Western and other cultures (e.g., Nugent, et al., 1989). Brazelton examiners are trained to a single high standard, 90% or better agreement with a certified NBAS trainer, in order to become certified. ST, RC, and SW chimpanzees were tested by examiners trained by Platzman (Bard et al., 1992) or KAB (both certified examiners), mother chimpanzees were tested by Hallock trained by JW (certified examiner), and the human group were tested by examiners trained by BL (certified examiner).
The first NBAS test was conducted on the 2nd or 3rd day of (as recommended by Brazelton, 1979), and the last test was conducted on the 28th, 29th, or 30th day of life for all human and chimpanzee newborns. For the SW nursery group, an additional day of testing occurred on the 14th or 15th day of life (included in the graphs but not analysed separately). For the Yerkes ST and RC groups, additional NBAS tests occurred every other day.
Very few modifications were made in the NBAS procedures for testing chimpanzee newborns. Two orientation items was added for chimpanzees at Yerkes (chimpanzee species-typical sounds were added in Orientation). An additional item was administered and scored for chimpanzees at Yerkes (consoling from State 5 was added because consoling from State 6 rarely could be scored due to their lack of crying for 15 seconds or longer).
The emphasis on best performance is an essential component to NBAS testing, common to testing with all neonates. At the Yerkes and SW nurseries, we found that the chimpanzee newborns could become distressed when they were awake and not in grasping contact (with examiner’s clothes, with a ‘security’ towel, with their own hands – see Bard et al., 1990). In comparison with human newborns, it was our impression that the chimpanzees were more often grasping something during the transitions between item administrations, and were less often laid down on the testing table between item administrations. Secondly, in administering the visual orientation items, it was noted that the chimpanzees responded well when the items were slightly further away than the optimal focal distance for most human infants (see Bard, Street, McCrary & Boothe, 1995 for more details of development of visual acuity in chimpanzees). These adjustments are well within the normal administrative adjustments that trained examiners make to obtain and maintain each infant’s best performance.
DATA ANALYSES
The first study question concerned whether the two Yerkes nursery chimpanzee groups differed. Weekly averages (first, second, third, and fourth week of life) were computed due to some scattered missing data when viewed on a day-to-day basis (n=18, 17, for ST and RC respectively, for weekly repeated measures). Repeated measures ANOVAs were conducted on each NBAS item and each NBAS cluster to assess developmental change (Week 1, Week 2, Week 3, Week 4) with between subject variables of Group (RC nursery, ST nursery), and of Sex (Male, Female). Note that there were no main effects of Sex and very few interactions with Sex (see Table 1) in these detailed analyses with the largest chimpanzee groups. Therefore, in the subsequent analyses this variable is dropped. The reported statistics include all significant effects, and effect size is reported as a partial eta2 statistic (the proportion of explained variance).
Table 1.
Summary of ANOVA results for Group (Responsive Care and Standard Care nursery chimpanzees from Yerkes NPRC), Age (weeks 1, 2, 3, 4), and interactions with Sex (M, F).
| Behavior | Age | Gp | Age X Gp | Gp X Sex | Age X Gp X Sex |
|---|---|---|---|---|---|
| Smiles | *** | ns | ns | ns | ns |
| ORIENTATION | ***b | ns | ns | ns | ns |
| Inanimate Visual | ***f | ** | ns | ns | ns |
| Inanimate Auditory | ***z | ns | ns | ns | ns |
| Inanimate Audio-visual | **b | ns | ns | ns | ns |
| Animate Visual | ***e | ns | ns | ns | ns |
| Animate Aud-Human | ***z | ns | ns | ns | t |
| Animate Aud-Chimp | ***z | *** | ns | ns | ns |
| Animate AV-Human | ***a | ns | t | ns | ns |
| Animate AV-Chimp | ***g | ns | * | ns | ns |
| Alertness | ***h | t | * | ns | ns |
| MOTOR | ***e | * | ns | * | ns |
| Tonus | t | ns | ns | ns | ns |
| Maturity | ***e | ns | ns | ns | ns |
| Pull-to-sit | ***a | ns | ns | ns | ns |
| Defensive | ***e | ns | ns | * | ns |
| Activity | **e | ns | ns | ns | ns |
| RANGE | ns | ns | ns | ns | ns |
| Buildup | ns | ns | ns | ns | ns |
| Peak | **e | ns | ns | ns | ns |
| Irritability | ns | ns | ns | ns | ns |
| State change | ns | ns | ns | ns | ns |
| REGULATION | **a | * | ns | ns | ns |
| Cuddliness | ns | ns | * | ns | ns |
| Console (5) | ns | ns | ns | ns | ns |
| Self-quiet | ns | * | ns | ns | ns |
| Hand-to-mouth | ***a | ns | ns | ns | ns |
Note: P values are indicated in the number of asterisks, =p<0.05,
=p<0.01; and
= p<0.001, t= .10>p>0.05, ns P>0.10. Contrasts from the repeated measures ANOVA for age effects, increases a=week 1 to 2; b=week 2 to 3; e=week1 to2, and week 2-3; g=all week to week changes significant; and decreases z=week 1 to week2. Two effects from the ANOVA, main effect of Sex, and interaction of Sex with Age, are not shown in this table since there were not significant for any DVs.
The second study question was whether there were similarities or differences that could be attributed to species. The full data set for comparing all 5 groups was available only for the NBAS tests conducted on the 2nd day and 30th day of life. Sample sizes for each of the 5 groups are listed here, for Day 2 and Day 30, respectively, for the human group, n= 42, 37; for the ST group, n=20, 20; for the RC group, n=17, 17; for the SW, n=7, 7; and for the mother chimpanzee group n=7, 7. To maximize the sample size, univariate ANOVAs were conducted separately for the Day 2 and the Day 30 tests (although repeated measures is normally more powerful, in this case, the reduction is sample size made repeated measures analyses undesirable). The effect size is reported as the partial eta2 statistic, the proportion of explained variance. Each ANOVA included a planned statistical contrast (simple) to test whether the human group differed from each of the 4 chimpanzee groups (reported in the text with exact probability values and).
The third study question followed on from the previous analysis. It was plausible that the group differences found in the 5 group comparison could be (entirely) due to differences among the 4 chimpanzee groups, and so the human group was removed from the data set, and the ANOVA was re-run. In these univariate ANOVAs, again conducted separately for Day 2 and Day 30, the planned statistical contrast (simple) compared each chimpanzee group to the ST group, as this was the group with the largest sample size. Results of the statistical contrasts are reported as exact probability values.
Results
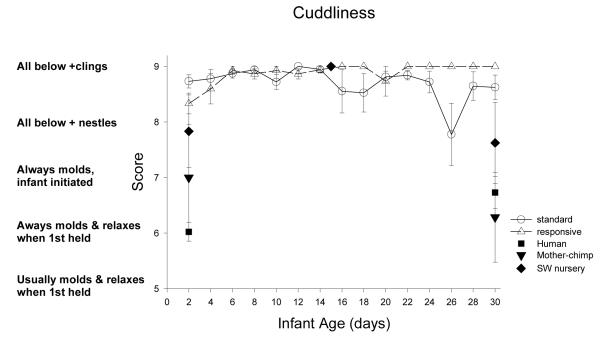
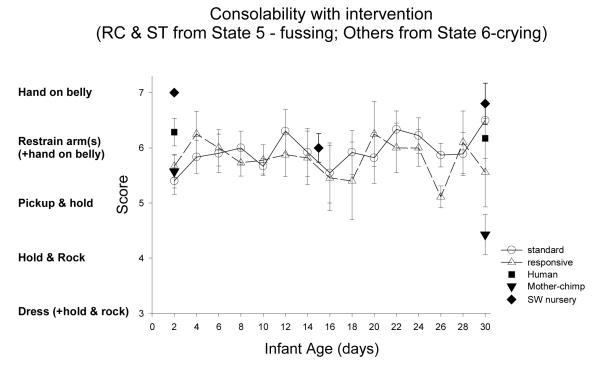
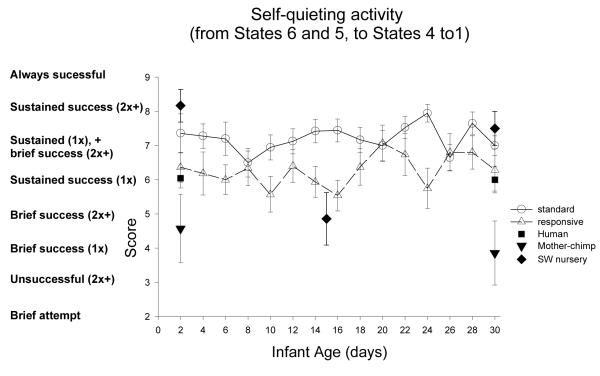
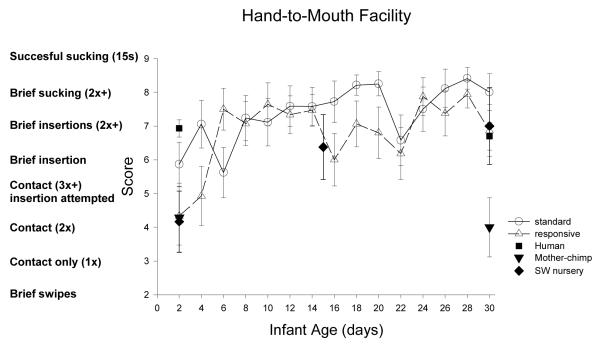
The results are organized under the NBAS clusters headings. For each dependent variable, the complete data from all 5 groups are displayed graphically (Figures 1-26). Statistical results are presented in subsequent paragraphs to answer each of the three study questions for each NBAS score: Study Question 1) Day-to-day comparisons of the ST and RC nursery chimpanzees are summarized in Table 1; Study Question 2) Statistical contrasts of the human group with the chimpanzee groups are summarized in Table 2; and Study Question 3) Statistical contrasts of the ST group with the other chimpanzee groups are summarized in Table 3.
Figure 1.
Figure 26.
Table 2.
Summary of the results of comparing a human group to four different chimpanzee groups on neurobehavioral integrity at 2 and 30 days of age:
| Human v Chimpanzee groups | ||||||||||
|---|---|---|---|---|---|---|---|---|---|---|
| Main effect of Group | Mother | ST | RC | SW | ||||||
|
|
||||||||||
| Age (days) | 2 | 30 | 2 | 30 | 2 | 30 | 2 | 30 | 2 | 30 |
|
|
|
|
|
|
||||||
| Smiles | ns | *** | = | > | = | < | = | = | = | >t |
| ORIENTATION | *** | *** | = | > | < | = | < | = | < | = |
| Inanimate | ||||||||||
| Visual | ns | *** | = | > | = | = | = | > | = | = |
| Auditory | * | *** | = | > | = | > | < | > | = | = |
| Audio-visual | ** | *** | >t | > | < | = | <t | = | = | >t |
| Animate | ||||||||||
| Visual | ns | ** | = | > | = | = | = | = | = | > |
| Auditory | *** | *** | > | > | < | = | < | = | < | = |
| Audio-visual | ns | *** | = | > | = | = | = | = | = | = |
| Alertness | *** | *** | < | > | < | < | < | < | < | = |
| MOTOR | ** | *** | = | > | < | < | < | < | = | = |
| Tonus | *** | *** | < | < | < | < | < | < | < | < |
| Maturity | *** | *** | = | > | < | < | < | < | < | < |
| Pull-to-sit | *** | *** | = | < | < | < | < | < | < | = |
| Defensive | ns | ** | = | > | = | = | = | = | = | = |
| Activity | ** | ns | < | = | > | = | > | = | = | = |
| RANGE | ** | t | = | = | > | = | > | > | >t | = |
| Buildup | *** | *** | = | <t | > | > | > | > | > | > |
| Peak | *** | *** | = | = | > | > | > | > | > | > |
| Irritability | *** | *** | = | < | > | >t | > | > | = | = |
| State change | *** | *** | > | = | > | > | > | >t | = | <t |
| REGULATION | *** | t | > | >t | < | < | = | < | = | = |
| Cuddliness | *** | *** | <t | = | < | < | < | < | < | = |
| Console (see text) | ||||||||||
| Self-quiet | *** | ** | >t | > | < | <t | = | = | < | <t |
| Hand-to-mouth | *** | ** | > | > | = | <t | > | = | > | = |
Note: Results of simple contrasts are indicated by symbols: > if the human group was significantly higher, < if the human group was significantly lower, and = if the human group was not significantly different from each of the chimpanzee groups; marginal effects (probabilities between 0.051 and 0.099) are indicated with a ‘t’.
Table 3.
Summary of the results of comparing four different chimpanzee groups on neurobehavioral integrity at 2 and 30 days of age:
| ST versus other chimpanzee groups | ||||||||
|---|---|---|---|---|---|---|---|---|
| Main effect of Group | RC | Mother | SW | |||||
|
|
||||||||
| Age (days) | 2 | 30 | 2 | 30 | 2 | 30 | 2 | 30 |
|
|
|
|
|
|||||
| Smiles | ns | *** | = | = | = | > | = | > |
| ORIENTATION | ** | *** | = | = | > | > | = | = |
| Inanimate | ||||||||
| Visual | ns | *** | = | > | = | > | = | = |
| Auditory | *** | *** | = | = | > | >t | = | <t |
| Audio-visual | ** | *** | = | = | > | > | = | = |
| Animate | ||||||||
| Visual | ns | * | = | = | = | > | = | <t |
| Auditory | *** | *** | = | = | > | > | = | < |
| Audio-visual | ns | *** | = | = | = | > | = | = |
| Alertness | ns | *** | = | = | = | > | = | > |
| MOTOR | t | *** | = | = | > | > | = | > |
| Tonus | ns | * | = | = | = | = | = | < |
| Maturity | ns | *** | = | = | = | < | = | = |
| Pull-to-sit | * | * | = | = | = | > | > | = |
| Defensive | ns | * | = | = | = | > | = | = |
| Activity | * | ns | = | = | < | = | = | = |
| RANGE | ns | ns | = | = | = | = | = | = |
| Buildup | *** | *** | = | = | < | < | = | = |
| Peak | *** | *** | = | = | < | < | = | = |
| Irritability | * | *** | = | = | < | < | = | = |
| State change | t | *** | = | = | = | = | < | < |
| REGULATION | ** | *** | > | = | > | > | = | >t |
| Cuddliness | t | *** | = | = | > | > | = | > |
| Console (see text) | ||||||||
| Self-quiet | ** | *** | = | = | > | > | = | = |
| Hand-to-mouth | ns | ** | = | = | = | > | = | = |
Note: Results of simple contrasts are indicated by symbols: > if the ST Yerkes nursery group was significantly higher, < if the ST Yerkes nursery group was significantly lower, and = if the ST Yerkes nursery group was not significantly different from another chimpanzee group; marginal effects (probabilities between 0.051 and 0.099) are indicated with a ‘t’.
ORIENTATION
Orientation Cluster
The Orientation cluster scores are the statistical average of all six orientation items scores (responses to the visual, auditory, and visual-auditory presentations of both animate-human and inanimate stimuli) and the Alertness score (Lester, 1984) during each NBAS test.
ST-RC day by day comparison
In comparison of RC and ST chimpanzees in the Orientation cluster, there was a significant age effect, F(3, 96)=13.54,p<0.001, partial eta2=.30, with significant improvement between week 2 and week 3, F(1,31)=17.29, p<0.001, partial eta2=.35. There were no Group differences between ST and RC, no Sex effects and no interactions.
Species comparisons: Contrasts with humans
On Day 2, the 5 groups differed significantly in Orientation Cluster scores, F(4, 86)=6.90, p<0.001, partial eta2=.24. Simple contrasts revealed that the human group was significantly lower that the ST, RC, and SW nursery groups (ps <0.05), but was not different from the mother group (p=.75). On Day 30, the 5 groups differed significantly in Orientation Cluster scores, F(4, 84)=17.22, p<0.001, partial eta2=.45, but the pattern was reversed. The human group was not different from the ST, RC, and SW nursery groups (ps>.25), but was significantly higher than the mother group (p<0.001).
Multi-group chimpanzee comparisons
On Day 2, the 4 chimpanzee groups differed significantly in Orientation Cluster scores, F(3, 46)=4.81, p=0.005, partial eta2=.24. Simple contrasts revealed that the ST group did not differ from the RC and SW nursery groups, (ps > .21) but was significantly higher than the mother group (p<0.001). On Day 30, a significant group effect was found, F(3, 48)=20.42, p<0.001, partial eta2=.56), revealing the same pattern. The ST group did not differ from the other nursery groups, RC and SW (ps > .21) but was significantly higher in Orientation Cluster scores than the mother group (p<0.001).
Inanimate Visual Stimulus (red ball): Figure 1
Orientation to visual stimuli was assessed as the extent to which the infant can follow movement with smooth movements of the eye and head, measured in degrees (Brazelton, 1984). The Inanimate visual stimulus was a red ball.
ST-RC day by day comparison
Orientation to inanimate visual stimulus was higher for ST (M=6.9, SE=0.27) than RC infants (M=5.7, SE=0.28), F(1, 31)=9.43, p=0.004, partial eta2=.23 and changed significant across the first 4 weeks of life: F(3, 93) = 13.66, p<0.001, partial eta2=.31. Within subject contrasts revealed that inanimate visual orientation significantly improved from week 2 (M 5.8 SD 1.49) to week 3 (M=6.6, SD 1.43), F (1, 31) = 15.01, p<0.001, partial eta2=.33, and from week 3 to week 4 (M=6.9, SD 1.58), F(1, 31)=5.08, p=0.03, partial eta2=.14. The interaction of Group and Age was not significant.
Species comparison: Contrast with a human group
At 2 days of age, the human group was not different to any of the chimpanzee groups in inanimate visual orientation with the average score (M=5.25, SD=2.06) indicating smooth following of the red ball for 30 degrees of horizontal movement, F(4, 76)=1.91, p=.12, eta=0.09. In contrast, at 30 days of age, there were significant differences among the groups, F(4, 83)=13.11, p<0.001, partial eta2=.39. The human group was equal to the ST and SW chimpanzees groups (ps>.5), following the red ball across 60 degrees of horizontal movement. The human group was significantly better than the RC chimpanzees, who followed the ball twice across 30 degrees of horizontal movement, and the Mother chimpanzees, who exhibited only brief following (p<0.003).
Multi-group chimpanzee comparisons
On Day 2, the chimpanzee groups did not differ in orientation to the red ball, F(3, 42)=2.15, p=.11, partial eta2=.13. On Day 30, a significant group effect was found, F(3, 48)=8.91, p<0.001, partial eta2=.36. The ST group did not differ from the SW group (p=.72) but scored significantly higher than the RC and the mother groups (ps<0.05).
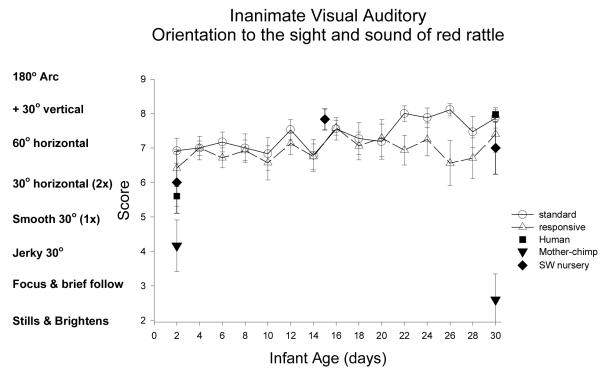
Inanimate Auditory Stimulus (sound of the rattle): Figure 2
Figure 2.
Orientation to auditory stimuli was assessed as the extent to which the infant can turn eyes and head when the stimulus is delivered on the right and left side (twice on each side). This item is measured as general reaction to the sound (scores 2-4) to number of head turns toward the stimulus (scores 6-9). The inanimate auditory stimulus was a red rattle.
ST-RC day by day comparison
The ST and RC chimpanzee groups did not differ in orientation to the sound of the rattle (inanimate auditory stimulus), F(1,32)=0.87, ns, partial eta2=.03. There was a significant main effect of age, with a significant decrease from week 1 to 2, F(1,32)=6.22, p<0.02, partial eta2=.16, and from week 2 to 3, F(1,32)=19.7, p<0.001, partial eta2=.38. The interaction of group and age was not significant.
Species comparison: Contrast with a human group
On Day 2, the 5 groups differed significantly in orientation to the inanimate auditory stimulus, F(4, 87)=3.23, p<0.02, partial eta2=.13. The human group was significantly lower than the RC group (p<0.01), but was not different from the ST, SW or mother groups (p>.10). On Day 30, the 5 groups differed significantly, F(4, 84)=7.28, p<0.001, partial eta2=.26. The human group was significant better than the ST, RC, and mother groups (ps<0.01), but was not different from the SW group (p=.82).
Multi-group chimpanzee comparisons
On Day 2, the 4 chimpanzee groups did not differ in orientation to the sound of the rattle, F(3, 46)= 1.87, p=.15, partial eta2=.11 On Day 30, a significant group effect was found, F(3, 48)=3.19, p<0.05, partial eta2=.17. The ST group did not differ from the RC (p=.80), was marginally better than the mother group (p=0.053), and marginally worse than the SW group (p>.09)
Inanimate Auditory/Visual Stimulus (sight and sound of rattle): Figure 3
Figure 3.
Orientation to the combined auditory-visual stimulus was assessed as the extent to which the infant can follow movement with smooth movements of the eye and head, measured in degrees (scored in the same manner as the orientation to the visual stimuli). The Inanimate auditory-visual stimulus was a red rattle.
ST-RC day by day comparison
There was no difference between ST and RC chimpanzees in orientation to the sight and sound of the rattle (inanimate auditory/visual stimulus), F(1, 32)=1.04, p=.32, partial eta2=.03. There was a significant change with age, F(3, 96)=5.34, p=0.002, partial eta2=.14, with improvement from week 2 to week 3, F(1,32)=6.51, p=0.02, partial eta2=.17. The interaction of group and age was not significant.
Species comparison: Contrast with a human group
At Day 2, there was a significant main effect of group, F(4.80, p=0.002, partial eta2=.20. The human group was significantly lower than ST chimpanzee (p=0.002), marginally lower than the RC group (p=0.079), not different from the SW group (p=.62), and marginally higher than the mother chimpanzees (p=0.053). On Day 30, there was significant main effect of group, F(4,82), p<0.001, partial eta2=.47. The human group was not different from the ST, and RC nursery chimpanzees (ps>.40), was marginally higher than the SW chimpanzees (p=0.073), and was significantly higher than mother chimpanzees (p<0.001).
Multi-group chimpanzee comparisons
On Day 2, the chimpanzee groups differed in orientation to the sight and sound of the red rattle, F(3, 41)=5.75, p<0.002, partial eta2=.30. The ST group did not differ from the RC or SW groups (ps>.14) but scored significantly higher than mother group (p<0.001). On Day 30, the chimpanzee groups differed in orientation to the sight and sound of the red rattle, F(3, 46)=14.51, p<0.001, partial eta2=.49. The ST group did not differ from the RC or SW groups (p>.16) but scored significantly higher than mother group (p<0.001).
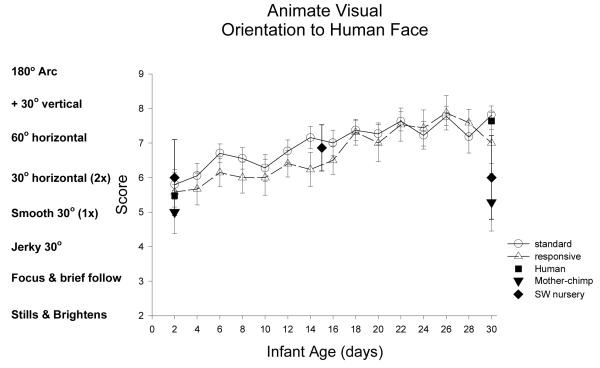
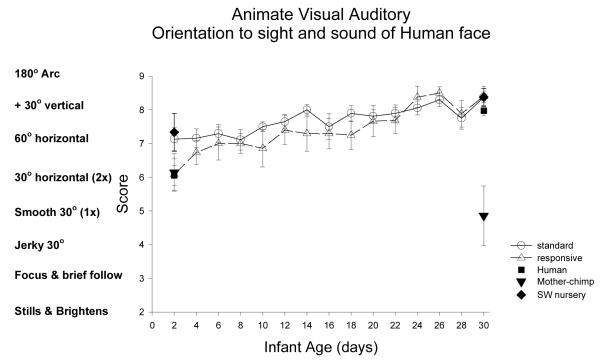
Animate Visual Stimulus (Human Face): Figure 4
Figure 4.
The animate visual stimulus was a moving but silent human face. This item was scored the same as orientation to the inanimate visual stimulus.
ST-RC day by day comparison
Orientation to a dynamically moving but silent human face (the animate visual stimulus), was the same in the ST and RC chimpanzee newborns, F(1,32) =0.87, p=0.36, partial eta2=.03, and improved significantly across the first 4 weeks of life, F(3, 96)=26.01, p<0.001, partial eta2=.45. Contrasts revealed a significant increase in visual orientation to the face: from 1 or 2 smooth 30 degree horizontal follows in week 1 (M=5.9, SE0.19) to more than 2 smooth 30 degree horizontal follows in week 2 (M=6.5, SE 0.18), F(1, 32)= 6.22, p<0.02, partial eta2=.16. Additionally, the Yerkes chimpanzee groups improved from week 2 to week 3(M=7.2, SE 0.19), F(1,32)=19.71, p<0.001, eta =.38. The interaction of group and age was not significant.
Species comparison: Contrast with a human group
At 2 days of age, the groups did not differ in orientation to the animate visual stimulus F(4,80)=0.49, p=.74, partial eta2=.02. At 30 days, the groups differed, F(4, 82)=4.12, p=0.004, partial eta2=.17. Simple contrasts revealed that the human group did not differ from the ST and the RC chimpanzees (ps>.37), but the human group was significantly higher than the SW chimpanzees (p=0.042) and the Mother chimpanzee group (p=.002) in orientation to the animated human face.
Multi-group chimpanzee comparisons
On Day 2, the chimpanzee groups did not differ orientation to the sight of a human face, F(3, 45)=0.58, p=0.63, partial eta2=.02. On Day 30, the chimpanzee groups differed, F(3, 47)=3.92, p<0.02, partial eta2=.20. The ST group did not differ from the RC (p>.16) but scored significantly higher than SW and mother groups (ps<0.05).
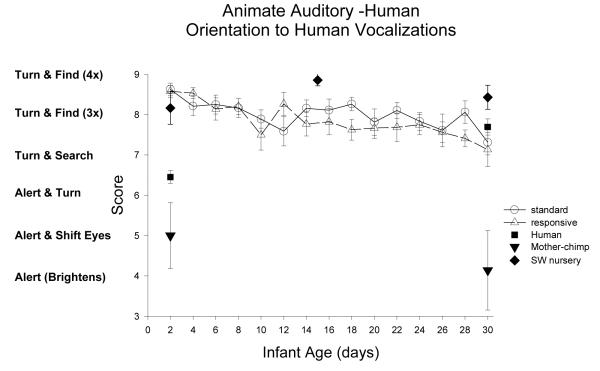
Animate Auditory Stimulus (sound of human voice): Figure 5
Figure 5.
Orientation to animate auditory stimulus was assessed in the same manner as to the inanimate auditory stimulus. The animate auditory-human stimulus was the voice of the human examiner.
ST-RC day by day comparison
In orientation to the animate auditory human voice, there was no group difference, F(1,32)=0.59, p=.45, partial eta2=.02. There was a significant main effect of age, F(3, 96)=10.83, p<0.001, partial eta2=.50, involving a significant decrease from week 1 to week 2, F(1, 32)=15.76, p<0.001, partial eta2=.33. The interaction of group and age was not significant.
Species comparison: Contrast with a human group
At Day 2, there was a significant group difference, F(4, 87)=32.99, p<0.001, partial eta2=.60. The human group was significantly poorer in orienting to the human voice compared to the ST, RC, and SW nursery chimpanzee groups (ps <0.001), but significantly better than the Mother chimpanzee group (p<0.001). At 30 days of age, there was a significant group effect, F(4, 83)=11.53, p<0.001, partial eta2=.36. Simple contrasts revealed that the human group was significantly different (scored higher) only from the mother chimpanzee group (p<0.001).
Multi-group chimpanzee comparisons
On Day 2, the chimpanzee groups differed in orientation to the sound of a human voice, F(3, 46)=26.69, p<0.001, partial eta2=.63. The ST group did not differ from the RC or SW groups (ps>.35) but scored significantly higher than mother group (p<0.001). On Day 30, the chimpanzee groups differed, F(3, 48)=12.63, p<0.001, partial eta2=.44), and a similar pattern was found. The ST group did not differ from the RC (p=.75), scored significantly higher than mother group (p<0.001), and marginally lower than the SW groups (p=.091).
Animate Auditory-Chimpanzee Stimulus: Figure 6
Figure 6.
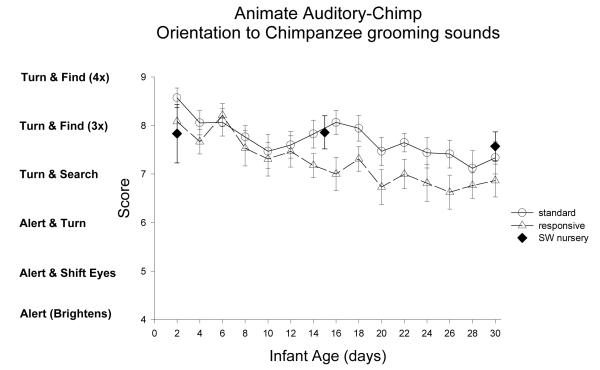
Orientation to animate auditory-chimpanzee stimulus was assessed in the same manner as to the inanimate auditory stimulus. The animate auditory-chimpanzee stimulus was the human examiner producing a species-typical prosocial sound that adult chimpanzees produce during grooming (van Lawick-Goodall, 1968). Note that this was the’ sucking through the teeth’ type of grooming vocalizations that could be varied in loudness and frequency (the other grooming vocalizations used by chimpanzees of ‘teeth clacking’, and ‘raspberries’ are harder to vary).
ST-RC day by day comparison
Interestingly, in orientation to the animate auditory chimpanzee sounds, the ST group scored significantly higher (M=7.7 SE.12) compared to the RC group (M= 7.2 SE.12), F(1,30)=8.05, p<0.001, partial eta2=.21. There was a main effect of age, F(3, 90)=14.71, p<0.001, partial eta2=.33, with a significant decrease from week 1 to week 2, F(1,30)=25.10, p<0.001, partial eta2=.46. The interaction of group and age was not significant.
The chimpanzee sounds were not administered to the human group or the mother-reared chimpanzee newborns so further analyses were not possible.
Animate Auditory/Visual Stimulus (Human voice and face): Figure 7
Figure 7.
The animate auditory-visual stimulus was a moving and talking human face. This item was scored the same as orientation to the inanimate auditory-visual stimulus.
ST-RC day by day comparison
There were two animate complex auditory/visual stimuli, both with an animated human face, but one with human vocalizations and the other with chimpanzee grooming sounds. The ST and RC groups did not differ in orientation to the human auditory/visual stimulus, F(1, 32)=0.98, ns, partial eta2=.03. There was a significant main effect of age, F(3, 96)=22.12, p<0.001, partial eta2=.41. A significant improvement from week1 to week 2, F(1,32)=7.0, p=0.013, partial eta2=.18, and from week 3 to 4, F(1, 32)=21.16, p<0.001, partial eta2=.40.
Species comparison: Contrast with a human group
At day 2, there were no significant group differences, F(4, 83)=2.221, p=0.074, partial eta2=.097. At day 30, there was a significant main effect of group, F(4, 84)=16.39, p<0.001, partial eta2=.44. The human group was not different from the ST, RC, or SW nursery chimpanzee groups in orientation to the human face and voice (ps >.17), but was significantly higher than the mother chimpanzee group (p<0.001).
Multi-group chimpanzee comparisons
On Day 2, the chimpanzee groups did not differ in orientation to the sight and sound of a human, F(3, 45)=2.27, p=0.09, partial eta2=.13. On Day 30, the chimpanzee groups differed, F(3, 48)=18.38, p<0.001, partial eta2=.53. The ST group did not differ from the RC or SW groups (ps>.87) but scored significantly higher than mother group (p<0.001).
Animate Auditory/Visual Stimulus (Human face & sound of chimpanzee): Figure 8
Figure 8.
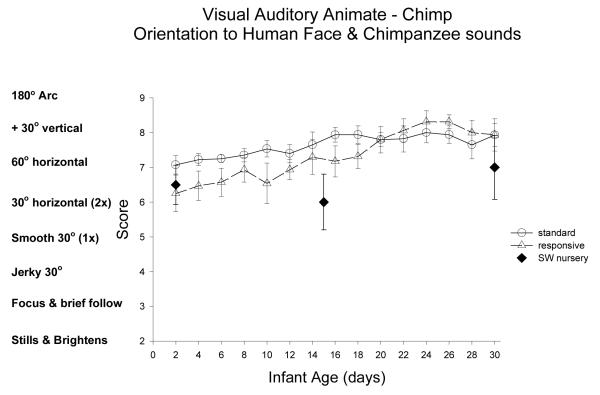
The second animate auditory-visual stimulus was a moving human face producing chimpanzee-typical grooming vocalization (see animate auditory-chimpanzee stimulus). This item was scored the same as orientation to the inanimate auditory-visual stimulus.
ST-RC day by day comparison
The ST and RC groups did not differ in orientation to the complex chimpanzee auditory/human visual stimulus, F(1, 30)=1.03, ns, partial eta2=.03. There was a significant main effect of age, F(3, 90)=22.55, p<0.001, partial eta2=.43, with significant improvement from week 1 to 2, F(1,30)=5.62, p=0.024, partial eta2=.16, and from week 2 to 3, F(1,30)=10.5, p=0.003, partial eta2=.26, and from week 3 to 4, F(1,30)=19.72, p=0.003, partial eta2=.26. There was a trend for an interaction of group and age, F(3, 90)=2.68, p=0.051, partial eta2=.08: the RC chimpanzees had enhanced orientation to animate auditory/visual-chimpanzee stimulus from week 3 to week 4, whereas ST group reached a plateau in week 3, F(1, 30)=7.17, p=0.012, partial eta2=.19.
The chimpanzee sounds were not administered to the human group or the mother-reared chimpanzee newborns so further analyses were not possible.
Alertness: Figure 9
Figure 9.
ST-RC day by day comparison
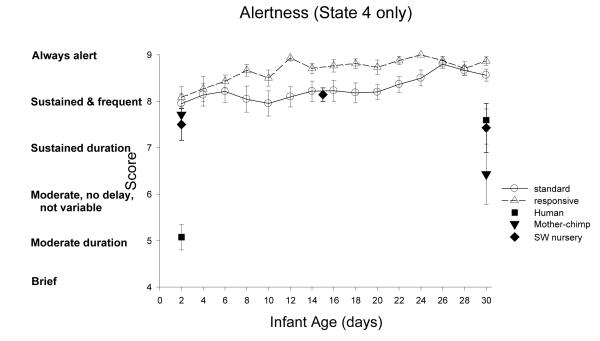
Alertness is an overall score of the newborns responsiveness to the examiner and to orientation stimuli in which the duration and latency of focused attention during the best periods of alertness are scored. There was a group by age interaction, F(3,96)=2.89, p<0.05, partial eta2=.08. From week 1 to 2, the RC group improved (M from 8.2 to 8.7), while ST stayed the same (M 8.2, 8.25), F(1,32)= 4.57, p=0.04, partial eta2=.125. From week 3 to 4, RC stayed same (M 8.8) and ST improved (M from 8.3 to 8.6), F(1,32)=4.64, p=0.039, partial eta2=.127.
Species comparison: Contrast with a human group
At 2 days of age, there was a significant main effect of group, F(4, 86)=27.60, p<0.001, partial eta2=.56. The alertness scores the human group was significantly lower than all the chimpanzee groups (p <0.001). At 30 days, there was a significant main effect of group, F(4, 84)=8.36, p<0.001, partial eta2=.28. The human group was significantly less Alert than the RC and ST groups (ps <0.002), significantly more alert than the mother chimpanzee group (p=0.02), and not different from the SW group.
Multi-group chimpanzee comparisons
On Day 2, the chimpanzee groups did not differ in alertness, F(3, 46)=1.55, p=.21, partial eta2=.09. On Day 30, the chimpanzee groups differed in alertness, F(3, 46)=15.90, p<0.001, partial eta2=.50. The ST group did not differ from the RC group (p=.55) but was significantly higher than both SW and mother groups (ps<0.003).
Inanimate versus Animate comparisons
As a way to summarize orientation performance (as in Bard et al., 1992), average scores were computed for orientation to animate items and orientation to inanimate items. Note than orientation to chimpanzee sounds were not included in these computations.
Species comparison: Contrasts with humans
At day 2, there was a main effect of group, F(4, 87)=4.94, p<0.001, partial eta2=.185. The human group (M 5.8, SE 0.19) was significantly lower than the two Yerkes nursery groups (p<0.001, and p<0.05, respectively), ST (M=7.0 SE= 0.27) and the RC (6.5 SE 0.30), but the human group was not different from the mother (p=.20, M=5.2 SE=0.46), and from the SW chimpanzee groups (p=.11, M=6.7 SE=0.5). There was a significant main effect of stimulus type, F(1, 87) = 21.14, p<0.001, partial eta2=.195: Orientation to animate stimuli (6.5 SE .16) was higher than orientation to inanimate stimuli (5.93 SE .19). At 30 days, there was a main effect of group, F(1,4)=19.24, p<0.001, partial eta2=.48, a main effect of stimulus type (animate higher than inanimate: F(1,84)=28.68, p<0.001, partial eta2=.25), and significant interaction of stimulus type and group, F(4, 84)=3.77, p<0.01, partial eta2=.15. The human group was equally attentive (p=.75) to the inanimate stimuli (7.7 SD 0.86) than the animate stimuli (7.7 SD 1.1). The ST and RC chimpanzee groups, however, were higher in orientation to the animate than the inanimate stimuli, p<0.001, p=0.017, respectively, and SW was marginally higher to animate than inanimate, p=0.058. The mother group was equally relatively inattentive to animate (M= 4.7, SD 1.6) and inanimate (M=3.7 SD 1.5) stimuli (p=.14).
Multi-chimpanzee group comparison
At day 2, there was a significant main effect of stimulus type, F(1, 46)=9.87, p=0.003, partial eta2=.18. Orientation to Animate stimuli (M=6.6 SE.18) was higher than to Inanimate stimuli (M=6.0 SE .23). There was a significant main effect of group, F(3, 46)=4.67, p=0.006, partial eta2=.23. The ST group (M=7.0) was significantly higher than the mother group (M=5.1) (p=<0.001), but not different from the RC or SW groups (ps>.20). There was no interaction. At day 30, there was a significant main effect of stimulus type, F(1, 48)=22.05, p=0.001, partial eta2=.31. Orientation to Animate stimuli (M=7.0 SE.17) was higher than to Inanimate stimuli (M=6.2 SE .20). There was a significant main effect of group, F(3, 48)=19.02, p=0.001, partial eta2=.54. The ST group (M=7.6) was significantly higher than the mother group (M=4.2) (p=<0.001), but not different from the RC or SW groups (ps>.22).
Summary of Orientation
The day-to-day analyses of Orientation scores revealed that there were significant developmental changes in all orientation scores (Table 1). On 7 of 10 items, the Yerkes chimpanzees showed significant improvements with age (4 scores in weeks 1 to 2, 4 scores in weeks 2 to 3, and 3 scores in weeks 3 to 4). On 3 auditory items the Yerkes chimpanzee showed significantly decreased performance (from week 1 to week 2). The ST and RC groups differed significantly on 3 of 10 scores: following the red ball, orienting to chimpanzee sounds, and in Alertness, RC peaked in week 2 whereas ST peaked in week 4. The species comparisons, contrasts with the human group (Table 2), revealed that the human group was equivalent to, or intermediate among the chimpanzee groups for all 8 Orientation scores on both 2 and 30 days. The multi-group chimpanzee analyses revealed significant differences among the chimpanzee groups, on 4 of 8 orientation scores at Day 2 and on 8 of 8 orientations scores at Day30. The orientation performance of RC was most similar to that of ST, and most different from mother chimpanzees (Table 3).
MOTOR
Motor Cluster: Figure 10
Figure 10.
ST-RC day by day comparison
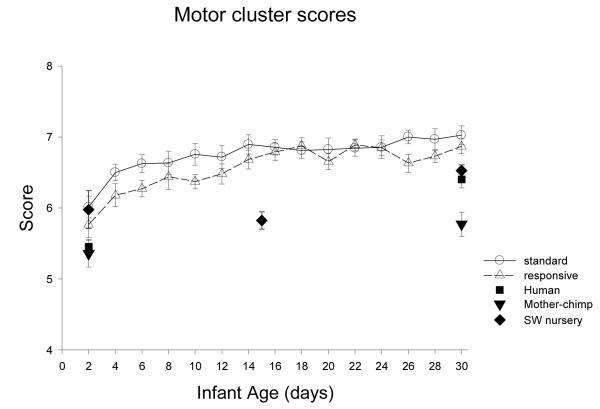
The ST (M=6.7 SE .06) were significantly higher in overall motor performance compared to the RC chimpanzees (M=6.5 SE .06), F(1,31)=5.80, p=0.022, partial eta2=.16, and motor performance changed significantly with age, F(3, 29)=30.27, p<0.001, partial eta2=.76, with significant increase from week 1 to 2, F(1,31)=34.23, p<0.001, partial eta2=.52, and from week 2 to 3, F(1, 31)=10.69, p=0.003, partial eta2=.26. There was no interaction of group by age, but there was an interaction of group by sex, F(1,31)=4.15, p=0.05, partial eta2=.12. The average MOTOR scores for males raised in ST and males raised in RC were equivalent, M= 6.6 (SE .08), but MOTOR scores were significantly higher for females raised in ST, M= 6.9 (.08), compared to females raised in RC, M= 6.5 (SE.09), F(1,16)=12.46, p<0.01, partial eta2=.44.
Species comparison: Contrast with a human group
In the MOTOR cluster, there was significant improvement from Day 2 to Day 30. At Day 2, there was a significant main effect of group, F(4,86)= 4.22, p<.01, partial eta2=.16. Simple contrasts revealed the human group was significantly lower in MOTOR scores compared to the ST and RC groups (ps <0.01), but not different from Mother (ns) or SW (p=0.07). Day 30, there was a significant main effect of group, F(4,84)= 6.74, p<.001, partial eta2=.24. Simple contrasts revealed the human group was significantly lower than ST and RC nursery chimpanzees, and significantly higher than Mother chimpanzees (all ps <0.02), but not different from SW chimpanzees (p=0.22).
Multi-group chimpanzee comparisons
On Day 2, there was a marginal difference among the chimpanzee groups in Motor cluster scores, F(3, 45)=2.63, p-0.062, partial eta2=.15, with ST significantly higher than mother (p<0.01). On Day 30, there was a significant main effect of group in Motor cluster scores, F(3, 48)=15.63, p<0.001, partial eta2=.49. The ST group was significantly higher in motor scores compared to the mother (p<0.001) and the SW groups (p=.03), but was not different from RC (p=.50).
General Motor Tone: Figure 11
Figure 11.
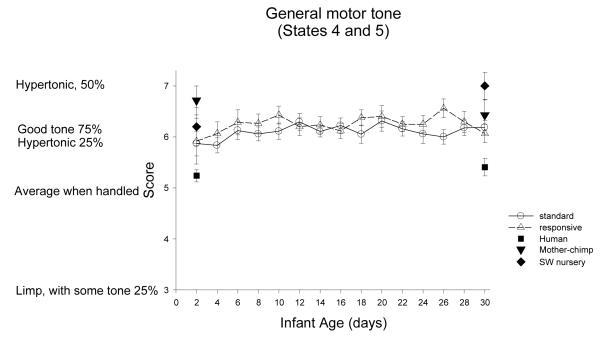
Muscle tonus is a summary measure of motor responses when the newborn is at rest and when handled (Brazelton, 1984), ranging from hypotonic, “limp like a rag doll” (ibid, p 34: score of 1) to hypertonic all the time (score of 9).
ST-RC day by day comparison
RC and ST newborns did not differ in tonus, there was only a marginal main effect of age (p=0.053), and no significant interactions.
Species comparison: Contrast with a human group
On Day 2, there were significant differences across groups, F (4, 85)=5.43, p=0.001, partial eta2=.20. Simple contrasts revealed that the human group was significantly lower in muscle tone compare to all the chimpanzee groups (all ps <0.05). On Day 30, there were significant differences across groups, F (4, 84)=7.96, p<0.001, partial eta2=.28. Simple contrasts revealed that the human group was significantly lower in muscle tone compare to all the chimpanzee groups (all ps <0.01).
Multi-group chimpanzee comparisons
On Day 2, the chimpanzee groups did not differ in general motor tone. On Day 30, they did, F(3, 48)=3.05, p=0.04, partial eta2=.16. The ST group was not different from the RC group, or the mother group (ps >.37), but was significantly lower in muscle tone than the SW group (p=.005).
Motor Maturity: Figure 12
Figure 12.
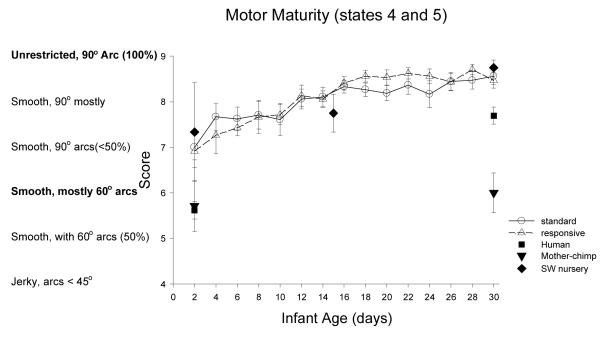
Maturity is an assessment of two aspects of motor development, smoothness versus jerkiness, and range of movement in the limbs, a score of 1 indicates extreme jerky movements and score of 9 indicates all movements are smooth and unrestricted in range.
ST-RC day by day comparison
There was a significant change with age in the Yerkes nursery chimpanzees, F(2.08, 64, 36)=42.91, p<0.001, partial eta2=.58, with significant improvements in maturity from week 1 to 2, F(1, 31)=19.20, p<0.001, partial eta2=.38, and from week 2 to 3, F(1, 31)=38.74, p<0.001, partial eta2=.56. There was not a main effect of group and no significant interactions.
Species comparison: Contrast with a human group
At Day 2, there were significant differences across groups, F (4, 86)=5.82, p<0.001, partial eta2=.21. Simple contrasts revealed that the human group was significantly lower in muscle tone compare to the chimpanzee nursery groups. ST, RC, and SW (all ps <0.01), but not different from the mother chimpanzee (p=0.87). On Day 30, there were significant differences across groups, F (4, 83)=14.96, p<0.001, partial eta2=.42. Simple contrasts revealed that the human group was significantly lower in muscle tone compared to the ST, RC, and SW nursery chimpanzee groups (all ps <0.002), but significantly higher in maturity compared to the mother chimpanzee group (p=0.004).
Multi-group chimpanzee comparisons
On Day 2, the chimpanzee groups did not differ in motor maturity. On Day 30, they did, F(3, 48)=27.63, p<0.001, partial eta2=.63. The ST group was not different from the RC group, or the SW group (ps >.61), but was significantly higher in motor maturity than the mother group (p<.001).
Pull to sit: Figure 13
Figure 13.
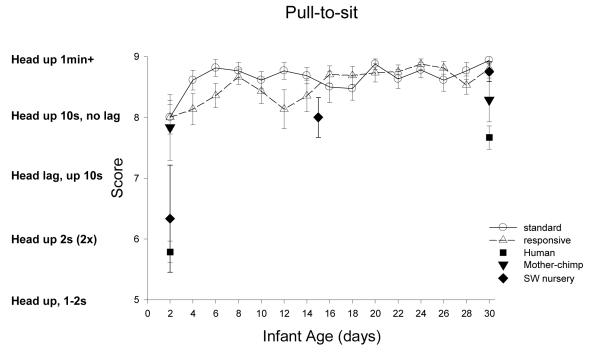
Pull-to-sit is a specific maneuver to assess the newborn’s ability to right the head while gently moving into a seated position. No attempts to right the head receive a score 1 or 2, whereas holding the head during the pull up earns scores of 8 or 9.
ST-RC day by day comparison
There was a significant change with age, F(3,93)=9.66, p<0.001, partial eta2=.24, with a significant increase from week 1 to week 2, F(1, 31)=6.38, p=0.017, partial eta2=.17, and only marginal increase from week 2 to 3, F(1,31)-4.10, p=0.052, partial eta2=.12. There were no other significant effects or interactions.
Species comparison: Contrast with a human group
On Day 2, there were significant differences across groups, F (4, 85) =20.43, p=0.001, partial eta2=.49. Simple contrasts revealed that the human group was significantly less capable of holding the head up compared to ST, RC, and mother groups (all ps <0.001), but was not different form the SW group (p=.29). On Day 30, there were significant differences across groups, F (4, 83)=10.12, p<0.001, partial eta2=.32. Simple contrasts revealed that the human group was significantly less capable of head right in the pull-to-sit compared to ST, RC, and SW groups (all ps <0.001), but was equivalent to mother chimpanzees (p=.075).
Multi-group chimpanzee comparisons
On Day 2, the chimpanzee groups significantly differed in pull-to-sit, F(3,44)=3.88, p=0.015, partial eta2=.21. The ST group was indistinguishable from the RC and mother groups (ps >.50), but significantly better in pull-to-sit than the SW group (p=0.002). On Day 30, there was again a main effect of group, F(3, 48)=2.90, p<0.05, partial eta2=.15. The ST group was not different from the RC or SW groups (ps >.46), but was significantly better in pull-to-sit than the mother group (p<.006).
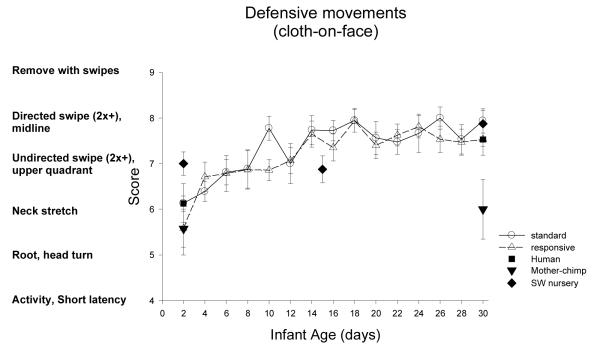
Defensive Movements (cloth-on-face): Figure 14
Figure 14.
Defensive movements to a cloth (cloth-on-face or COF), placed lightly covering the eyes and forehead, is scored as 1 or 2 for general quieting, and scored as 9 if the newborn swipes at and successfully removes the cloth.
ST-RC day by day comparison
There was not a difference between ST and RC in COF scores, but there was a significant change with age, F(3, 93)=25.94, p<0.001, partial eta2=.46. Significant developmental improvement was found from week 1 to 2, F(1, 31)=25.67, p<0.001, partial eta2=.45 and from week 2 to 3, F(1,31)=6.52, p=0.02, partial eta2=.17, . Additionally there was a group by sex interaction, F(1,31)=5.55, p=0.025, partial eta2=.15. Males in ST, M=6.9 (SE0.22), and in RC, M=7.3 (SE0.22) did not differ in COF, but females in ST, M=7.6 (SE .20) were significantly better in COF than females in RC, M=7.0 (SE .22), F(1,16)=5.22, p=0.036, partial eta2=.25.
Species comparison: Contrast with a human group
On Day 2, there was no main effect of group, F(4,84)=1.26, p=0.29, partial eta2=.06. Newborn infants scored 6.11 on average, indicating stretching of the neck was the common response. On Day 30, there were significant differences across groups, F (4, 83)=3.66, p<0.01, partial eta2=.15. Simple contrasts revealed that the human group did not differ from all the nursery chimpanzee groups (all ps >0.43), but scored higher than the mother chimpanzees (p=0.001).
Multi-group chimpanzee comparisons
On Day 2, the chimpanzee groups did not differ in defensive movements, F(3, 45)=1.36, p=0.27, partial eta2=.08. On Day 30, they did, F(3, 48)=3.80, p<0.02, partial eta2=.19. The ST group was not different from the RC group, or the SW group (ps >.70), but scored significantly higher in defensive movements compared to the mother group (p<.003).
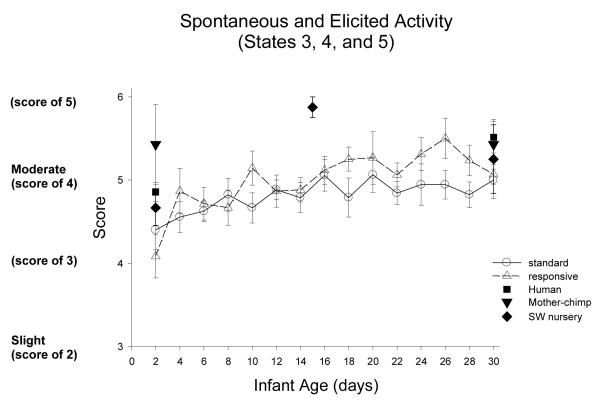
Spontaneous and Elicited Activity: Figure 15
Figure 15.
Activity is a summary score of spontaneous and elicited movements throughout the examination, each is scored on a 4 point scale (from none to much), and the two scores are summed. Activity varies from a score of 1 for no spontaneous and no elicited activity to a score of 8 or 9 for continuous activity.
ST-RC day by day comparison
There was no difference between ST and RC in activity, the Yerkes chimpanzees improved with age, F(3, 93)=6.23, p=0.007, partial eta2=.17, with improvements from week 1 to 2, F(1, 31)=9.87, p=0.004, partial eta2=.24, and from week 2 to 3, F(1,31)=13.95, p=0.001, partial eta2=.31.
Species comparison: Contrast with a human group
On Day 2, there were significant differences in activity across groups, F (4, 86)=4.67, p=0.002, partial eta2=.18. Simple contrasts revealed that the human group was significantly more active than ST and RC groups (ps <0.011), less active than mother chimpanzees (a trend p=0.093) and equivalent in activity to SW chimpanzees (p=.60). On Day 30, there was not a difference across groups in activity (M=5.3, SD0.97).
Multi-group chimpanzee comparisons
On Day 2, the chimpanzee groups differed in spontaneous and elicited activity, F(1, 45)=3.60, p=0.021, partial eta2=.19. The ST did not differ from the other nursery groups, RC and SW (ps>.35), but was significantly lower in activity compared with the mother group (p=0.006). On Day 30, the chimpanzee groups did not differ in activity.
Summary of Motor Performance
The day-to-day analyses revealed significant developmental improvement in 5 of 6 motor scores, with the Yerkes chimpanzees improving from week 1 to 2 (5 of 6), and from week 2 to 3 (4 of 6). There were significant differences between ST and RC females (but not males) in two scores, Motor cluster and defensive (COF). The contrasts with the human group analyses revealed that there was 1 item in which the human group was distinct from all the chimpanzee groups at 2 days, i.e., muscle tone, and 2 items in which the human group was distinct at 30 days, muscle tone and activity. The cross-group chimpanzee analyses revealed significant differences among the chimpanzee groups for 2 of 6 motor scores at 2 days, and for 5 of 6 scores at 30 days. RANGE OF STATE (AROUSAL): Figure 16
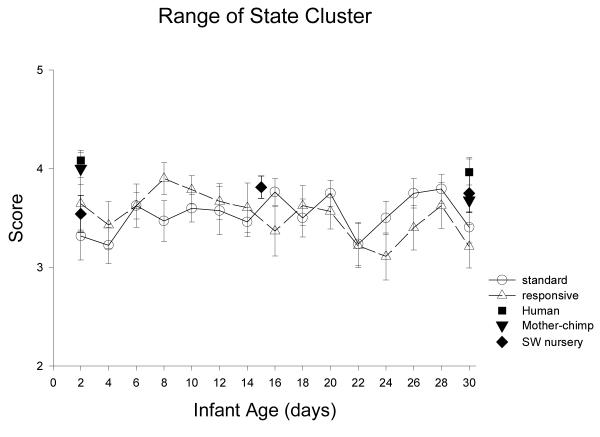
Figure 16.
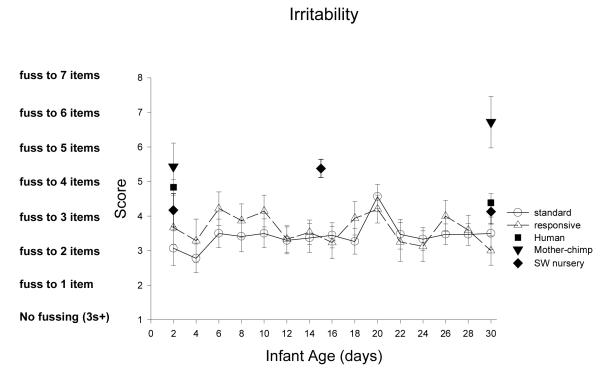
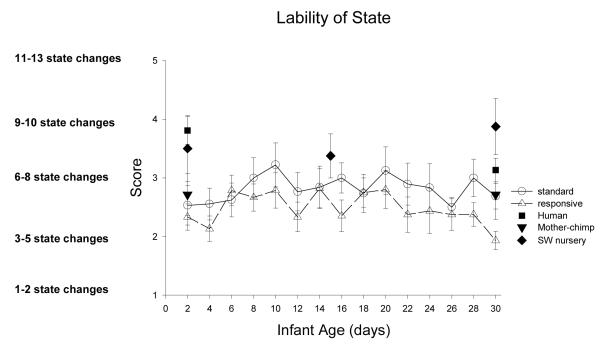
Range of State measures the general and overall arousability of newborns, how quickly they reach aroused behavioral states (rapidity of buildup), how aroused they get (peak of excitement), how often they are irritable, and how often they change from one behavioral state to a different one (lability of state).
ST-RC day by day comparison
There was no difference between ST and RC in Range of State cluster scores, no changes with age, and no interactions (all ps >.15).
Species comparison: Contrast with a human group
On Day 2, there was a significant difference in the range of state cluster scores across groups, F (4, 85)=3.92, p=0.006, partial eta2=.16. The human group was significantly more aroused than ST and RC groups (ps <0.017), marginally more aroused than the SW chimpanzees (p=.09), and not different from the mother chimpanzee group (p=0.79). On Day 30, there was only a marginal trend for group differences (p=0.065), with the human group differing only from the RC chimpanzee group in Range of state cluster scores (p=0.005).
Multi-group chimpanzee comparisons
On Day 2, the chimpanzee groups did not differ in Range of State cluster scores, F(3, 44)=1.00, p=.40, partial eta2=.06. On Day 30, there were no differences among the chimpanzee groups in this overall measure of arousability, F(3,48)=0.77, p=.52, partial eta2=.05.
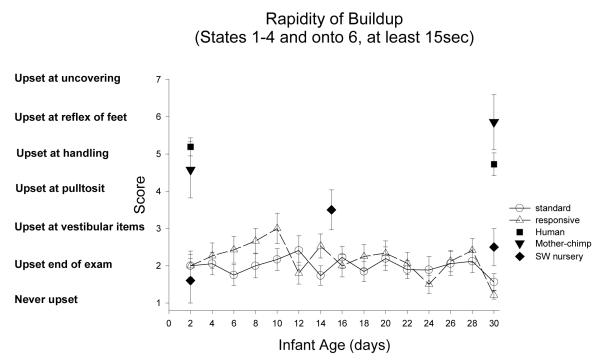
Rapidity of Buildup: Figure 17
Figure 17.
Rapidity of buildup measures the point in the examination when the newborn “loses control” of a calm behavioral state, and first cries for 15 seconds or more. This item is scored by indicating the time when the newborn cries, a score of 1 indicates the infant was never upset, and a score of 9 indicates that the infant was never quiet.
ST-RC day by day comparison
There was no difference between ST and RC in Buildup scores, no changes with age, and no interactions (all ps >.19).
Species comparison: Contrast with a human group
On Day 2, there were significant differences in rapidity of buildup across groups, F (4, 85)=21.98, p<0.001, partial eta2=.51. Simple contrasts revealed that the human group first cried when undressed or handled (score of 5) which was significantly earlier in the exam compared with the ST, RC and SW groups (ps <0.001), who cried only at the end of the exam. At Day 2, rapidity of buildup was not different in the human group and the mother chimpanzees (p=0.32). On Day 30, a similar pattern was found. There were significant differences in rapidity of buildup across groups, F (4, 82)=25.22, p<0.001, partial eta2=.55. Simple contrasts revealed that the human group first cried when undressed or handled, or when motor skills (e.g., pull-to-sit) were tested (score of 5 or 4, respectively) which was significantly earlier in the exam compared with the ST, RC, and SW (ps <0.001), who cried first with the intrusive vestibular stimulation items, the end of the exam, or not at all (score of 3, 2 or 1, respectively). At Day 30, there was a marginal trend for rapidity of buildup to be lower (first cries significantly later in the exam) in the human group compared with the mother chimpanzees (p=0.07).
Multi-group chimpanzee comparisons
On Day 2, there was a significant difference among the chimpanzee groups, F(3, 44)=5.81, p=0.002, partial eta2=.28. The ST became distressed significantly later in the exam compared with the mother raised infants (p=0.001). The ST, RC, and SW nursery groups did not differ (p>.46). On Day 30, the same pattern was evident: there was a significant difference among the chimpanzee groups, F(3, 47)=25.59, p<0.001, partial eta2=.62. The ST became distressed significantly later in the exam compared with the mother raised infants (p=0.001). The ST, RC, and SW nursery groups did not differ (p>.46).
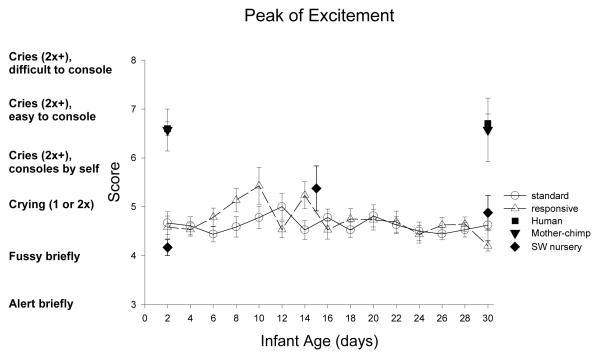
Peak of Excitement: Figure 18
Figure 18.
Peak of excitement measures the newborn’s highest state of arousal, and the most predominant state of arousal. A score of 1-4 indicates that the newborn never cried (i.e., did not reached a state 6 for 15 sec), and scores of 9 indicates that the newborn reached a state of unconsolable crying.
ST-RC day by day comparison
There was no difference between ST and RC in Peak of excitement scores, but there was a significant change with age, F(3, 93)=5.36, p=0.002, partial eta2=.15. Yerkes chimpanzees became more aroused in the 2nd week compared to the first week, F(1,31)=6.05, p=0.02, partial eta2=.16, and became less aroused in the 3rd week compared to the 2nd week, F(1,31)=5.53, p=0.025, partial eta2=.15. Yerkes chimpanzee newborns maintained Peak scores between 4 and 5, indicating they reached a fussy behavioral state (score of 4) but did not reach a 15 sec period of crying (i.e., score of 5). There were no significant interactions.
Species comparison: Contrast with a human group
On Day 2, there was a significant differences in peak of excitement across groups, F(4, 86)=30.93, p<0.001, partial eta2=.59. Simple contrasts revealed that the human group was significantly more often in higher states of arousal than ST, RC, and SW nursery groups (ps <0.001), but was equivalent in peak of excitement with mother chimpanzees (p=0.95). On Day 30, the same pattern was found. There was a significant differences in peak of excitement across groups, F(4, 84)=20.74, p<0.001, partial eta2=.50. Simple contrasts revealed that the human group was significantly more often in higher states of arousal than the ST, RC, and SW nursery groups (ps <0.001), but was equivalent in peak of excitement with mother chimpanzees (p=0.66).
Multi-group chimpanzee comparisons
On Day 2, there was a significant difference among the chimpanzee groups, F(3, 45)=12.23, p<0.001, partial eta2=.45. The ST, RC, and SW nursery groups did not differ in peak of excitement (ps>.24), but the mother chimpanzee reached a significantly higher behavioral state than the ST group (p=0.001). On Day 30, the same pattern was evident: there was a significant difference among the chimpanzee groups, F(3, 48)=7.50, p<0.001, partial eta2=.32. The ST, RC, and SW nursery groups did not differ in peak of excitement (p>.31), but the mother chimpanzee reached a significantly higher behavioral state than the ST group (p=0.001).
Irritability: Figure 19
Figure 19.
Irritability assess the number of specific items that the infant finds aversive, that is responds with fussiness or crying for at least 3sec. A score of 1 indicates that the newborn was not irritable to any of the 8 items, and scores of 9 indicates that the newborn fussed or cried to all 8 items.
ST-RC day by day comparison
There was no difference between ST and RC in irritability scores, no change with age, and no significant interactions (all ps >.37).
Species comparison: Contrast with a human group
On Day 2, there were a significant differences in irritability across groups, F (4, 86)=7.05, p<0.001, partial eta2=.25. Simple contrasts revealed that the human group was significantly more irritable than the ST and RC groups (ps <0.002), but not different from the SW or the mother chimpanzee groups (ps>.35). On Day 30, there was a significant difference across groups F(4, 84)=5.78, p<0.001, partial eta2=.22. At 30 days, the Human group was significantly more irritable than RC (p=0.041), marginally more irritable than the ST group (p=0.08), not different in irritability from the SW group (p=.70) and significantly less irritable than the mother group (p=0.001).
Multi-group chimpanzee comparisons
On Day 2, there was a significant difference among the chimpanzee groups, F(3, 45)=4.07, p<0.02, partial eta2=.21. The ST, RC, and SW nursery groups did not differ in irritability (ps>.24), but the mother chimpanzee group was irritable to significantly more items compared to the ST group (p=0.001). On Day 30, the same pattern was evident: there was a significant difference among the chimpanzee groups, F(3, 48)=7.50, p<0.001, partial eta2=.32. The ST, RC, and SW nursery groups did not differ in irritability (p>.43), but the mother chimpanzee were fussed or cried to significantly more items than the ST group (p=0.001).
Lability of state: Figure 20
Figure 20.
Lability of state measures how many behavioral state changes were observed during the course of the exam, with the proviso that each state change be maintained for at least 15 sec. A score of 1 indicates low lability, i.e., the newborn changed state only once or twice, whereas a score of 9 indicates very high lability, i.e., the newborn had 23 or more behavioral state changes.
ST-RC day by day comparison
There was no difference between ST and RC in lability of state scores, no change with age, and no significant interactions (all ps >.11).
Species comparison: Contrast with a human group
On Day 2, there was a significant difference across groups, F (4, 86)=6.84, p<0.001, partial eta2=.24. Simple contrasts revealed that the human group had significantly more changes of state than ST, RC, or mother groups (ps <0.05), but were equivalent to SW chimpanzees (p=.59). On Day 30, there was a significant difference across groups, F (4, 84)=5,21, p=0.001, partial eta2=.20. Simple contrasts revealed that the human group were not different from the mother group (p=.34), were marginally lower than the SW group (p=.08), were marginally higher than the ST group (p=.07), and had significantly more changes of state than the RC group (p <0.001).
Multi-group chimpanzee comparisons
On Day 2, there was a trend for a difference among the chimpanzee groups, F(3, 45)=2.35, p=0.085, partial eta2=.13. The ST, RC, and mother groups did not differ (ps>.47) with 3-5 state changes, but the SW exhibited 6- 10 changes of state, significantly more than the ST group (p=0.032). On Day 30, the same pattern was evident, but now reached significance, F(3, 48)=7.20, p<0.001, partial eta2=.31. The ST, RC, and mother groups did not differ in lability of state (p>.09), but the SW chimpanzee exhibited significantly more state changes than the ST group (p=0.002).
Summary of Range of State (Arousal)
The day-to-day ST and RC group analyses (Table 1) revealed a lack of developmental change (no age changes in 4 of 5 Range scores) and a lack of group differences (in all 5 Range of State scores). The contrasts with human analyses (Table 2) revealed that the human group was not distinct on any of the 5 scores on either Day 2 or Day 30. On Day 2, the human group was similar to the SW group (3 of 5 Range scores) and to the mother group (4 of 5 Range scores). On Day 30, the human group was similar to the SW group (2 of 5 Range scores) and to mother group (3 of 5 Range Scores), and was significantly intermediate among the chimpanzees group on 1 of 5 Range scores. The cross-group chimpanzee analyses (Table 3) revealed significant group difference on 4 of 5 Range scores, with the ST group differing from the mother group (3 of 4 scores), and the SW group (1 of 4 scores).
STATE REGULATION (COPING)
State Regulation Cluster :Figure 21
Figure 21.
The State Regulation clusters measures coping when aroused, how the infant responds to being held by the examiner (cuddliness), the examiner maneuvers that are needed to console the infant, how well the infant self-quiets, and the infant’s hand-to-mouth ability (often used as a specific way that infants can self-quiet: see Bard et al., 1990 for illustration of hand-to-mouth).
ST-RC day by day comparison
The ST group had significantly higher State Regulation cluster scores than the RC group, F(1,31)=5.25, p=0.03, partial eta2=.14. Additionally, there was a significant change with age, F(3, 93)=5.45, p=0.002, partial eta2=.15; with a significant increase from week 1 to week 2, F(1, 31)=7.10, p=0.012, partial eta2=.19 . There were no interactions.
Species comparison: Contrast with a human group
On Day 2, there was a significant difference in the State Regulation cluster scores across the 5 groups, F (4, 86)=5.15, p=0.001, partial eta2=.19. The human group was significantly lower in State Regulation than the ST group (p=0.001), marginally higher than Mother chimpanzees (p=.056), and not different from the RC and SW groups (ps>.41). On Day 30, there was a marginally significant group difference (p=0.065). The State Regulation scores of the human group were significantly lower than the ST and RC groups (p<0.001), significantly higher than the Mother group (p<0.002), but not different from the SW groups (p=0.20).
Multi-group chimpanzee comparisons
On Day 2, the chimpanzee groups significantly differed in State Regulation cluster scores, F(3, 45)=5.42, p=0.003, partial eta2=.27. ST chimpanzees were significantly higher than the RC (p=0.014) and mother groups (p<0.001), but were not different from the SW group (p=0.21). On Day 30, the chimpanzee groups significantly differed in State Regulation cluster scores, F(3, 48)=20.05, p<0.001, partial eta2=.56. ST chimpanzees were significantly higher than the mother group (p<0.001), were marginally higher than the SW group (p=0.063), and were not different from the RC group (p=0.78).
Cuddliness: Figure 22
Figure 22.
Cuddliness measures how the newborn responds when being held by the examiner. If the infant nestles and molds on his or her own initiative, they are scored 7-9, if the infant resists or is unresponsive to the examiners facilitation then they are scored 1-3 in cuddliness.
ST-RC day by day comparison
There was no difference between ST and RC in Cuddliness scores (p>.20), no changes with age (p>.35), but there was a significant interaction between group and age, F(3, 93)=3.25, p=0.025, partial eta2=.10. The ST and RC groups were equivalent in cuddliness for weeks 1, 2, and 3 (ps>.21), but in week 4, the RC group was significantly more cuddly than the ST group, F(1,34)=4.40, p=0.043, partial eta2=.11.
Species comparison: Contrast with a human group
On Day 2, there were significant differences in cuddliness across the 5 groups, F (4, 86)=19.91, p<0.001, partial eta2=.48. Simple contrasts revealed that the human group was significantly less cuddly compared with the ST, RC and SW groups (ps <0.001), but only marginally different (p=0.053) from the mother chimpanzee group in cuddliness with a human examiner. On Day 30, there were significant differences in cuddliness across the 5 groups, F (4, 82)=25.22, p<0.001, partial eta2=.55. Simple contrasts revealed that the human group was significantly less cuddly than the ST and RC chimpanzees (ps <0.001), but was not different from either the mother or the SW chimpanzee groups (ps>.12).
Multi-group chimpanzee comparisons
On Day 2, there was only a marginal difference among the chimpanzee groups, p=0.053, with the ST higher in cuddliness compared to the mother group (p=0.008). On Day 30, there was a significant difference among the chimpanzee groups, F(3, 47)=25.59, p<0.001, partial eta2=.62. The ST scored significantly more cuddly compared with the mother raised (p<0.001) and the SW infants (p=0.04).
Consolability: Figure 23
Figure 23.
Consolability measures the maneuvers used by the examiner to assist the infant in returning to quiet alert behavioral state (State 4) from a period of active crying (State 6). Both the initial crying state (State 6) and the achieved quiet state must be maintained for 15 seconds to receive a score on this item. A score of 1 indicates that the newborn is not consolable by any of the 8 specific consoling maneuvers, and a score of 9 indicates that the newborn was consoled by the least intrusive maneuver, visual presentation of examiner’s face.
ST-RC day by day comparison
In the Yerkes nursery, 35 of 37 newborn chimpanzees did not maintain a crying state for 15 seconds, and thus did not receive a score on consolability. In order to compare an aspect of consolability, both ST and RC Yerkes chimpanzees were consoled from a 15 sec period of fussiness (State 5) rather than crying. There were no significant main effects of group, age, sex, nor any significant interactions.
Species comparison: Contrast with a human group
There were insufficient sample sizes to conduct ANOVAs on consolability (from State 6) for the nursery chimpanzee groups at 2 or 30 days of age (no sustained State 6 scores for 19, 17 of ST; for 16, 10 of RC; and 5, 3 of the SW groups, respectively). At 2 days, there was not a significant difference between the human group and the mother chimpanzees. At 30 days, the human group needed significantly less intervention to console than did the mother chimpanzee group.
It seemed possible that there was a species difference in whether or not consolability from State 6 was measured. Two (console could be score v not scored) by two (human v a chimpanzee group) Chi-square tests revealed that there was a significant effect when the human group was compared with the ST (ps<0.001), with the RC (ps<0.001), and the SW (ps<0.05) groups at both ages. The mother chimpanzees, however, all received consoling scores and the chi-square comparing this group to the human group was not significant at either day.
Self-quieting Activity: Figure 24
Figure 24.
Self-quieting success (how many times) and the length of successful bouts (changes from a crying/fussy State 6/ 5 to a quiet behavioral State 4) were measured by this item. A score of 1 indicates that the newborn does not make any attempt to self-quiet (by sucking, or by orienting, or by hand-to-mouth behaviors) and a score of 9 indicates that the newborn always self-quiets for sustained periods.
ST-RC day by day comparison
There was a significant main effect of group, F(1, 28)=5.99, p=0.021, partial eta2=.18, The ST infants were significantly better at self-quieting (M=7.2, SE .23) compared to the RC infants (M=6.4, SE.24). There were no changes with age, and no significant interactions (all ps >.45).
Species comparison: Contrast with a human group
On Day 2, there were a significant differences in self-quieting across the 5 groups, F (4, 82)=5.20, p<0.001, partial eta2=.20. Simple contrasts revealed that the human group was significantly less able to self-quiet compared with the ST and SW groups (ps <0.02), not different from the RC group (p=.25), and marginally better than the mother chimpanzee group (p=0.055). On Day 30, there was a significant difference in self-quieting across groups, F (4, 82)=4.76, p<0.002, partial eta2=.19. The human group was marginally less able to self-quiet compared to the ST (p=0.09) and SW groups (p =0.059), not different from the RC group (p=.18), and the human group was significantly better at self-quieting compared to the mother chimpanzee group (p=0.011).
Multi-group chimpanzee comparisons
On Day 2, there was a significant difference among the chimpanzee groups, F(3, 41)=5.38, p<0.003, partial eta2=.28. The ST, RC, and SW groups did not differ in self-quieting (ps>.21), but the mother chimpanzee group was significantly less able to self-quiet (p=0.001). On Day 30, the same pattern was evident: there was a significant difference among the chimpanzee groups, F(3, 47)=7.35, p<0.001, partial eta2=.32. The ST, RC, and SW nursery groups did not differ in self-quieting (p>.51), but the mother chimpanzee were less able to self-quiet than the ST group (p<0.001).
Hand-to-mouth Facility: Figure 25
Figure 25.
Hand-to-mouth facility measures how well the infant actively brings the hand to proximity with the mouth and the success in inserting some part of the hand for sucking. A score of 1 indicates that no hand-to-mouth contact was attempted, and a score of 9 indicates that the fingers or fist was successfully inserted for at least a 15sec period of sucking.
ST-RC day by day comparison
There was no difference between ST and RC in hand-to-mouth facility, but there was a change with age, F(3, 93)=9.98, p<0.001, partial eta2=.24, with a significant increase from week 1 to week 2, F(1, 31)=21.28, p<0.001, partial eta2=.41. There were no other significant main effects or interactions (all ps >.10).
Species comparison: Contrast with a human group
On Day 2, there was a significant difference across the 5 groups, F(4, 86)=5.24, p<0.001, partial eta2=.20. Simple contrasts revealed that the human group had significantly better hand-to-mouth facility than RC, SW, and the mother chimpanzee groups (ps <0.007), but the human group was not different from ST chimpanzees (p=.34). On Day 30, there was a significant difference across the 5 groups, F(4, 83)=3.83, p=0.007, partial eta2=.16. Simple contrasts revealed that the human group was significantly better in hand-to-mouth compared with the mother group (p=.009), were marginally lower than the ST group (p=.051), and were not different from the RC and SW groups (p>.28).
Multi-group chimpanzee comparisons
On Day 2, the chimpanzee groups were not different in hand-to-mouth facility. On Day 30, there was a significant group difference, F(3, 48)=4.85, p<0.005, partial eta2=.23. The ST group had significantly higher hand-to-mouth facility compared to the mother group (p<0.001).
Summary of State Regulation
The day-to-day analyses comparing the ST and RC groups found group difference in 3 of 5 Regulation scores (the cluster, self-quieting, and week 4 Cuddliness), and developmental change in 2 of 5 Regulation scores. The cross-species analyses found the human group was not distinct in any of the State Regulation scores at day 2 (0 of 4 scores), or at day 30 (0 of 4 scores). The human group was equivalent a chimpanzee group on 4 scores on Day 2 (similar to RC and to Mother on 2 items, to ST and to SW on 1 item) and on all 4 of the scores on Day 30 (similar to SW on 4 items, to ST and to RC on 2 items, and to mother on 1 item). The cross-group comparisons revealed that the chimpanzee groups were different on 2 of 4 State Regulation scores on day 2, and on all 4 State Regulation scores on day 30. The ST group was most similar to the SW group at 2 days of age (no difference in 4 of 4 scores), and the RC group at 30 days (no difference in 4 of 4 scores), and most dissimilar to the mother group (different on 3 of 4 scores on day 2 and 4 of 4 scores on day 30).
SMILE: Figure 26
The final item of the NBAS does not fit into any single cluster and is analyzed separately. The total number of smiles observed during the entire NBAS examination is recorded.
ST-RC day by day comparison
There was not a difference between ST and RC in number of smiles, but there was a significant change with age, F(3, 93)=9.98, p<0.001, partial eta2=.24, with a significant increase from week 1 to week 2, F(1, 31)=21.28, p<0.001, partial eta2=.41. There were no other main effects or interactions (all ps >.10).
Species comparison: Contrast with a human group
On Day 2, there was no difference across the 5 groups in smiles, F (4, 71)=1.72, p=0.16, partial eta2=.09. On Day 30, there was a significant difference across the 5 groups, F (4, 78)=5.66, p<0.001, partial eta2=.22. Simple contrasts revealed that the human group smiled significantly more often than the mother group (p=.027), marginally more than the SW group (p=0.072), smiled as often as the ST group (p=0.12), but smiled significantly less often than the RC group (p=0.02).
Multi-group chimpanzee comparisons
On Day 2, the chimpanzee groups were not different in number of smiles, F(3,45)=1.01, p=.40, partial eta2=.06. On Day 30, there was a significant group difference, F(3, 48)=7.25, p<0.001, partial eta2=.31. The ST group smiled significantly more than the SW and the mother groups (p<0.01), but not more than RC (p=.39).
Overall NBAS data summary
For the two chimpanzee groups that were tested every other day, significant developmental change was evident in 19 of 27 NBAS scores, but differences between the ST and RC groups were minimal (in 9 of 27 NBAS scores) albeit pervasive (the groups differed in 3 of 4 different clusters - in 4 of 10 Orientation scores, in 2 of 6 Motor scores, none of 5 Range of State scores, and 3 of 5 State Regulation scores). The results of the cross-species and cross-group chimpanzee analyses are summarized in Table 4 and can be stated simply: The human group was distinct from the chimpanzees in 1 of 24 NBAS scores, and there were significant differences among the four chimpanzee groups in 23 of 24 NBAS scores.
Table 4.
Explanations for variation in NBAS item and cluster outcomes
| NBAS system | Genetic | Experience | Epigenetic |
|---|---|---|---|
| Human v Chimpanzee? | Chimpanzees? | Species by Rearing? | |
| ORIENTATION | 0 of 8 | 8 of 8 | 8 of 8 |
| MOTOR | 1 of 6 | 6 of 6 | 5 of 6 |
| RANGE OF STATE | 0 of 5 | 4 of 5 | 5 of 5 |
| STATE REGULATION | 0 of 4 | 4 of 4 | 4 of 4 |
| Smiles | 0 of 1 | 1 of 1 | 1 of 1 |
|
| |||
| TOTAL | 1 of 24 | 23 of 24 | 23 of 24 |
DISCUSSION
In the first month of life, humans and chimpanzees do not seem so very different. Four different chimpanzee groups and one group of human infants were compared on 25 scores from the Neonatal Behavioral Assessment Scale (NBAS), a measure of the neurobehavioral integrity of newborn infants (Brazelton, 1984). The human group was found to be distinct from the chimpanzee groups on 1 of 21 items and on none of 4 cluster scores. There was significant variation among the 4 chimpanzee groups on over 40% of the NBAS scores at 2 days of age (11 of 25), and almost 90% of the NBAS scores at 30 days (22 of 25). The lack of differences between the species, the clear differences among the chimpanzee groups, and the increase in chimpanzee group differences with 30 days of experience, suggests that these neonatal neurobehavioral outcomes are the result of epigenesis, gene-environment interactions, not species, per se.
Bard (2005) proposed three mechanisms to explain patterns of human-chimpanzee similarities and differences. The first mechanism to explain results would be genetic. Statistically significant differences between the human newborns and the chimpanzee newborn groups would support claims of species differences. There was one such finding, in the motor cluster, in which the chimpanzees scored significantly more hypertonic than the human group. We should note explicitly that the human group in this study was a Caucasian, upper middle class sample from an industrialized eco-culture that may not best represent the human species, especially when viewed in evolutionary perspective (e.g., Henrich, Heine, & Norenzayan, in press; Keller, 2007). Moreover, significant differences among human groups have been found in multiple aspects of neonatal behavior. For example, higher orientation in Puerto Rican infants, and better motor performance in Black infants compared to Caucasian 2-day-old infants has been found (Garcia Coll, Sepkoski, & Lester, 1979). Lower motor performance and lower arousal has been reported for Asian samples compared to US Caucasian samples (Nugent, et al., 1989). It is likely that the eco-cultural setting, rather than ethnicity per se, is of major influence on the neurobehavioural organization of the developing infant (e.g., Bard, 2005: Brazelton, 1979; Keller et al., 2004; Sorenson, 1979; Trevarthen & Aitken, 2001; Tronick, Morelli, & Winn, 1989; but see Freedman, 1971 for an alternate view).
The second mechanism, human exposure, related to the extent that the chimpanzee groups interacted with humans and their artifacts. One group of chimpanzees, responsive care (RC) had 4 hours per day more time with humans than did the standard care (ST), who in turn had extended interactions around care activities (bottle feeding and diaper changing) more often than the did the infants raised at the Southwest Foundation for Biomedical Research (SW) nursery, where human faces were consistently covered for human health & safety. All the nursery chimpanzees were in incubators surrounded by towels or cloths for at least 12 hours a day. In contrast, the mother-reared chimpanzee infants interacted with humans and human artifacts only twice, during the NBAS test at 2 days and at 30 days of age. Therefore, if the nursery-raised infants were different from the mother-raised chimpanzees, and the human infants more like the nursery chimpanzees, then exposure to humans might explain the pattern of results.
The third mechanism that Bard (2005) suggested to account for group differences was the extent of cradling contact with a caregiver. Mother-raised chimpanzees had 100% cradling contact, and the human infants had lots of cradling contact, but significantly less than 100% contact. In the nursery chimpanzee groups, the RC chimpanzees had 4 hours per day of additional cradling contact. The ST nursery chimpanzee infants had about 30 minutes of cradling contact with warm caregivers around care activities, and the SW nursery chimpanzee group had only minutes per day of cradling contact with caregivers (but had hours of vestibular stimulation in a mechanical swing). If the pattern of results was that the mother chimpanzees were similar to the human infants, followed closely by the RC infants, and the ST and SW infants were quite different, then it is possible that cradling contact could explain the distribution (Bard, 2005). Cradling contact is an important variable as it explains the extent of mutual gaze between 3 month-olds and their caregivers, in chimpanzees (Bard et al., 2005), western human infants (Lavelli & Fogel, 2002), and in humans raised in different cultures (Keller, 2007).
The multi-dimensionality of the NBAS test is particularly useful in delineating how species, rearing or epigenetic effects might differentially influence domains of neurobehavioral organization. In smiles and orientation, there were effects of rearing and gene-environment interactions. The human group was similar (in more than 5 of 9 scores) to the nursery chimpanzees groups, and mostly different from the mother-reared chimpanzees, especially at 30 days of age. This supports an argument that exposure to the sight and sounds of humans (and their artifacts) has an important influence on orientation and social responsiveness to human examiners, even withn the first 30 days of life. The effect of exposure to human caregivers has a demonstrable effect on chimpanzees’ attention and socio-emotional responsiveness (Bard, 2005; Bard et al., 1992). Intersubjectivity is evident in neonatal imitation and other types of mutual engagements in humans (Bullowa, 1979; Meltzoff & Moore, 1989; Field, Greenberg, Woodson, Cohen, & Garcia, 1984 Kuguimutzakis, 1999; Trevarthen, 1979; Trevarthen & Aitken, 2001) and in chimpanzees (Bard, 2007; Bard et al., 2005; Myowa, 1996). One expression of intersubjectivity, neonatal imitation of facial actions, depends on face-to-face interaction, but other expressions, mutual engagement through tactile communication, for instance, are possible with constant physical contact (Papousek & Papousek, 1987; Plooij, 1979; Sorenson, 1979; Stack, 2001). With constant physical contact, the amount of face-to-face contact with mother is limited (see Bard et al., 2005 for further discussion of the interchange of modalities in mutual engagement; Keller, 2007). Note that new evidence is accumulating to support the conclusion that primary intersubjectivity may have a very long evolutionary history (Bard, 2009), as rhesus macaques infants exhibit imitation of facial actions very early in life (Ferrari, Paukner, Ruggiero, Darcey, Unbehagen, & Suomi, 2009) and mutual gaze with mothers (Ferrari, Paukner, Ionica, & Suomi, 2009). It is not surprising, for instance, that smiles in interaction with the examiner at 30 days in highly influenced by previous exposure to emotionally warm experiences with the socially responsive human examiners (Bard, 2005).
In the domain of neonatal motor performance, there was a species effect, as well as rearing and interaction effects. Notably, it was the item of muscle tonus that most strongly suggested species differences: all the chimpanzee groups were rated as more often hypertonic compared to the human group. It is also likely that by 30 days of age, with a larger sample of mother-reared chimpanzees, we would find that chimpanzee newborns have better head control than humans, supporting a species difference in this motoric measure as well (as suggested by Riesen & Kinder, 1952). The human group was mostly not different from mother-raised and from SW (at 2 days of age), and by 30 days, was mostly not different only from the SW nursery group. This is interesting because these two chimpanzee groups experienced the most vestibular stimulation (recall that the SW nursery chimpanzees were placed in swings during the day). The 4 hours of constant carrying in RC, however, did not effect any changes in basic motoric function within the neonatal period. Defensive movements although a good measure of controlled arm movements, is a reaction to a cloth covering the face, and therefore it is not surprising that the groups with 30 days of exposure to cloths (humans and all nursery chimpanzees) reacted significantly better than the one group without such exposure (mother chimpanzees). Therefore, evidence was found to support all three proposed explanations in comparing human and chimpanzee newborns in motor performance.
In the domain of Range of State, there was little evidence of maturational change in the first 30 days, although there were rearing effects. Among the 5 groups tested here, the Yerkes nursery chimpanzee groups were consistently the least aroused, but one of the other chimpanzee groups was consistently the most aroused. This may not be surprising as we know that although crying, for example, appears to have a biologically-based maturational component (peaks in crying appear around 6 weeks of life in humans across many cultures and in chimpanzees: Bard, 2000; Barr, Hopkins, & Green,. 2000), early experiences change the duration of crying (e.g., Barr & Gunnar, 2000). In the current study, we found evidence of species-rearing interactions (epigenetic effects) in all of the items and cluster in Range of State, indices of arousal and arousability of the newbord. The human group was most similar to the mother chimpanzees in the timing of when they cried (earlier in the exam than the other groups), and in crying more than 2 times (higher peak of excitement), which could be attributed to the fact that these infants were adapting to rearing with high levels of cradling contact. In irritability, the human group was most similar to all the nursery groups, suggesting an effect of exposure to humans and their artifacts as a potential explanation (note that this could be perhaps due to the western cultural practices of leaving infants on their own in cribs, cots, or incubators). The human group was intermediate between the SW nursery and all the other groups in number of state changes, which is not explainable by either exposure or cradling mechanisms. Therefore the exploration of arousal, Range of state system, reveals gene-environment interactions, only some of which are understandable by mechanisms of cradling contact or exposure to western human settings.
There are differences in the regulatory ability of the newborn chimpanzees, based on different amounts of exogenous support. By 30 days, the mother-reared chimpanzee group appeared to be the least well regulated, with the lowest scores on cuddliness, self-quieting ability, hand-to-mouth facility, and needing the most examiner interventions to quiet from a crying state. The 4 hours of differential experiences of ST and RC chimpanzees influenced self-quieting ability, and Regulation cluster scores. In both of these comparative analyses the effect is counterintuitive. The RC infants, given more enriched experiences, were less capable, and the mother-reared chimpanzee, given 24-hour support by their mothers, were the least capable in state regulation. The human group appeared most similar to the RC (in self-quieting and hand-to-mouth) and to the SW (in the cluster, cuddliness, and hand-to-mouth) groups in coping (Regulation of State), but was different from the ST group in all regulations scores. Although these are clearly epigenetic effects, neither exposure nor cradling explain this pattern of results. In the comparative analysis of regulation of arousal, it appears that when newborns can depend on exogenous stimuli to regulate their behavioral states, their own self-calming abilities are delayed relative to those of infants that are required to be reliant on self-calming. Caregivers facilitate infant’s ability to regulate, but the positive effects of exogenous control on regulation probably are more evident later in development (e.g., Suomi, 2004). Chimpanzee newborns, like human infants, are remarkably responsive to their early environment. The flexibility in regulatory outcomes as a result of differential socio-emotional experiences is further evidence of the biological and evolutionary basis of innate primary intersubjectivity in hominds (Bard, 1994b, 2007, 2009; Trevarthen & Aitken, 2001).
The counterpart to the arousal system is the regulation system. The NBAS assesses how well the newborn regulates their state, in utilizing his/her own behavioural means (e.g., hand-to-mouth as well as other self-calming techniques) and/or utilizing external means (e.g., caregiver’s interventions to console). It is obvious that infants’ level of arousal influences their regulation, and vice versa (e.g., if an infant is not very aroused then little regulation may be utilized because it is not required. Alternatively, if an infant is highly aroused then little regulation may be utilized because regulation may not be possible). It is within these two neurobehavioural systems that we might expect to find the most influence of environmental settings, for numerous reasons. Temperament has long been thought to be strongly genetically controlled. Yet it is within the realm of temperament that the environmental variables have been shown to directly effect gene expression (Kagan, 2003; Suomi, 2006). Recent research with human and nonhuman primates has revealed significant epigenetic effects (documented at the level of gene expression) in these systems or in their developmental sequalae (on emotional distress, maintenance of attentive behavioural state, and consolability in rhesus monkeys infants raised with peers versus with their mother:, and in the functioning of the HPA axis in human infants prenatally exposed to cocaine or not: Lester & Padbury, 2009). The as yet theoretical model of probabilistic epigenesis (PE) states that not only are there multiple levels of influence on outcomes (e.g., genetic activity, behaviour, and even culture) but that the influences are bidirectional (see also Jablonka & Lamb, 2007). “Thus, the PE model of developmental outcomes assumes that individuals of the same genotype can have different neural and behavioral outcomes according to the dissimilarity of their relevant life experiences, broadly construed (Gottlieb, 2007, p 4.). Although the neurobehavioural outcomes of chimpanzee newborns has not been linked with their genetic foundations, we suggest that this study of cross-species and cross-group comparisons of neurobehavioural integrity reflects the outcome of epigenesis.
CONCLUSIONS
The NBAS captured nuances in neurobehavioral integrity of chimpanzees, illuminated developmental changes with 30 days of postnatal experiences, and was useful for describing chimpanzee newborns in comparison with human newborns across multiple domains. In terms of describing chimpanzee newborns, we conclude that how they performed depended to a large degree on what they have experienced. Chimpanzee groups differed significantly in 23 of the 25 NBAS scores. The biggest differences appeared to be between the mother-raised chimpanzees and the 3 remaining groups of nursery-raised newborns. The rearing environments of the chimpanzee groups are known, which allows for informed conclusions about the influence of specific experiences on neurobehavioral organization. Different patterns of human-chimpanzee group differences were found across different domains of newborn neurobehavioral organization. The human group was similar to different chimpanzee groups in non-intuitive and complex ways (i.e., the human group was not distinct on 24 of 25 NBAS scores). Perhaps it is important to focus on the extent to which outcomes, even in the first 30 days of life, depended on peri-natal experiences in the chimpanzees. Similar flexibility in neurobehavioral outcomes can be found across different groups of human neonates (e.g., Chisholm, 1989; de Vries & Super, 1978; Nugent, et al., 1989; Tronick & Winn, 1992). The results of this study support the conclusion that epigenesis, the bidirectional interplay between genes and environment, rather than genes alone or environment alone, accounts for newborn neurobehavioral integrity in hominids.
Acknowledgements
Funding was provided by NIH grants RR-00165 (to Yerkes), RR-03591 (to RS), HD-21013 (to BML), HD-07105 (to KAB), NICHD Intramural Research Program funds (to SJS), and FP6 ICT-045169 from the European Commission (to KAB). The Yerkes National Primate Research Center of Emory University and the Southwest Foundation for Biomedical Research were fully accredited by the American Association of Laboratory Animal Care. Grateful appreciation is extended to Kelly McDonald, Carolyn Fort, Josh Schneider, Eugene Emory, Kathy Gardner, and many Emory University students for their assistance in conducting the research reported here, to Kathy Platzman and David Leavens for many constructive discussions about the meaningfulness of newborn chimpanzee behaviour, to two anonymous reviewers for helpful comments on the manuscript, and especially to Emese Nagy for inviting us to contribute to this Special Issue.
References
- Bard KA. Evolutionary roots of intuitive parenting: Maternal competence in chimpanzees. Early Development and Parenting. 1994a;3:19–28. [Google Scholar]
- Bard KA. Very early social learning: the effect of neonatal environment on chimpanzees’ social responsiveness. In: Roeder J, Thierry B, Anderson JR, Herrenschmidt N, editors. Current primatology: Vol III: Social development, learning, and behaviour. Universite Louis Pasteur; Strasbourg: 1994b. pp. 339–346. [Google Scholar]
- Bard KA. Emotional engagement: How chimpanzee minds develop. In: de Waal F, Ferrari P, editors. The Primate Mind: Built to connect with other minds. Harvard University Press; Cambridge, MA: (in press) To appear in. [Google Scholar]
- Bard KA. Responsive care: A behavioral intervention program for nursery-reared chimpanzees. The Jane Goodall Institute; Tuscon, AZ: 1996. [Google Scholar]
- Bard KA. Social-experiential contributions to imitation and emotion in chimpanzees. In: Braten S, editor. Intersubjective communication and emotion in early ontogeny: A source book. Cambridge University Press; Cambridge, UK: 1998a. pp. 208–227. [Google Scholar]
- Bard KA. Crying in infant primates: Insights into the development of crying in chimpanzees. In: Barr R, Hopkins B, Green J, editors. Crying as a sign, a symptom, and a signal: Developmental and clinical aspects of early crying behaviour. MacKeith Press; London: 2000. pp. 157–175. [Google Scholar]
- Bard KA. Primate parenting. In: Bornstein M, editor. Handbook of Parenting Vol. 2: Biology and ecology of parenting. 2nd Ed L. Erlbaum; Mahwah, NJ: 2002. pp. 99–140. [Google Scholar]
- Bard KA. Development of emotions in young chimpanzees (Pan troglodytes) Annals of the New York Academy of Sciences. 2003;1000:88–90. doi: 10.1196/annals.1280.018. [DOI] [PubMed] [Google Scholar]
- Bard KA. Emotions in chimpanzee infants: The value of a comparative developmental approach to understand the evolutionary bases of emotion. In: Nadel J, Muir D, editors. Emotional Development. Oxford University Press; Oxford, UK: 2005. [Google Scholar]
- Bard KA, Gardner KH. Influences on development in infant chimpanzees: Enculturation, temperament, and cognition. In: Russon AE, Bard KA, editors. Reaching into thought: The minds of the great apes. Cambridge University Press; Cambridge, England UK: 1996. pp. 235–256. [Google Scholar]
- Bard KA, Hopkins WD, Fort C. Lateral bias in infant chimpanzees (Pan troglodytes) Journal of Comparative Psychology. 1990;104:309–321. doi: 10.1037/0735-7036.104.4.309. [DOI] [PubMed] [Google Scholar]
- Bard KA, Myowa-Yamakoshi M, Tomonaga M, Tanaka M, Costall A, Matsuzawa T. Group differences in the mutual gaze of chimpanzees (Pan troglodytes) Developmental Psychology. 2005;41:616–624. doi: 10.1037/0012-1649.41.4.616. [DOI] [PubMed] [Google Scholar]
- Bard KA, Platzman KA, Lester BM, Suomi SJ. Orientation to social and nonsocial stimuli in neonatal chimpanzees and humans. Infant Behavior and Development. 1992;15:43–56. [Google Scholar]
- Bard KA, Platzman KA, Lester BM, Suomi SJ. Developpement neurobiologique et emotions chez les nouveau-nes chimpanzes et humains (Neurobehavioural integrity and emotions in chimpanzee and human neonates) Enfance. 2001;3:226–235. [Google Scholar]
- Bard KA, Bulbrook S, Maguire V, Veira Y, Hayes K, McDonald K. Developmental milestones in social skills and social ‘manners’ of young chimpanzees. (Under revision)
- Bard KA, Leavens DA. Socio-emotional factors underlying the development of joint attention in human and ape infants. In: Roska-Hardy L, Neumann-Held E, editors. Learning from animals? Psychology Press; London: 2009. [Google Scholar]
- Bard KA. Similarities and differences in the neonatal behavior of chimpanzee and human infants. In: Eder G, Kaiser E, King FA, editors. The role of the chimpanzee in research. Karger; Basel: 1994c. pp. 43–55. [Google Scholar]
- Bard KA. Neonatal neurobehavioral correlates of lateral bias and affect in infant chimpanzees (Pan troglodytes) Developmental Neuropsychology. 1998b;14:471–494. [Google Scholar]
- Bard KA. Neonatal imitation in chimpanzees (Pan troglodytes) tested with two paradigms. Animal Cognition. 2007;10:233–242. doi: 10.1007/s10071-006-0062-3. [DOI] [PubMed] [Google Scholar]
- Bard KA. Social cognition: Evolutionary history of emotional engagements with infants. Current Biology. 2009;19(20):R941–R943. doi: 10.1016/j.cub.2009.09.037. [DOI] [PubMed] [Google Scholar]
- Bard KA, Fragaszy DM, Visalberghi E. Acquisition and comprehension of a tool-using behavior by young chimpanzees: Effects of age and modeling. International Journal of Comparative Psychology. 1995;8:47–68. [Google Scholar]
- Bard KA, Street E, McCrary C, Boothe R. The development of visual acuity in infant chimpanzees. Infant Behavior and Development. 1995;18:225–232. [Google Scholar]
- Bard KA, Todd B, Bernier C, Love J, Leavens DA. Self-awareness in human and chimpanzee infants: What is measured and what is meant by the mirror-and-mark test? Infancy. 2006;9:185–213. [Google Scholar]
- Barr R, Hopkins B, Green J, editors. Crying as a sign, a symptom, and a signal: Developmental and clinical aspects of early crying behavior. MacKeith Press; London: 2000. [Google Scholar]
- Barr RG, Gunnar M. Colic: The ‘transient responsivity’ hypothesis. In: Barr R, Hopkins B, Green J, editors. Crying as a sign, a symptom, and a signal: Developmental and clinical aspects of early crying behavior. MacKeith Press. London: 2000. pp. 41–66. [Google Scholar]
- Bjorklund DF. Mother knows best: Epigenetic inheritance, maternal effects, and the evolution of human intelligence. Developmental Review. 2006;26(2):213–242. [Google Scholar]
- Boesch C. What makes us human (Homo sapiens)? The challenge of cognitive cross-species comparison. Journal of Comparative Psychology. 2007;121:227–240. doi: 10.1037/0735-7036.121.3.227. [DOI] [PubMed] [Google Scholar]
- Brazelton TB. Evidence of communication during neonatal behavioral assessment. In: Bullowa M, editor. Before speech: the beginnings of interpersonal communication. Cambridge University Press; New York: 1979. pp. 79–88. [Google Scholar]
- Brazelton TB, Nugent JK. Neonatal behavioral assessment scale. 3rd Ed Mac Keith Press; London: 1995. [Google Scholar]
- Brazelton TB. Clinics in Developmental Medicine. 2nd Ed No 88. Lippincott; Philadelphia: 1984. Neonatal behavioral assessment scale. [Google Scholar]
- Bullowa M. Introduction: Prelinguistic communication: A field for scientific study. In: Bullowa M, editor. Before Speech: The beginnings of interpersonal communication. Cambridge University Press; New York: 1979. [Google Scholar]
- Burghardt G. Darwin’s legacy to comparative psychology and ethology. American Psychologist. 2009;64:102–110. doi: 10.1037/a0013385. [DOI] [PubMed] [Google Scholar]
- Chisholm J. Biology, culture, and the development of temperament: A Navajo example. In: Nugent JK, Lester BM, Brazelton TB, editors. The cultural context of infancy. Ablex; New Jersey: 1989. [Google Scholar]
- Custance D, Whiten A, Bard KA. Can young chimpanzees (Pan troglodytes) imitate arbitrary actions? Hayes & Hayes (1952) revisited. Behaviour. 1995;132:837–859. [Google Scholar]
- de Vries M, Super CM. Contextual influences on the neonatal behavioral assessment scale and implications for its cross-cultural use. Monographs of the Society for Research in Child Development. 1978;43:92–101. [PubMed] [Google Scholar]
- de Waal FX. Chimpanzee politics: Power and sex among apes. Harper & Row; New York: 1982. [Google Scholar]
- Fagot J, Bard KA. Asymmetric grasping response in neonatal chimpanzees (Pan troglodytes) Infant Behavior and Development. 1995;18:253–255. [Google Scholar]
- Ferrari P, Paukner A, Ionica C, Suomi SJ. Reciprocal face-to-face communication between rhesus macaques mothers and their newborn infants. Current Biology. 2009;19(20):1768–1772. doi: 10.1016/j.cub.2009.08.055. DOI 10.1016/j.cub.2009.08.055. [DOI] [PMC free article] [PubMed] [Google Scholar]
- Ferrari P, Paukner A, Ruggiero A, Darcey L, Unbehagen S, Suomi SJ. Interindividual differences in neonatal imitation and the development of action chains in rhesus macaques. Child Development. 2009;80:1057–1068. doi: 10.1111/j.1467-8624.2009.01316.x. [DOI] [PMC free article] [PubMed] [Google Scholar]
- Field T, Greenberg R, Woodson R, Cohen D, Garcia R. A descriptive study of facial expressions during Brazelton Neonatal Behavior Assessments. Infant Mental Health Journal. 1984;5(2):61–71. [Google Scholar]
- Fouts R, Mills S. Next of kin: what my conversations with chimpanzees have taught be about intelligence, compassion, and being human. Michael Joseph Ltd; London, UK: 1997. [Google Scholar]
- Freedman DG. Genetic influences on development of behavior. In: Stoelinga GBA, Van der Werff Ten Bosch JJ, editors. Normal and abnormal development of brain and behavior. Leiden University Press; Leiden: 1971. pp. 208–233. [Google Scholar]
- Garcia Coll C, Bearer EL, Lerner RM. Nature and nurture: the complex interplay of genetic and environmental influences on human behavior and development. Erlbaum; Mahwah, NJ: 2004. [Google Scholar]
- Garcia Coll C, Sepkoski C, Lester BM. Cultural and biomedical correlates of neonatal behavior. Developmental Psychobiology. 1979;14:147–153. doi: 10.1002/dev.420140208. [DOI] [PubMed] [Google Scholar]
- Gardner BT, Gardner RA. Prelinguistic development of children and chimpanzees. Human Evolution. 1989;4:433–460. [Google Scholar]
- Goodall J. The Chimpanzees of Gombe: Patterns of Behavior. Harvard University Press; Cambridge: 1986. [Google Scholar]
- Gottlieb G. Probabilistic epigenesis. Developmental Science. 2007;10:1–11. doi: 10.1111/j.1467-7687.2007.00556.x. [DOI] [PubMed] [Google Scholar]
- Hallock MB, Worobey J. Cognitive development in chimpanzee infants . (Pan troglodytes) Journal of Human Evolution. 1984;13:441–447. [Google Scholar]
- Hallock MB, Worobey J, Self P. Behavioral development in chimpanzees (Pan troglodytes) and human newborns across the first month of life. International Journal of Behavioral Development. 1989;12:527–540. [Google Scholar]
- Hayes C. The ape in our house. Harper & Brothers; New York: NY: 1951. [Google Scholar]
- Henrich J, Heine SJ, Norenzayan A. The weirdest people in the world? Behavioral and Brain Sciences. 33(1) doi: 10.1017/S0140525X0999152X. (in press) [DOI] [PubMed] [Google Scholar]
- Herrmann E, Hernandez-Lloreda MV, Call J, Hare B, Tomasello M. The structure of individual differences in the cognitive abilities of children and chimpanzees. Psychological Science OnlineFirst. 2009 Dec 18; doi: 10.1177/0956797609356511. 2009 as doi:10.1177/0956797609356511. [DOI] [PubMed] [Google Scholar]
- Hopkins WD, Bard KA. Hemispheric specialization in infant chimpanzees (Pan troglodytes): Evidence for a relation with gender and arousal. Developmental Psychobiology. 1993;26:219–235. doi: 10.1002/dev.420260405. [DOI] [PubMed] [Google Scholar]
- Hopkins WD, Bard KA. Asymmetries in spontaneous head orientation in infant chimpanzees (Pan troglodytes) Behavioral Neuroscience. 1996;109:808–812. doi: 10.1037//0735-7044.109.4.808. [DOI] [PMC free article] [PubMed] [Google Scholar]
- Jablonka E, Lamb M. Bridging the gap: The developmental aspects of evolution. Behavioral and Brain Sciences. 2007;30:353–365. doi: 10.1017/S0140525X07002221. [DOI] [PubMed] [Google Scholar]
- Jacobsen CF, Jacobsen MM, Yoshioka JG. Development of an infant chimpanzee during her first year. Comparative Psychology Monographs. 1932;9:94. [Google Scholar]
- Johnson-Pynn J, Fragaszy DM, Cummins-Sebree S. Common territories in comparative and developmental psychology: Quest for shared means and meaning in behavioral investigations. International Journal of Comparative Psychology. 2003;16:1–27. [Google Scholar]
- Kagan J. Biology, context, and developmental inquiry. Annual Review of Psychology. 2003;54:1–23. doi: 10.1146/annurev.psych.54.101601.145240. [DOI] [PubMed] [Google Scholar]
- Keller H. Cultures of infancy. L. Erlbaum; Mahwah, NJ: 2007. [Google Scholar]
- Keller H, Lohaus A, Kuensemueller P, Abels M, Yovsi R, Voelker S, Jensen H, Papaligoura Z, Rosabal-Coto M, Kulks M, Mohite P. The bio-culture of parenting: Evidence from five cultural communities. Parenting: Science and Practice. 2004;4:25–20. [Google Scholar]
- Kellogg WN, Kellogg LA. The ape and the child: A study of early environmental influence upon early behavior. McGraw-Hill; New York: 1933. [Google Scholar]
- Kugiumutzakis G. Genesis and development of early infant mimesis to facial and vocal models. In: Nadel J, Butterworth G, editors. Imitation in Infancy. Cambridge University Press; Cambridge: 1999. pp. 36–59. [Google Scholar]
- Lavelli M, Fogel A. Developmental changes in mother-infant face-to-face communication. Developmental Psychology. 2002;38:288–305. doi: 10.1037//0012-1649.38.2.288. [DOI] [PubMed] [Google Scholar]
- Leavens DA, Hopkins WD, Bard KA. Understanding the point of chimpanzee pointing: Epigenesis and ecological validity. Current Directions in Psychological Science. 2005;14:185–189. doi: 10.1111/j.0963-7214.2005.00361.x. [DOI] [PMC free article] [PubMed] [Google Scholar]
- Leavens DA, Hopkins WD, Bard KA. The heterochronic origins of explicit reference. In: Zlatev J, Racine TP, Sinha C, Itkonen E, editors. The Shared Mind: Perspectives on Intersubjectivity. John Benjamins; Amsterdam: 2008. [Google Scholar]
- Leavens DA, Bard KA, Hopkins WD. BIZARRE chimpanzees do not represent “The Chimpanzee”. Commentary on target article by Heinrich, Heine & Norensayan, ‘The weirdest people in the world?’. Behavioral and Brain Sciences. 33(1) doi: 10.1017/S0140525X10000166. (in press) [DOI] [PubMed] [Google Scholar]
- Lester BM. Data analysis and prediction. In: Brazelton TB, editor. Neonatal Behavioral Assessment Scale. 2nd Ed Spastics International Medical Publications; London: 1984. pp. 85–96. [Google Scholar]
- Lester BM, Padbury JF. Third pathophysiology of prenatal cocaine exposure. Developmental Neuroscience. 2009;31:23–35. doi: 10.1159/000207491. [DOI] [PubMed] [Google Scholar]
- Lester BM, Anderson LT, Boukydis CFZ, Garcia Coll CT, Vohr B, Peucker M. Early detection of infants at risk for later handicap through acoustic cry analysis. In: Paul N, editor. Research in infant assessment. March of Dimes Birth Defects Foundation; New York: 1989. [PubMed] [Google Scholar]
- Mathieu M, Bergeron G. Piagetian assessment of cognitive development in chimpanzees (Pan troglodytes) In: Chiarelli B, Corruccini RS, editors. Primate behavior and socio-biology. Springer; Berlin: 1981. pp. 142–147. [Google Scholar]
- Meltzoff A, Moore MK. Imitation in newborn infants: Exploring the range of gestures imitated and the underlying mechanisms. Developmental Psychology. 1989;25:954–962. doi: 10.1037/0012-1649.25.6.954. [DOI] [PMC free article] [PubMed] [Google Scholar]
- Menzel E. Patterns of responsiveness in chimpanzees reared through infancy under conditions of environmental restriction. Psychologische Forschung. 1964a;27:337–365. doi: 10.1007/BF00421336. [DOI] [PubMed] [Google Scholar]
- Menzel E. Responsiveness to object-movement in young chimpanzees. Behaviour. 1964b;XXIV(1-2):147–160. doi: 10.1163/156853964x00247. [DOI] [PubMed] [Google Scholar]
- Myowa M. Imitation of facial gestures by an infant chimpanzee. Primates. 1996;37:207–213. [Google Scholar]
- Nugent JK, Lester BM, Brazelton TB. The cultural context of infancy. Ablex; New Jersey: 1989. [Google Scholar]
- Papousek H, Papousek M. Intuitive parenting: A dialectic counterpart to the infant’s integrative competence. In: Osofsky J, editor. Handbook of infant development. 2nd Ed Wiley; New York: 1987. pp. 669–720. [Google Scholar]
- Plooij F. How wild chimpanzee babies trigger the onset of mother-infant play - and what the mother makes of it. In: Bullowa M, editor. Before Speech: The beginning of interpersonal communication. Cambridge University Press; New York: 1979. pp. 223–243. [Google Scholar]
- Plooij F. The behavioral development of free-living chimpanzee babies and infants. Ablex; Norwood, NJ: 1984. [Google Scholar]
- Poti P, Spinozzi G. Early sensorimotor development in chimpanzees (Pan troglodytes) Journal of Comparative Psychology. 1994;108:93–103. doi: 10.1037/0735-7036.108.1.93. [DOI] [PubMed] [Google Scholar]
- Prechtl HFR, O’Brien MJ. Behavioural states of the full-term newborn: The emergence of a concept. In: Stratton P, editor. Psychobiological of the human newborn. Wiley; New York: 1982. pp. 53–73. [Google Scholar]
- Redshaw ME. A comparison of neonatal behavior and reflexes in the great apes. Journal of Human Evolution. 1989;18:191–200. [Google Scholar]
- Riesen AH, Kinder EF. Postural development of infant chimpanzees. Yale University Press; New Haven: 1952. [Google Scholar]
- Russell CL, Bard KA, Adamson LB. Social referencing by young chimpanzees (Pan troglodytes) Journal of Comparative Psychology. 1997;111(2):185–191. doi: 10.1037/0735-7036.111.2.185. [DOI] [PubMed] [Google Scholar]
- Sorenson ER. Early tactile communication and the patterns of human organization: a New Guinea case study. In: Bullowa M, editor. Before speech: the beginning of interpersonal communication. Cambridge University Press; New York: 1979. pp. 289–305. [Google Scholar]
- Stack DM. The salience of touch and physical contact during infancy: Unraveling some of the mysteries of the somesthetic sense. In: Bremner G, Fogel A, editors. Blackwell handbook of infant development. Blackwell; Oxford: 2001. pp. 351–378. [Google Scholar]
- Suomi SJ. How gene-environment interactions influcence emotional development in rhesus monkeys. In: Coll C. Garcia, Bearer EL, Lerner RM., editors. Nature and nurture: the complex interplay of genetic and environmental influences on human behavior and development. Erlbaum; Mahwah, NJ: 2004. pp. 35–51. [Google Scholar]
- Suomi SJ. Risk, resilience, and gene X environment interactions in rhesus monkeys. Annals of the New York Academy of Sciences. 2006;1094:52–62. doi: 10.1196/annals.1376.006. [DOI] [PubMed] [Google Scholar]
- Tomasello M, Carpenter M. The emergence of social cognition in three young chimpanzees. Monographs of the Society for Research in Child Development. 2005;70:1–136. doi: 10.1111/j.1540-5834.2005.00324.x. [DOI] [PubMed] [Google Scholar]
- Trevarthen C. Communication and cooperation in early infancy: A descriptive of primary intersubjectivity. In: Bullowa M, editor. Before Speech: The beginnings of interpersonal communication. Cambridge University Press; New York: 1979. [Google Scholar]
- Trevarthen C, Aitken KJ. Infant intersubjectivity: Research, theory, and clinical applications. Journal of Child Psychology and Psychiatry. 2001;42:3–48. [PubMed] [Google Scholar]
- Tronick EZ, Winn SA. The neurobehavioral organization of Efe (Pygmy) infants. Developmental and Behavioral Pediatrics. 1992;13:421–424. [PubMed] [Google Scholar]
- Tronick E, Morelli G, Winn S. Multiple caretaking of Efe (Pygmy) infants. American Anthropologist. 1987;89:96–106. [Google Scholar]
- van IJzendoorn MH, Bard KA, Bakermans-Kranenburg MJ, Ivan K. Enhancement of attachment and cognitive development of young nursery-reared chimpanzees in responsive versus standard care. Developmental Psychobiology. 2009;51:173–185. doi: 10.1002/dev.20356. [DOI] [PubMed] [Google Scholar]
- van Lawick-Goodall J. The behaviour of free-living chimpanzees of the Gombe Stream Nature reserve. Animal Behavior Monographs. 1968;1:161–311. [Google Scholar]
- Vauclair J, Bard KA. Development of manipulations with objects in ape and human infants. Journal of Human Evolution. 1983;12:631–645. [Google Scholar]
- Wrangham R. Catching fire: How cooking made us human. Basic Books; New York, NY: 2009. [Google Scholar]
- Wrangham R, McGrew W, de Waal F, Heltne P. Chimpanzee cultures. Harvard University Press; Cambridge, MA: 1994. [Google Scholar]
- Yerkes RM, Tomilin MI. Mother infant relations in chimpanzee. Journal of Comparative Psychology. 1935;20:321–359. [Google Scholar]
- Zeskind PS, Marshall TR. Temporal organization in neonatal arousal: Systems, Oscillations, and development. In: Weiss MJ, Zelazo P, editors. Newborn attention: Biological constraints and the influence of experience. Ablex Publishing; Westport, CT: 1991. pp. 22–62. [Google Scholar]
- Zlatev J, Racine T, Sinha C, Itkonen E, editors. The Shared Mind: Perspectives on Intersubjectivity. John Benjamins; Amsterdam: [Google Scholar]


