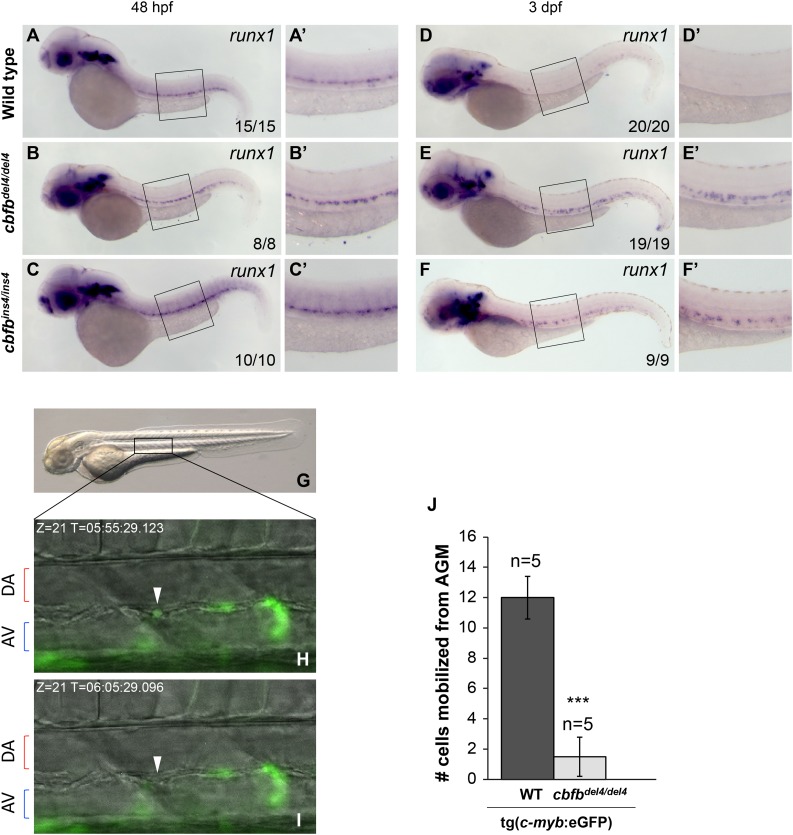
Figure 5.
HSCs are not released from the AGM in cbfb−/− embryos. (A-F′) Expression of the HSC marker runx1 in embryos at 48 hpf and 3 dpf, detected by WISH. At 48 hpf, the expression of runx1 was maintained in the AGM of cbfbdel4/del4 (B-B′) and cbfbins4/ins4 (C-C ′) embryos than in the WT embryos (A-A′). runx1 expression in hematopoietic regions, including both the AGM and the CHT regions, was downregulated in WT embryos at 3 dpf (D-D′). In cbfbdel4/del4 and cbfbins4/ins4 embryos, however, runx1 remained strongly expressed in the AGM (E-F′). Panels A′-F′ depict boxed regions in panels A-F. (G-J) Time-lapse imaging analysis of WT tg(c-myb:eGFP) and cbfbdel4/del4/tg(c-myb:eGFP) embryos between 48 and 63 hpf (5-minute intervals for 15 hours) to record the numbers of eGFP+ HSCs released from the AGM. Panel G is a lateral view of a 2-dpf embryo, with the boxed area indicating the region that was imaged by time lapse. Panels H and I show merged video captures of fluorescence and bright-field images (Z = 21) of the same region at different time points, displaying the egression of an eGFP+ cell (white arrowhead) in a WT tg(c-myb:eGFP) embryo (present in H but disappeared in I). AV, axial vein. (J) Bar graphs depicting average numbers of eGFP+ HSCs leaving the AGM in 5 embryos of each genotype. On average, 12 eGFP+ cells per embryo left the AGM and entered the circulation through the axial vein in WT tg(c-myb:eGFP) embryos during the recording period. In cbfbdel4/del4/tg(c-myb:eGFP) embryos, an average of 1 cell per embryo was released into circulation during the same recording period. ***P < .001 vs WT.

