

Key Points
Normally, engrafting HSCs reside and oscillate within confined bone marrow niches.
HSCs harvested from mice bearing acute infection are migratory and interact with larger niches.
Abstract
Hematopoietic stem cells (HSCs) maintain the turnover of mature blood cells during steady state and in response to systemic perturbations such as infections. Their function critically depends on complex signal exchanges with the bone marrow (BM) microenvironment in which they reside, but the cellular mechanisms involved in HSC-niche interactions and regulating HSC function in vivo remain elusive. We used a natural mouse parasite, Trichinella spiralis, and multipoint intravital time-lapse confocal microscopy of mouse calvarium BM to test whether HSC-niche interactions may change when hematopoiesis is perturbed. We find that steady-state HSCs stably engage confined niches in the BM whereas HSCs harvested during acute infection are motile and therefore interact with larger niches. These changes are accompanied by increased long-term repopulation ability and expression of CD44 and CXCR4. Administration of a CXCR4 antagonist affects the duration of HSC-niche interactions. These findings suggest that HSC-niche interactions may be modulated during infection.
Introduction
The function of hematopoietic stem cells (HSCs) depends on their interaction with complex niches within the bone marrow (BM)1,2 and must readily adjust to meet the changing needs for differentiated cells during situations of stress, such as the immune responses generated by infectious agents.3-5 The current working hypothesis is that changes in HSC-niche interactions may cause changes in HSC function and therefore a major challenge in the field is to understand the specific cellular behaviors (eg, duration of cell-cell/cell-matrix interactions) resulting in different HSC fates (quiescence vs proliferation, self-renewal vs differentiation). Direct visualization of HSCs in vivo and over time is the ideal approach to monitor the nature of the cellular interactions between individual stem cells and their niches and can be achieved by intravital microscopy of mouse calvarium BM.6,7
We studied a naturally occurring, nonlethal mouse model of infection initiated by ingestion of the parasitic nematode Trichinella spiralis, the infectious agent causing trichinosis. Ingested T spiralis reside for several days in the intestinal epithelium, where they mature, proliferate, and release larvae, which migrate into the circulatory system and invade the skeletal muscle, where they form cysts and survive for the life of the host.8 Migration of parasites causes extensive tissue damage and intense inflammation over the early phase of infection (weeks 1-3), which is ameliorated by the induction of regulatory cytokines during the chronic phase of the disease.9,10
Here we show that acute T spiralis infection affects hematopoietic dynamics and boosts HSC function. Using time-lapse intravital microscopy of transplanted HSCs, we show that acute infection is accompanied by changes in HSC-niche interactions. Steady-state HSCs reside within confined niches, whereas infection-exposed HSCs become migratory and interact with wider microenvironment regions.
Study design
For information on the study design, see supplemental Methods, available on the Blood Web site.
The UK Home Office PPL No. 70/7061 approves and covers all the animal work described here.
Results and discussion
T spiralis infection affects hematopoietic stem and progenitor cell frequencies and improves long-term engraftment
We examined hematopoietic stem and progenitor cell (HSPC) frequencies at 3, 14, and 28 days after ingestion of T spiralis larvae to capture the consequences of the early, intense inflammatory response and of the chronic infection phase, respectively (Figure 1A-C; supplemental Figures 1 and 2). Common lymphoid progenitors (CLPs) frequency increased already 3 days after ingestion (supplemental Figure 2C); at day 14, we observed increased CLP and granulocyte/monocyte progenitors (GMPs) but decreased common myeloid progenitors (CMP; Figure 1A), and by day 28 all frequencies were back to control values (supplemental Figure 2D). We observed the same trends in the total numbers of these cell populations (data not shown). These changes were reflected by increased numbers of colonies detected in CFU-C assays performed at day 14 after ingestion (Figure 1B) and by mild peripheral blood leukocytosis at later time points (supplemental Figure 3A-F).
Figure 1.
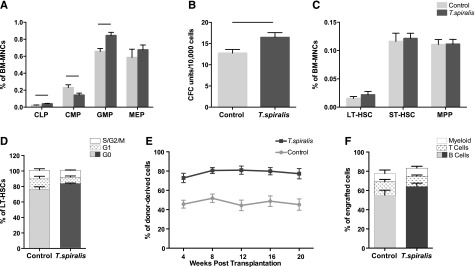
Effects of T spiralis infection on hematopoietic stem and progenitor cell populations. (A-C) BM mononuclear cells (BM MNCs) were harvested from control and T spiralis-infected mice 14 days after infection and labeled with cell surface markers for immunophenotypic analysis of (A) HPC and (C) HSC subpopulations and (B) plated into CFU-C assays. (A) CLP (LinlowKitintScaintCD127+); CMP (LinlowKit+Sca−CD34int/+CD16/32int); GMP (LinlowKit+Sca−CD34+CD16/32high); MEP, megakaryocyte-erythroid progenitors (LinlowKit+Sca−CD34−CD16/32low). n = 5 mice per group from 2 to 4 independent experiments. Represented are mean ± standard error (SE). Student t test P values: .013 (CLP), .046 (CMP), .0027 (GMP), and .441 (MEP). Black lines indicate P < .05. (B) CFU-C assay. n = 10 mice/group from 4 independent experiments. Student t test P value: .0125 (black line). (C) Frequency of LT-HSC (LinlowKit+Sca+CD34−Flk2−), ST-HSC (LinlowKit+Sca+CD34+Flk2−), and MPP (LinlowKit+Sca+CD34+Flk2+) in control and 2-week infected mice. Student t test P values: .35 (LT-HSC), .77 (ST-HSC), and .95 (MPP). (D) Cell cycle profile of LT-HSCs harvested from control and day 14-infected mice. No difference was observed in the proportion of cells in the G0, G1, and S/G2/M phases of the cell cycle. Error bars: SE. n = 5 mice/group. The same was observed in 2 additional independent experiments, each with n = 5 mice per group (data not shown). (E-F) 1:1 competitive transplantation of BM MNCs from control or 14-day infected mice (donor) and competitor BM MNCs into irradiated recipients. n = 17 to 18 mice from 2 independent experiments. (E) Peripheral blood reconstitution (mean ± SE), assessed by flow cytometry at 4, 8, 12, 16, and 20 weeks. The differential engraftment of control vs infected BM MNCs was tested using a linear mixed-effect model. The group effect (ie, difference between control and T spiralis) was statistically significant (P < .001); a time effect could not be detected in any of the 2 groups (P = .752). (F) Multilineage potential of the engrafted cells was assessed by measuring the mean proportion of donor-derived B, T, and myeloid cells in the recipients’ peripheral blood at week 20 after transplantation (P = .0721).
The frequency, total number, and cell cycle profile of more primitive HSPC populations remained unchanged (Figure 1D-E; supplemental Figure 2; data not shown). However, competitive repopulation assays showed that BM from infected animals had a consistent reconstitution advantage across all lineages both short and long term (Figure 1E-F; supplemental Figure 4). Analysis of spleens from control and infected animals revealed changes similar to those observed in the BM (supplemental Figure 3G-I) and consistent with previous observation that numbers of lymphoid and myeloid cells in secondary lymphoid organs peak at day 15 after ingestion, returning to normal by day 30.11
T spiralis infection therefore was an appropriate model to investigate whether a transient imbalance of hematopoiesis and an increase in HSC engraftment potential would correspond to changes in HSC-niche interactions.
In vivo longitudinal tracking uncovers differential niche engagement by steady-state and infection-exposed HSCs
Stable positioning of the anesthetized mouse for long periods allowed us to monitor HSC-niche interactions in mouse calvarium through longitudinal tracking of the cells of interest.12 DiD-labeled LT-HSCs (Linlow, c-Kit+, Sca1+, CD34−, Flk2− cells, herein referred to as HSCs) were injected into lethally irradiated recipient mice expressing GFP in osteoblastic cells (Col2.3GFP reporter mice13). The next day, we performed 5-hour time-lapse imaging of identified HSCs and surrounding osteoblasts. HSCs remained within confined regions throughout the observation period; however, they often exhibited oscillatory movements as large as 1/2 cell diameters (Figure 2A-C,G; supplemental Movie 1). Only 12% of all observed HSCs exhibited a net displacement greater than the distance covered by the oscillations (Figure 2I). The observation that HSCs often physically oscillate within their niches could reflect an as yet unappreciated level of complexity in the cross-talk between HSCs and niche cells. This may be mediated not only by secreted factors but also by dynamic cell-cell contacts, where the timing of each connection could further modulate any signals triggered.
Figure 2.

Time-lapse in vivo imaging of HSCs and exp.HSCs. (A-F) DiD-labeled (A-C) HSCs or (D-F) exp.HSCs were injected into col2.3GFP mice, and 16 to 20 hours later they were imaged every 5 minutes for 5 hours. Shown are representative xyz views of 3-dimensional stacks at the time points indicated, showing a stationary HSC and a migratory exp.HSC. Red, DiD-labeled HSC/exp.HSC; green, osteoblasts. Asterisks and dotted lines in E and F indicate exp.HSC position in previous frame shown and 2-dimensional displacement. Scale bars: 30 µm. (G-H) Gunplot 4.4 software was used to obtain a 3-dimensional representation of (G) HSC and (H) exp.HSC tracks, arranged to overlay the initial point of each track. (I) Proportion ± SE of migratory HSCs (n = 26 pooled from 3 mice containing 8, 8, and 10 cells each) and exp.HSCs (n = 46 pooled from 4 mice containing 7, 8, 13, and 18 cells each) observed (Fisher exact tests, P < .001). (J-L) Analysis of the characteristics of the movement of all HSCs and exp.HSCs observed (n = 26 and 46, respectively). Each dot represents 1 track and shows its (J) displacement (net distance covered from beginning to end of track), (K) mean speed, and (L) linear progression (ratio of displacement and total track length). Red lines indicate the median and the interquartile range (ie, intermediate 50% of values). One off-scale value for displacement (197.215 μm) and mean speed (4.005 μm/min), belonging to the same cell, was not included in the graphs, but was included in the statistical analysis. Differences in the median of these characteristics were tested using pairwise exact Mann-Whitney U-tests with the following results: (J) P = .39; (K) P = .56; and (L) P = .007. Additionally, differences in the variability of these characteristics were tested using the Brown-Forsyth F test: (J) P = .02; (K) P = .04; and (L) P = .02; P ≤ .05 for differences in proportions and medians (but not variance) is indicated by black lines.
We then imaged HSCs from mice at day 14 post ingestion (hereafter called exp.HSCs for infection-exposed HSCs). Surprisingly, 57% of exp.HSCs appeared migratory and moved within the field of view, generating distinct 3-dimensional tracks that occupied a volume of ∼4 times the size of that of HSC tracks (Figure 2D-F,H-I; supplemental Movie 2). A detailed comparative analysis of the tracks revealed that little or no total displacement was detected for HSCs, whereas a considerable proportion of exp.HSCs covered a wider range of net distances (Figure 2J). Despite the difference in total displacement, HSCs and exp.HSCs moved at a similar mean speed; however, the variability of individual speeds was significantly larger for exp.HSCs compared with HSCs (Figure 2K).
The major difference between HSCs and exp.HSCs was the shape of their tracks. Whereas HSCs generated confined circular tracks, exp.HSCs often alternated oscillatory movement and net migration, generating tracks similar to those of leukocytes scanning peripheral tissues (supplemental Movie 2).14 These observations were quantified by assessing the cells' linear progression (ratio between displacement and total track length, yielding a maximal value of 1 for objects moving in a straight line). HSC tracks had lower values (up to 0.35; median, 0.1) and exp.HSC tracks had higher values (up to 0.87; median, 0.21; Figure 2L). Notably, HSCs showed lower variability in individual linear progression values.
Exp.HSC migration accompanies increased CXCR4 and CD44 expression and is affected by AMD3100
Given the nature of our in vivo imaging assay, the molecular foundations underpinning migratory behavior must be acquired by exp.HSCs in situ, prior to harvest, transplantation, and imaging. We tested this hypothesis by examining the expression levels of molecules known to be involved in HSC adhesion and migration and observed that exp.HSCs had consistently increased levels of CD44 and CXCR4 (supplemental Figure 5A-D).
CXCR4 guides to and retains HSCs within the BM, and administration of its antagonist AMD3100 leads to HSPC mobilization into peripheral blood within 1 hour.15 Injection of AMD3100 during time-lapse imaging of exp.HSCs did not significantly change the parameters describing cell migration in the subsequent 3 hours (data not shown); however, the length of the tracks was reduced overall (supplemental Figure 5E). This was likely due to intra-/extravasation events, resulting in abrupt ending/beginning of tracks and reflecting increased cell trafficking stimulated by the drug.
Available reports indicate that chronic and lethal infections/cytokine stimulation lead to HSC exhaustion,16-19 acute infection to transient effects,20 and poly-IC administration to differential HSC localization.21 Here, we demonstrate that acute T spiralis infection changes the nature of HSC-niche interaction, which correlated with a marked engraftment advantage. The observed migratory behavior may be an essential component of the signaling cascade maintaining the HSC pool during a nonlethal infection.
Acknowledgments
The authors thank Nicola Ruivo, Rhiannon White, Catherine Simpson, Jane Srivastava, Dr Viktor Janzen, Samuel Jones, Dr Corinna Schnoeller, Dr Simon Schultz, and Dr Martin Spitaler for technical assistance and advice with mouse husbandry, T spiralis harvest and administration, flow cytometry, mouse holder production, and imaging and Dr Edwin Hawkins, Dr Peter O'Donovan, and Prof Robert Sinden for critical feedback on writing the manuscript.
This work was supported by Human Frontiers Science Program (grant RGP0051/2011 to C.L.C. and I.R.), Biotechnology and Biological Sciences Research Council, Cancer Research United Kingdom, Kay Kendal Leukaemia Fund (grants BB/I004033/1, C36195/A11831, KKL460 to C.L.C.) and Wellcome Trust (PhD fellowship to J.S.K.).
Footnotes
The online version of this article contains a data supplement.
The publication costs of this article were defrayed in part by page charge payment. Therefore, and solely to indicate this fact, this article is hereby marked “advertisement” in accordance with 18 USC section 1734.
Authorship
Contribution: N.M.R., M.K.S., N.S., A.K., J.S.K., K.G., M.E.S., I.R., and C.L.C. designed/performed experiments; analyzed data; and contributed to the writing of the manuscript.
Conflict-of-interest disclosure: The authors declare no competing financial interests.
Correspondence: Cristina Lo Celso, Sir Alexander Fleming Building, Imperial College London, South Kensington Campus, London, SW7 2AZ United Kingdom; e-mail: c.lo-celso@imperial.ac.uk.
References
- 1.Lo Celso C, Scadden DT. The haematopoietic stem cell niche at a glance. J Cell Sci. 2011;124(Pt 21):3529–3535. doi: 10.1242/jcs.074112. [DOI] [PMC free article] [PubMed] [Google Scholar]
- 2.Wang LD, Wagers AJ. Dynamic niches in the origination and differentiation of haematopoietic stem cells. Nat Rev Mol Cell Biol. 2011;12(10):643–655. doi: 10.1038/nrm3184. [DOI] [PMC free article] [PubMed] [Google Scholar]
- 3.King KY, Goodell MA. Inflammatory modulation of HSCs: viewing the HSC as a foundation for the immune response. Nat Rev Immunol. 2011;11(10):685–692. doi: 10.1038/nri3062. [DOI] [PMC free article] [PubMed] [Google Scholar]
- 4.Schuettpelz LG, Link DC. Regulation of hematopoietic stem cell activity by inflammation. Front Immunol. 2013;4:204. doi: 10.3389/fimmu.2013.00204. [DOI] [PMC free article] [PubMed] [Google Scholar]
- 5.Nakamura-Ishizu A, Suda T. Hematopoietic stem cell niche: an interplay among a repertoire of multiple functional niches. Biochim Biophys Acta. 2013;1830(2):2404–2409. doi: 10.1016/j.bbagen.2012.08.023. [DOI] [PubMed] [Google Scholar]
- 6.Lo Celso C, Fleming HE, Wu JW, et al. Live-animal tracking of individual haematopoietic stem/progenitor cells in their niche. Nature. 2009;457(7225):92–96. doi: 10.1038/nature07434. [DOI] [PMC free article] [PubMed] [Google Scholar]
- 7.Lo Celso C, Lin CP, Scadden DT. In vivo imaging of transplanted hematopoietic stem and progenitor cells in mouse calvarium bone marrow. Nat Protoc. 2011;6(1):1–14. doi: 10.1038/nprot.2010.168. [DOI] [PMC free article] [PubMed] [Google Scholar]
- 8.Despommier DD. Biology. In: Campbell WC, editor. Trichinella and Trichinosis. New York: Plenum Press; 1983. pp. 75–151. [Google Scholar]
- 9.Beiting DP, Gagliardo LF, Hesse M, Bliss SK, Meskill D, Appleton JA. Coordinated control of immunity to muscle stage Trichinella spiralis by IL-10, regulatory T cells, and TGF-beta. J Immunol. 2007;178(2):1039–1047. doi: 10.4049/jimmunol.178.2.1039. [DOI] [PubMed] [Google Scholar]
- 10.Bliss SK, Alcaraz A, Appleton JA. IL-10 prevents liver necrosis during murine infection with Trichinella spiralis. J Immunol. 2003;171(6):3142–3147. doi: 10.4049/jimmunol.171.6.3142. [DOI] [PubMed] [Google Scholar]
- 11.Furze RC, Selkirk ME. Comparative dynamics and phenotype of the murine immune response to Trichinella spiralis and Trichinella pseudospiralis. Parasite Immunol. 2005;27(5):181–188. doi: 10.1111/j.1365-3024.2005.00761.x. [DOI] [PubMed] [Google Scholar]
- 12.Scott MK, Lo Celso C. In-vivo 4-dimensional tracking of hematopoietic stem and progenitor cells in adult mouse calvarial bone marrow. J Vis Exp. 2014 doi: 10.3791/51683. (in press) [DOI] [PMC free article] [PubMed] [Google Scholar]
- 13.Kalajzic Z, Liu P, Kalajzic I, et al. Directing the expression of a green fluorescent protein transgene in differentiated osteoblasts: comparison between rat type I collagen and rat osteocalcin promoters. Bone. 2002;31(6):654–660. doi: 10.1016/s8756-3282(02)00912-2. [DOI] [PubMed] [Google Scholar]
- 14.Castellino F, Huang AY, Altan-Bonnet G, Stoll S, Scheinecker C, Germain RN. Chemokines enhance immunity by guiding naive CD8+ T cells to sites of CD4+ T cell-dendritic cell interaction. Nature. 2006;440(7086):890–895. doi: 10.1038/nature04651. [DOI] [PubMed] [Google Scholar]
- 15.Broxmeyer HE, Orschell CM, Clapp DW, et al. Rapid mobilization of murine and human hematopoietic stem and progenitor cells with AMD3100, a CXCR4 antagonist. J Exp Med. 2005;201(8):1307–1318. doi: 10.1084/jem.20041385. [DOI] [PMC free article] [PubMed] [Google Scholar]
- 16.Baldridge MT, King KY, Boles NC, Weksberg DC, Goodell MA. Quiescent haematopoietic stem cells are activated by IFN-gamma in response to chronic infection. Nature. 2010;465(7299):793–797. doi: 10.1038/nature09135. [DOI] [PMC free article] [PubMed] [Google Scholar]
- 17.Essers MA, Offner S, Blanco-Bose WE, et al. IFNalpha activates dormant haematopoietic stem cells in vivo. Nature. 2009;458(7240):904–908. doi: 10.1038/nature07815. [DOI] [PubMed] [Google Scholar]
- 18.Rodriguez S, Chora A, Goumnerov B, et al. Dysfunctional expansion of hematopoietic stem cells and block of myeloid differentiation in lethal sepsis. Blood. 2009;114(19):4064–4076. doi: 10.1182/blood-2009-04-214916. [DOI] [PMC free article] [PubMed] [Google Scholar]
- 19.Sato T, Onai N, Yoshihara H, Arai F, Suda T, Ohteki T. Interferon regulatory factor-2 protects quiescent hematopoietic stem cells from type I interferon-dependent exhaustion. Nat Med. 2009;15(6):696–700. doi: 10.1038/nm.1973. [DOI] [PubMed] [Google Scholar]
- 20.MacNamara KC, Jones M, Martin O, Winslow GM. Transient activation of hematopoietic stem and progenitor cells by IFNγ during acute bacterial infection. PLoS ONE. 2011;6(12):e28669. doi: 10.1371/journal.pone.0028669. [DOI] [PMC free article] [PubMed] [Google Scholar]
- 21.Kunisaki Y, Bruns I, Scheiermann C, et al. Arteriolar niches maintain haematopoietic stem cell quiescence. Nature. 2013;502(7473):637–643. doi: 10.1038/nature12612. [DOI] [PMC free article] [PubMed] [Google Scholar]