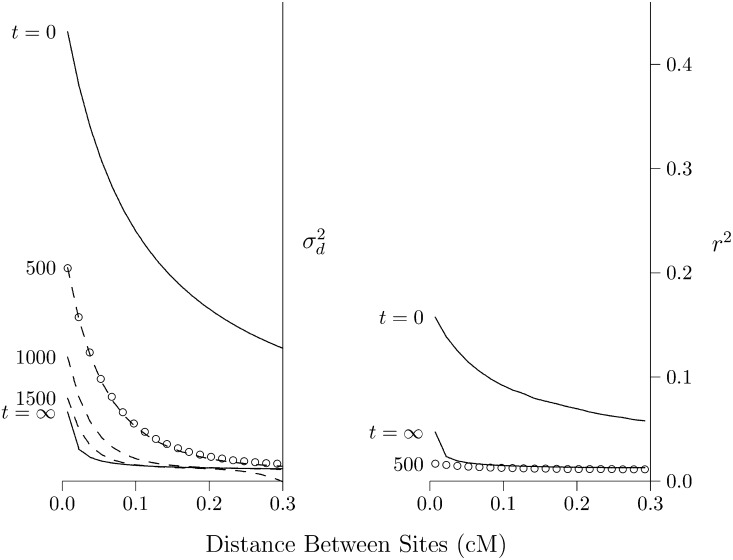
Figure 2.
Effect of population expansion on the LD curve. The population grew suddenly at time t = 0 from 2N = 103 to 105. Left panel: LD is measured by Solid lines show the predicted values at the initial equilibrium (t = 0) and at the eventual equilibrium (t = ∞). Dashed lines show a series of transient states that occur at various values of t, the number of generations since the expansion. These lines are all calculated using the method of Hill (1975). Open circles show values simulated using MACS for t = 500. Right panel: LD is measured by r2, and points and lines are based on computer simulation. Calculations assume that u = 1.48 × 10⁻⁸ per site per generation, and the haploid sample size is 100.

