

Abstract
Purpose
Women with anorexia nervosa (AN) have increased marrow fat despite severe depletion of body fat. Recent studies have suggested that marrow fat composition may serve as a biomarker for bone quality. The purpose of our study was to investigate marrow fat composition of the femur using proton MR spectroscopy (1H-MRS), and the relationship between measures of marrow fat composition and BMD and body composition in women with AN and normal-weight controls.
Materials and Methods
14 women with AN (29.5±1.9 years) and 12 age-matched normal-weight controls underwent 1H-MRS to determine total marrow fat content and marrow fat composition of the femoral diaphysis and soleus intramyocellular lipids und unsaturated muscle lipids. MRI was performed to quantify abdominal fat, thigh fat and muscle. Lumbar spine BMD, fat and lean mass were assessed by DXA.
Results
Subjects with AN had higher marrow fat content (p<0.05), but similar marrow fat composition (p >0.05) compared to normal-weight controls. There was an inverse association between marrow methylene protons, an estimate of fatty acid (FA) saturated bonds, and lumbar spine BMD (r= -0.52, p=0.008) independent of %ideal body weight (%IBW). Olefinic protons at 5.3 ppm, an estimate of FA unsaturated bonds, were inversely associated with body fat depots, independent of %IBW, and positively associated with soleus unsaturation (p≤0.05).
Conclusion
Women with AN have higher total femoral marrow fat but similar composition compared to normal-weight controls. The degree of marrow FA saturation correlates inversely with BMD, suggesting that saturated lipids may have negative effects on BMD. The degree of marrow FA unsaturation correlates positively with soleus unsaturation, suggesting that marrow fat composition may be influenced by the same factors as ectopic lipid composition in muscle.
Keywords: Anorexia nervosa, MR spectroscopy, bone marrow fat, marrow fat composition, saturated lipids
1. Introduction
Anorexia nervosa (AN) is an eating disorder associated with significant loss of weight and severe depletion of body fat (1). Paradoxically, subjects with AN have increased marrow fat (2, 3). Recent studies have demonstrated an important physiologic link between bone and fat (4-7). Within bone marrow, adipocytes and osteoblasts originate from a common marrow progenitor mesenchymal stem cell. Depending on molecular, chemical, and physical factors, these stem cells have the potential to differentiate along various cell lineages, including the osteoblast and adipocyte lineages (6-8). Studies indicate that increased differentiation along the adipocyte lineage may affect differentiation along the osteoblast lineage and vice versa (6, 7). However, during puberty, both marrow fat and osteoblast differentiation increase, suggesting that 1) there is not a direct reciprocal relationship between marrow fat and bone and 2) bone marrow fat may be necessary for osteoblasts to produce new bone (6). Furthermore, recent data suggest that marrow fat plays a role in systemic energy metabolism and functions as an endocrine organ (9).
Intramyocellular lipids (IMCL) are ectopic lipids deposited within skeletal muscle that have been implicated in the development of insulin resistance (10). We have previously demonstrated a positive correlation between lumbar marrow fat content and IMCL in normal-weight and obese women and men (11). These studies suggest that marrow fat may be influenced by the same factors as body fat and ectopic lipid deposits in muscle.
Advances in high-field magnetic resonance spectroscopy (MRS) allow the quantification of different marrow fat components, such as unsaturated and saturated lipids (12), which may serve as biomarkers of skeletal integrity (13, 14). Furthermore, lower marrow fat unsaturation was found in women with type 2 diabetes mellitus (T2DM) compared to healthy controls, suggesting that it may also serve as a biomarker for metabolic state, such as insulin resistance (15). While women with AN have higher marrow fat they also have markedly decreased body fat and are insulin sensitive and marrow composition has not been previously studied in this population.
The purpose of our study was to perform a qualitative assessment of marrow fat, specifically its degree of unsaturation, and to investigate its association with bone mineral density (BMD), body composition and IMCL content in young women with AN and age-matched normal weight controls.
2. Materials and Methods
The study was approved by the Partners Healthcare Institutional Review Board and complied with Health Insurance Portability and Accountability Act guidelines. Written informed consent was obtained from all subjects after the nature of the procedure had been fully explained.
Our study group comprised 26 premenopausal women aged 20-45 years, with a mean age 30.1±6.8 (SD) years who participated in clinical studies. These included 14 women with AN (mean age 29.5±7.1 years) and 12 normal-weight controls of similar age. All control subjects had regular menses and no history of amenorrhea or an eating disorder. Subjects with AN met DSM-IV weight and psychiatric criteria. AN subjects were referred to the study by eating disorder providers in the area and healthy controls were recruited from the community through advertisements. AN subjects were ambulatory and were studied as outpatients. Eight of the AN subjects were amenorrheic. None of the AN or controls subjects were on oral contraceptives or psychiatric medications at time of the study. Five AN subjects had a history of prior fracture (forearm: n=2, toe: n=1, coccyx: n=1, shoulder: n=1). Clinical characteristics and total marrow fat content have been reported in a subset of study subjects (3, 11, 16, 17), however no data on marrow composition and muscle fat have previously been reported.
Exclusion criteria included pregnancy, presence of a chronic disease known to affect BMD (other than AN), abnormal thyroid function tests, hypothalamic or pituitary disorders, diabetes mellitus, estrogen/oral contraceptive or glucocorticoid use. All subjects were examined at a single study visit at our General Clinical Research Center, where testing was performed. BMI was calculated using the following formula: weight (in kg)/height (in meters2) and % ideal body weight (%IBW) was calculated using 1983 Metropolitan Life Height and Weight tables (18).
2.1. 1H-MR spectroscopy of bone marrow
All subjects underwent 1H-MRS of the femoral diaphysis to determine lipid content using a 3.0T MR imaging system (Siemens Trio, Siemens Medical Systems, Erlangen, Germany). The femoral diaphysis was chosen as the site of marrow fat assessment, as extremity fractures are more common in AN than non-extremity fractures (19, 20). Subjects were positioned feet first in the magnet bore in the supine position and a body matrix phased array coil was positioned over the left thigh. A triplane localizer pulse sequence of the left thigh was obtained with echo time (TE) of 5 ms and repetition time (TR) of 15 ms, and slice thickness of 3mm. A voxel measuring 12 × 12 × 12 mm (1.7 mL) was positioned within the mid femoral diaphysis. Single-voxel 1H-MRS data was acquired using point-resolved spatially localized spectroscopy (PRESS) pulse sequence without water suppression with the following parameters: TE of 30 ms, TR of 3,000 ms, 8 acquisitions, 1024 data points, and receiver bandwidth of 2000 Hz. For each voxel placement, automated optimization of gradient shimming was performed. Coefficient of variation (CV) for femoral bone marrow fat quantification was 5% for total lipids and 5% for level of unsaturation, respectively. This was determined by scanning three volunteers twice within 10 days.
2.2. 1H-MR spectroscopy of soleus muscle
For 1H-MRS of soleus muscle, subjects were positioned feet first in the magnet bore in the supine position and the right calf was placed in an 18cm diameter commercially available transmit/receive quadrature extremity coil. A tri-plane gradient echo localizer pulse sequence with TR of 15 ms and TE of 5 ms was obtained. Axial T1-weighted images (TR, 400 ms; TE, 11 ms; slice thickness, 4 mm; inter-slice gap, 1 mm; matrix, 512; NEX, 1; FOV 22 cm) of the proximal two-thirds of the calf were prescribed. A voxel measuring 15 × 15 × 15 mm3 (3.4 mL) was placed on the axial T1-weighted slice with largest muscle cross-sectional area of soleus muscle, avoiding visible interstitial tissue, fat or vessels. Single-voxel 1H-MRS data was acquired using a PRESS pulse sequence with a TR of 3,000 ms, TE of 30 ms, 64 acquisitions, 1024 data points, and receiver bandwidth of 1000 Hz. Frequency selective water signal suppression was used for metabolite acquisition and unsuppressed water spectra of the same voxel were obtained for each scan with the same parameters as the metabolite acquisition except for the use of 8 acquisitions. For each voxel placement, automated optimization of gradient shimming, water suppression, and transmit-receive gain were performed, followed by manual adjustment of gradient shimming targeting water linewidths of 12–14 Hz.
2.3. 1H-MR Spectroscopy Data Analysis
Fitting of all 1H-MRS data was performed using LCModel (version 6.3-0K) (21). Data were transferred from the scanner to a Linux workstation and metabolite quantification was performed using eddy current correction and water scaling. A customized fitting algorithm for bone marrow analysis provided estimates for 5 lipid peaks: olefinic protons at 5.3 ppm (-CH=CH-), an estimate of fatty acids (FA) unsaturated bonds; methylene protons at 1.3 ppm [(-CH2-)n], an estimate of FA saturated bonds; and residual lipids: allylic methylene protons at 2.0 ppm (-CH=CH-CH2-); methyl protons at 0.9 ppm (-CH3); and methylene protons β to carbonyl at 1.6 ppm (-CH2-O-CO-CH2-CH2-). Total marrow lipid content was determined by combining all lipid peaks (0.9, 1.3, 1.6, 2.0, and 5.3 ppm). Unsaturation index (UI) was determined by obtaining a ratio between the olefinic resonance at 5.3 ppm and total lipid content as previously described (13, 14). Lipid resonances were scaled to unsuppressed water peak (4.7 ppm) and expressed in lipid-to-water ratios (l/w).
For soleus muscle, IMCL (1.3 ppm) and EMCL (1.5 ppm) methylene protons [(-CH2-)n] and combined total muscle lipids (0.9, 1.1, 1.3,1.5, 2.1, 2.3, and 5.3 ppm) were automatically scaled to unsuppressed water resonance (4.7 ppm) and expressed as lipid-to-water ratio. Unsaturation index was determined by dividing the olefinic protons at 5.3 ppm (-CH=CH-) by total muscle lipids.
2.4. MRI for body composition
Single axial MR imaging slice through the abdomen at the level of L4 and a single slice through the mid thigh were obtained (Siemens Trio, 3T, Siemens Medical Systems, Erlangen, Germany). A tri-plane gradient echo localizer pulse sequence with echo time (TE) of 1.6 ms and repetition time (TR) of 49.0 ms was performed. For the abdomen, an axial T1-weighted image (fast spin-echo pulse sequence, 10 mm slice thickness, 40 cm field-of-view, TR 300 ms, TE 12 ms, echo-train of 4, 512 × 512 matrix, 1 NEX) was prescribed through the mid-portion of L4. A single slice through the mid-thigh was also performed, equidistant to femoral head and medial femoral condyle. Visceral and subcutaneous fat cross sectional areas (CSA), as well as mid-thigh subcutaneous fat and muscle CSA were determined based on offline analysis of tracings obtained utilizing commercial software (VITRAK, Merge/eFilm, WI).
2.5. Dual-energy X-ray-absorptiometry
DXA was used to assess BMD of the lumbar spine and hip (in 22 subjects) and total fat and fat-free mass (Hologic QDR 4500, Hologic Inc., Waltham, MA). Coefficients of variation of DXA have been reported as <1% (22).
2.6. Statistical Analysis
Statistical analysis was performed using JMP (SAS Institute, Carey, NC) software. Variables were tested for normality of distribution using the Shapiro-Wilk test. Variables that were not normally distributed were log transformed. Linear regression analysis was performed. Multivariate standard least squares regression modeling was used to control for %IBW. AN and normal weight groups were compared using Student's t-test. Mean and standard deviation (SD) are reported. P ≤ 0.05 was used to denote significance and p ≤ 0.1 was used to denote a trend.
3. Results
3.1. Clinical characteristics
Clinical characteristics are summarized in Table 1. Per study design, subjects with AN had lower %IBW, BMI, fat mass (total and abdominal), muscle, and lean mass compared to normal-weight controls. Women with AN had lower soleus IMCL but a similar soleus unsaturation index (UI) compared to normal weight controls. Women with AN also had lower lumbar spine BMD (Table 1).
Table 1.
Clinical characteristics of AN and normal weight control group. Data presented as mean±SD.
| Variable | Anorexia nervosa (n=14) | Controls (n=12) | p |
|---|---|---|---|
| Age (years) | 29.5±7.1 | 30.8±6.6 | 0.65 |
| Ideal body weight (%) | 79.5±4.5 | 98.2±6.7 | <0.0001 |
| BMI (kg/m2) | 17.7±1.0 | 22.1 ±1.7 | <0.0001 |
| Duration of disease (months) | 78.2± 77.2 | - | - |
| Total body fat (kg) | 9.7±2.5 | 17.8±4.4 | <0.0001 |
| Total fat-free mass (kg) | 37.8±3.0 | 43.2±4.5 | 0.001 |
| VAT CSA (cm2) | 24.2±6.4 | 45.0±18.7 | 0.001 |
| Abdominal SAT CSA (cm2) | 82.2±28.6 | 166.7±67.5 | 0.0005 |
| Thigh SAT CSA (cm2) | 46.4±16.3 | 91.8±28.0 | <0.0001 |
| Thigh muscle CSA (cm2) | 92.7±13.0 | 111.0±14.8 | 0.003 |
| IMCL-SOL (l/w) | 0.01±0.006 | 0.02±0.006 | 0.09 |
| SOL unsaturation index | 0.014±0.009 | 0.018±0.007 | 0.2 |
| Lumbar spine BMD (g/cm2) | 0.66±0.08 | 0.82±0.09 | 0.0001 |
| Lumbar spine t-score | −1.86±0.94 | −0.03±1.1 | <0.0001 |
| Lumbar spine z-score | −1.6±0.90 | 0.31±1.2 | 0.0001 |
| Total femoral marrow fat (l/w) | 10.8±7.0 | 5.1±3.7 | 0.02 |
| Marrow unsaturated lipids* (l/w) | 0.61±0.40 | 0.30±0.18 | 0.02 |
| Marrow saturated lipids**(l/w) | 7.6±5.1 | 3.6±2.7 | 0.02 |
| Marrow unsaturation index | 0.057±0.02 | 0.063±0.02 | 0.6 |
BMI: body mass index CSA: cross sectional area VAT: visceral adipose tissue SAT: subcutaneous adipose tissue TAT: total adipose tissue IMCL-SOL: intramyocellular lipids of soleus muscle L/w: lipid to water ratio BMD: bone mineral density
olefinic protons at 5.3 ppm, an estimate of fatty acid unsaturated bonds
methylene protons at 1.3 ppm, an estimate of fatty acid saturated bonds
3.2. Bone marrow fat composition
There was a significant difference in femoral diaphysis marrow fat content between the AN and normal-weight group. Subjects with AN had significantly higher total lipids, olefinic protons at 5.3 ppm (an estimate for FA unsaturated bonds) and methylene protons at 1.3 ppm (an estimate of FA saturated bonds). However, when adjusted for total lipid content, there was no significant difference in marrow UI between groups (Table 1). AN subjects with and without fractures had no significant difference in total marrow fat content (10.3±6.4 vs 11.1±7.7 l/w, p=0.80), olefinic protons at 5.3 ppm (0.62±0.38 vs 0.60±0.44 l/w, p=0.93) or marrow methylene protons at 1.3 ppm (7.1±4.3 vs 7.9±5.7 l/w, p=0.78).
3.3. Association between bone marrow fat composition and BMD
There were inverse associations between lumbar spine BMD and total femoral fat content (r= -0.49, p=0.01), marrow methylene protons at 1.3 ppm (r= -0.52, p= 0.008) and olefinic protons at 5.3 ppm (r= -0.47, p= 0.02). After controlling for %IBW only the negative association between BMD and methylene protons at 1.3 ppm, an estimate of degree of FA saturation bonds remained significant (p= 0.04) (Figure 1). Hip BMD correlated negatively with total femoral fat content (r= -0.45, p= 0.04), marrow methylene protons at 1.3 ppm (r= -0.48, p=0.02) and olefinic protons at 5.3 ppm (r= -0.44, p= 0.04). After controlling for %IBW the associations between hip BMD and marrow methylene protons at 1.3 ppm became a trend (p=0.10) and the association between hip BMD and total marrow fat and olefinic protons at 5.3 ppm lost significance (p= 0.30 and p= 0.20, respectively). Associations between marrow fat composition and BMD for the AN and normal weight groups are provided in Table 2.
Figure 1.
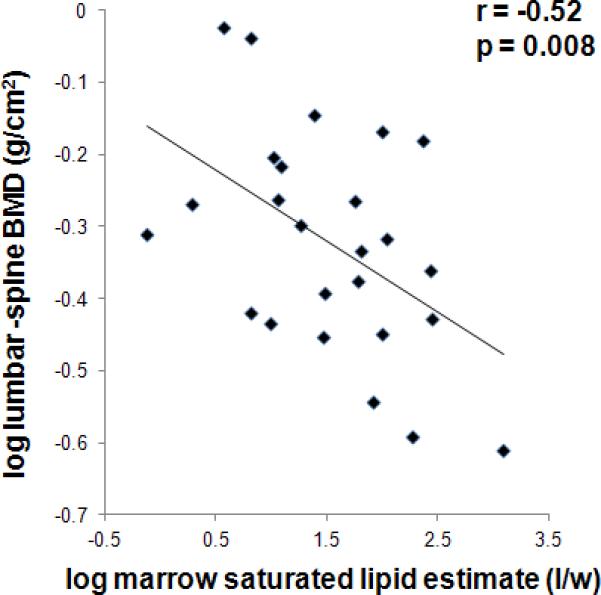
Regression analysis between lumbar spine bone mineral density (BMD) and estimate of marrow fatty acid (FA) saturation expressed as lipid to water ratio (l/w). There is an inverse association between lumbar spine BMD and marrow FA saturated lipid estimate.
Table 2.
Regression analysis between marrow fat composition and BMD and body fat depots in anorexia nervosa and healthy controls
| Total marrow fat |
Unsaturated FA (5.3ppm) |
Saturated FA (1.3ppm) |
||||
|---|---|---|---|---|---|---|
| r | p | r | p | r | p | |
| L-spine BMD | ||||||
| AN | −0.33 | 0.25 | −0.40 | 0.16 | −0.44 | 0.12 |
| Controls | −0.06 | 0.86 | −0.003 | 1.00 | −0.12 | 0.73 |
| Fat mass | ||||||
| AN | −0.09 | 0.74 | −0.36 | 0.20 | −0.08 | 0.80 |
| Controls | −0.55 | 0.07 | −0.55 | 0.06 | −0.48 | 0.11 |
| VAT | ||||||
| AN | −0.16 | 0.60 | −0.28 | 0.36 | −0.13 | 0.68 |
| Controls | −0.28 | 0.40 | −0.20 | 0.55 | −0.27 | 0.42 |
| Abd. SAT | ||||||
| AN | −0.16 | 0.61 | −0.22 | 0.48 | −0.03 | 0.92 |
| Controls | −0.63 | 0.04 | −0.63 | 0.04 | −0.62 | 0.04 |
| Thigh SAT | ||||||
| AN | −0.15 | 0.62 | −0.46 | 0.10 | −0.13 | 0.66 |
| Controls | −0.20 | 0.56 | −0.20 | 0.56 | −0.38 | 0.25 |
FA: fatty acids L-spine: lumbar spine BMD: bone mineral density VAT: visceral adipose tissue Abd. : abdominal SAT: subcutaneous adipose tissue
3.4. Relationship between bone marrow fat composition and body composition
Olefinic protons at 5.3 ppm were inversely associated with total fat mass (r= -0.59, p=0.001), abdominal and thigh SAT (r= -0.57, p= 0.003 and r= -0.51, p=0.009, respectively) and VAT (r= -0.46, p=0.02). The associations remained significant after controlling for %IBW (total fat mass: p=0.05, thigh SAT: p=0.04) or became a trend (abdominal SAT: p=0.06), while the association with VAT lost significance (p=0.3).
Total femoral lipid content was inversely associated with total fat mass (r= -0.60, p= 0.001) and VAT (r= -0.52, p =0.009). Total femoral lipid content and methylene protons at 1.3 ppm were inversely associated with abdominal SAT (r= -0.66, p=0.0005 and r= -0.49, p=0.01, respectively) and thigh SAT (r= -0.57, p= 0.003 and r= -0.44, p=0.03, respectively). The associations were no longer significant after controlling for %IBW (p= 0.10 to 0.30). Associations between marrow fat composition and body fat depots for the AN and normal weight groups are provided in Table 2. There were no associations between measures of marrow composition and lean mass (p=0.30 to 0.80).
Femoral marrow UI was positively associated with soleus UI (r= 0.42, p=0.05) (Figure 2).
Figure 2.

Regression analysis between soleus muscle unsaturation index and marrow unsaturation index. There is a positive correlation between unsaturation index of soleus muscle and of marrow.
Within the AN group, there was no association between disease duration or length of amenorrhea and BMD, marrow fat or body composition (p=0.2 to 0.9).
Discussion
Our study shows that women with AN have higher total marrow fat content but similar marrow fat composition as assessed by 1H-MRS compared to normal weight controls. However, of possible significance, methylene protons at 1.3 ppm, a marker for FA saturated bonds, were inversely associated with lumbar spine BMD, while olefinic protons at 5.3 ppm, a marker of FA unsaturated bonds, did not correlate with BMD. On the other hand, FA unsaturation was inversely associated with body fat, suggesting that qualitative features of marrow fat lipids may have different effects on BMD and body composition or may be influenced by the same factors as bone and body composition.
Recent studies have shown an important physiologic link between bone and fat. Both bone and fat cells arise from a common mesenchymal precursor stem cell within bone marrow, capable of differentiation into osteoblasts and adipocytes (6, 7, 23) and elevated bone marrow fat content has been shown to be an indicator of bone fragility (24). While most studies on marrow fat have focused on obesity, T2DM or postmenopausal osteoporosis (13-15, 25, 26), our study focused on young women with anorexia nervosa (AN) and age-matched healthy normal weight controls.
AN is a primary psychiatric disorder characterized by low body weight due to a state of nutritional deprivation (27-29). AN is associated with multiple medical co-morbidities including significant and often permanent bone loss despite recovery leading to increased fracture risk (30, 31). Extremity fractures are more common in AN than non-extremity fractures (19, 20), thus we focused our evaluation of marrow fat content on the femoral diaphysis. Given the significant bone loss and increased fracture risk in AN, understanding the mechanisms of bone loss is of particular importance in this population.
We have previously demonstrated elevated marrow fat content in patients with AN compared to age-matched normal-weight controls despite markedly reduced body fat and an inverse association between marrow fat and BMD in this population (3). However, no studies have investigated composition of bone marrow in AN and its relation to BMD and body composition.
The composition of marrow fat assessed by 1H-MRS has recently been proposed as a novel biomarker of skeletal fragility (13). Despite similar total marrow fat content, diabetic patients with fragility fractures had higher saturated lipids compared to diabetic patients without fractures(13). In a study in women with normal BMD, osteopenia and osteoporosis, Yeung et al. found increased total and decreased unsaturated lipids in osteopenia and osteoporosis (14). Furthermore, high consumption of saturated FA has been linked to increased hip fracture risk (32) while an inverse association between intake of polyunsaturated FA (PUFA) and hip fracture risk has been shown (33). These studies suggest that elevated saturated lipids may play a role in osteoporosis and skeletal fragility. In our study there was an inverse association between methylene protons at 1.3 ppm, which reflect FA saturated bonds, and BMD, independent of %IBW suggesting negative effects of saturated lipids on bone density.
Studies in obesity and T2DM have shown positive correlations between total marrow fat content and abdominal adiposity (15, 25, 26). In our study, FA unsaturation was inversely associated with total fat mass, abdominal and thigh fat depots, independent of %IBW.
Furthermore, we found a positive correlation between the marrow UI and muscle UI while there was no association between marrow fat content and muscle area or lean mass. Accumulation of ectopic fat in skeletal muscle (intramycocellular lipids, IMCL) has been strongly implicated in the development of insulin resistance and the metabolic syndrome (34-38). We have previously demonstrated a positive association between IMCL and marrow fat using 1H-MRS in obese and normal weight adults (11). However, no studies on IMCL have been performed in AN. Subjects with AN are insulin sensitive, and consistent with this, we found lower IMCL of soleus muscle (trend) in women with AN compared to normal weight controls.
Advances in MRS allow not only the quantification of saturated and unsaturated lipids within bone marrow but also within skeletal muscle. Biochemical studies have emphasized the roles of saturated and unsaturated FA in obesity and T2DM (39-42). High levels of saturated FA and low levels of PUFAs are found in insulin resistance and metabolic syndrome (39). We were able to not only quantify unsaturated lipids within bone marrow but also within soleus muscle and found no significant difference in unsaturation index of soleus muscle and marrow between the AN and normal weight group, suggesting that both muscle and marrow composition is not significantly different between AN and normal weight controls. Furthermore, our study suggests that marrow fat composition may be influenced by the same factors as ectopic lipid composition.
Our study has several limitations. First, the cross sectional design limits our ability to determine causality. Second, we only studied young women with AN and women of normal weight and our results cannot be extrapolated to men, obesity or postmenopausal women. Third, 1H-MRS is unable to resolve individual fatty acids and several additional lipid resonances, and their contributions were not accounted for. While the methylene signal at 1.3 ppm was used as a marker for FA saturation, this signal is not exclusive to saturated fatty acids. Therefore, although several lipid species contribute to this signal, we believe it reflects the overall degree of lipid saturation, which is supported by a prior study (13). Fourth, BMD was assessed at the lumbar spine and hip while marrow fat was assessed at the mid femoral diaphysis, thus site specific differences cannot be determined. Fifth, we did not assess serum markers of bone turnover or serum adipokines. A strength of our study is the detailed assessment of marrow fat components and IMCL as well as unsaturation indices at 3 Tesla. Furthermore, this is the first study that examines detailed measures of marrow composition and its association with BMD and body composition in AN, providing more insights into the bone-fat connection and the function of marrow fat.
In conclusion, women with AN have higher total marrow fat content, estimates of FA unsaturation and saturation but similar marrow fat composition compared to normal-weight controls. Subjects with AN also have lower IMCL but similar composition of muscle fat compared to normal-weight controls, suggesting that marrow fat composition may be influenced by the same factors as ectopic lipid composition in muscle. Furthermore, saturated FA estimates were inversely associated with BMD, suggesting that saturated lipids may have negative effects on BMD.
Highlights.
Women with AN have higher total femoral marrow fat but similar composition compared to normal-weight controls
Inverse correlation of marrow fat saturation and BMD suggests that saturated lipids may have negative effects on BMD.
Marrow fat and muscle ectopic lipid composition may be influenced by similar factors.
Acknowledgments
This study was supported through the following grants: R24 DK084970, R01 HL-077674, R01 DK052625, M01 RR01066, UL1 RR025758, and K23 RR-23090 The authors have no conflict of interest to declare.
Footnotes
Publisher's Disclaimer: This is a PDF file of an unedited manuscript that has been accepted for publication. As a service to our customers we are providing this early version of the manuscript. The manuscript will undergo copyediting, typesetting, and review of the resulting proof before it is published in its final citable form. Please note that during the production process errors may be discovered which could affect the content, and all legal disclaimers that apply to the journal pertain.
Bibliography
- 1.Misra M, Soyka LA, Miller KK, Grinspoon S, Levitsky LL, Klibanski A. Regional body composition in adolescents with anorexia nervosa and changes with weight recovery. Am J Clin Nutr. 2003;77:1361–1367. doi: 10.1093/ajcn/77.6.1361. [DOI] [PubMed] [Google Scholar]
- 2.Abella E, Feliu E, Granada I, Milla F, Oriol A, Ribera JM, Sanchez-Planell L, Berga LI, Reverter JC, Rozman C. Bone marrow changes in anorexia nervosa are correlated with the amount of weight loss and not with other clinical findings. Am J Clin Pathol. 2002;118:582–588. doi: 10.1309/2Y7X-YDXK-006B-XLT2. [DOI] [PubMed] [Google Scholar]
- 3.Bredella MA, Fazeli PK, Miller KK, Misra M, Torriani M, Thomas BJ, Ghomi RH, Rosen CJ, Klibanski A. Increased bone marrow fat in anorexia nervosa. The Journal of clinical endocrinology and metabolism. 2009;94:2129–2136. doi: 10.1210/jc.2008-2532. [DOI] [PMC free article] [PubMed] [Google Scholar]
- 4.Gimble JM, Zvonic S, Floyd ZE, Kassem M, Nuttall ME. Playing with bone and fat. J Cell Biochem. 2006;98:251–266. doi: 10.1002/jcb.20777. [DOI] [PubMed] [Google Scholar]
- 5.Hardouin P, Pansini V, Cortet B. Bone marrow fat. Joint, bone, spine : revue du rhumatisme. 2014 doi: 10.1016/j.jbspin.2014.02.013. [DOI] [PubMed] [Google Scholar]
- 6.Rosen CJ, Ackert-Bicknell C, Rodriguez JP, Pino AM. Marrow fat and the bone microenvironment: developmental, functional, and pathological implications. Crit Rev Eukaryot Gene Expr. 2009;19:109–124. doi: 10.1615/critreveukargeneexpr.v19.i2.20. [DOI] [PMC free article] [PubMed] [Google Scholar]
- 7.Rosen CJ, Bouxsein ML. Mechanisms of disease: is osteoporosis the obesity of bone? Nat Clin Pract Rheumatol. 2006;2:35–43. doi: 10.1038/ncprheum0070. [DOI] [PubMed] [Google Scholar]
- 8.Abdallah BM, Ding M, Jensen CH, Ditzel N, Flyvbjerg A, Jensen TG, Dagnaes-Hansen F, Gasser JA, Kassem M. Dlk1/FA1 is a novel endocrine regulator of bone and fat mass and its serum level is modulated by growth hormone. Endocrinology. 2007;148:3111–3121. doi: 10.1210/en.2007-0171. [DOI] [PubMed] [Google Scholar]
- 9.Lecka-Czernik B. Marrow fat metabolism is linked to the systemic energy metabolism. Bone. 2012;50:534–539. doi: 10.1016/j.bone.2011.06.032. [DOI] [PMC free article] [PubMed] [Google Scholar]
- 10.Shulman GI. Cellular mechanisms of insulin resistance. J Clin Invest. 2000;106:171–176. doi: 10.1172/JCI10583. [DOI] [PMC free article] [PubMed] [Google Scholar]
- 11.Bredella MA, Gill CM, Gerweck AV, Landa MG, Kumar V, Daley SM, Torriani M, Miller KK. Ectopic and serum lipid levels are positively associated with bone marrow fat in obesity. Radiology. 2013;269:534–541. doi: 10.1148/radiol.13130375. [DOI] [PMC free article] [PubMed] [Google Scholar]
- 12.Ren J, Dimitrov I, Sherry AD, Malloy CR. Composition of adipose tissue and marrow fat in humans by 1H NMR at 7 Tesla. J Lipid Res. 2008;49:2055–2062. doi: 10.1194/jlr.D800010-JLR200. [DOI] [PMC free article] [PubMed] [Google Scholar]
- 13.Patsch JM, Li X, Baum T, Yap SP, Karampinos DC, Schwartz AV, Link TM. Bone marrow fat composition as a novel imaging biomarker in postmenopausal women with prevalent fragility fractures. J Bone Miner Res. 2013;28:1721–1728. doi: 10.1002/jbmr.1950. [DOI] [PMC free article] [PubMed] [Google Scholar]
- 14.Yeung DK, Griffith JF, Antonio GE, Lee FK, Woo J, Leung PC. Osteoporosis is associated with increased marrow fat content and decreased marrow fat unsaturation: a proton MR spectroscopy study. J Magn Reson Imaging. 2005;22:279–285. doi: 10.1002/jmri.20367. [DOI] [PubMed] [Google Scholar]
- 15.Baum T, Yap SP, Karampinos DC, Nardo L, Kuo D, Burghardt AJ, Masharani UB, Schwartz AV, Li X, Link TM. Does vertebral bone marrow fat content correlate with abdominal adipose tissue, lumbar spine bone mineral density, and blood biomarkers in women with type 2 diabetes mellitus? J Magn Reson Imaging. 2012;35:117–124. doi: 10.1002/jmri.22757. [DOI] [PMC free article] [PubMed] [Google Scholar]
- 16.Fazeli PK, Bredella MA, Freedman L, Thomas BJ, Breggia A, Meenaghan E, Rosen CJ, Klibanski A. Marrow fat and preadipocyte factor-1 levels decrease with recovery in women with anorexia nervosa. J Bone Miner Res. 2012;27:1864–1871. doi: 10.1002/jbmr.1640. [DOI] [PMC free article] [PubMed] [Google Scholar]
- 17.Fazeli PK, Bredella MA, Misra M, Meenaghan E, Rosen CJ, Clemmons DR, Breggia A, Miller KK, Klibanski A. Preadipocyte factor-1 is associated with marrow adiposity and bone mineral density in women with anorexia nervosa. The Journal of clinical endocrinology and metabolism. 2010;95:407–413. doi: 10.1210/jc.2009-1152. [DOI] [PMC free article] [PubMed] [Google Scholar]
- 18.metropolitan height and weight tables. Stat Bull Metrop Life Found. 1983;64:3–9. 1983. [PubMed] [Google Scholar]
- 19.Faje AT, Fazeli PK, Miller KK, Katzman DK, Ebrahimi S, Lee H, Mendes N, Snelgrove D, Meenaghan E, Misra M, Klibanski A. Fracture risk and areal bone mineral density in adolescent females with anorexia nervosa. The International journal of eating disorders. 2014 doi: 10.1002/eat.22248. [DOI] [PMC free article] [PubMed] [Google Scholar]
- 20.Vestergaard P, Emborg C, Stoving RK, Hagen C, Mosekilde L, Brixen K. Fractures in patients with anorexia nervosa, bulimia nervosa, and other eating disorders--a nationwide register study. The International journal of eating disorders. 2002;32:301–308. doi: 10.1002/eat.10101. [DOI] [PubMed] [Google Scholar]
- 21.Provencher SW. Estimation of metabolite concentrations from localized in vivo proton NMR spectra. Magn Reson Med. 1993;30:672–679. doi: 10.1002/mrm.1910300604. [DOI] [PubMed] [Google Scholar]
- 22.Barthe N, Braillon P, Ducassou D, Basse-Cathalinat B. Comparison of two Hologic DXA systems (QDR 1000 and QDR 4500/A). The British journal of radiology. 1997;70:728–739. doi: 10.1259/bjr.70.835.9245885. [DOI] [PubMed] [Google Scholar]
- 23.Rosen CJ, Klibanski A. Bone, fat, and body composition: evolving concepts in the pathogenesis of osteoporosis. Am J Med. 2009;122:409–414. doi: 10.1016/j.amjmed.2008.11.027. [DOI] [PubMed] [Google Scholar]
- 24.Schellinger D, Lin CS, Hatipoglu HG, Fertikh D. Potential value of vertebral proton MR spectroscopy in determining bone weakness. AJNR Am J Neuroradiol. 2001;22:1620–1627. [PMC free article] [PubMed] [Google Scholar]
- 25.Bredella MA, Lin E, Gerweck AV, Landa MG, Thomas BJ, Torriani M, Bouxsein ML, Miller KK. Determinants of bone microarchitecture and mechanical properties in obese men. J Clin Endocrinol Metab. 2012;97:4115–4122. doi: 10.1210/jc.2012-2246. [DOI] [PMC free article] [PubMed] [Google Scholar]
- 26.Bredella MA, Torriani M, Ghomi RH, Thomas BJ, Brick DJ, Gerweck AV, Rosen CJ, Klibanski A, Miller KK. Vertebral bone marrow fat is positively associated with visceral fat and inversely associated with IGF-1 in obese women. Obesity (Silver Spring) 2011;19:49–53. doi: 10.1038/oby.2010.106. [DOI] [PMC free article] [PubMed] [Google Scholar]
- 27.2000 Diagnostic and statistical manual of mental disorders. 4th edition ed. American Psychiatric Association; Washington, D.C: [Google Scholar]
- 28.Lucas AR, Beard CM, O'Fallon WM, Kurland LT. 50-year trends in the incidence of anorexia nervosa in Rochester, Minn.: a population-based study. Am J Psychiatry. 1991;148:917–922. doi: 10.1176/ajp.148.7.917. [DOI] [PubMed] [Google Scholar]
- 29.Pope HG, Hudson JI, Yurgelun-Todd D, Hudson MS. Prevalence of anorexia nervosa and bulimia in three student populations. International Journal of Eating Disorders. 1984;3:45–51. [Google Scholar]
- 30.Grinspoon S, Thomas E, Pitts S, Gross E, Mickley D, Miller K, Herzog D, Klibanski A. Prevalence and predictive factors for regional osteopenia in women with anorexia nervosa. Ann Intern Med. 2000;133:790–794. doi: 10.7326/0003-4819-133-10-200011210-00011. [DOI] [PMC free article] [PubMed] [Google Scholar]
- 31.Miller KK, Grinspoon SK, Ciampa J, Hier J, Herzog D, Klibanski A. Medical findings in outpatients with anorexia nervosa. Arch Intern Med. 2005;165:561–566. doi: 10.1001/archinte.165.5.561. [DOI] [PubMed] [Google Scholar]
- 32.Orchard TS, Cauley JA, Frank GC, Neuhouser ML, Robinson JG, Snetselaar L, Tylavsky F, Wactawski-Wende J, Young AM, Lu B, Jackson RD. Fatty acid consumption and risk of fracture in the Women's Health Initiative. Am J Clin Nutr. 2010;92:1452–1460. doi: 10.3945/ajcn.2010.29955. [DOI] [PMC free article] [PubMed] [Google Scholar]
- 33.Farina EK, Kiel DP, Roubenoff R, Schaefer EJ, Cupples LA, Tucker KL. Dietary intakes of arachidonic acid and alpha-linolenic acid are associated with reduced risk of hip fracture in older adults. J Nutr. 2011;141:1146–1153. doi: 10.3945/jn.110.133728. [DOI] [PMC free article] [PubMed] [Google Scholar]
- 34.Bredella MA, Ghomi RH, Thomas BJ, Miller KK, Torriani M. Comparison of 3.0 T proton magnetic resonance spectroscopy short and long echo-time measures of intramyocellular lipids in obese and normal-weight women. J Magn Reson Imaging. 2010;32:388–393. doi: 10.1002/jmri.22226. [DOI] [PMC free article] [PubMed] [Google Scholar]
- 35.Bredella MA, Torriani M, Ghomi RH, Thomas BJ, Brick DJ, Gerweck AV, Harrington LM, Miller KK. Adiponectin is inversely associated with intramyocellular and intrahepatic lipids in obese premenopausal women. Obesity (Silver Spring) 2011;19:911–916. doi: 10.1038/oby.2010.296. [DOI] [PMC free article] [PubMed] [Google Scholar]
- 36.Bredella MA, Torriani M, Thomas BJ, Ghomi RH, Brick DJ, Gerweck AV, Miller KK. Peak growth hormone-releasing hormone-arginine-stimulated growth hormone is inversely associated with intramyocellular and intrahepatic lipid content in premenopausal women with obesity. The Journal of clinical endocrinology and metabolism. 2009;94:3995–4002. doi: 10.1210/jc.2009-0438. [DOI] [PMC free article] [PubMed] [Google Scholar]
- 37.Goodpaster BH, Theriault R, Watkins SC, Kelley DE. Intramuscular lipid content is increased in obesity and decreased by weight loss. Metabolism. 2000;49:467–472. doi: 10.1016/s0026-0495(00)80010-4. [DOI] [PubMed] [Google Scholar]
- 38.Hwang JH, Pan JW, Heydari S, Hetherington HP, Stein DT. Regional differences in intramyocellular lipids in humans observed by in vivo 1H-MR spectroscopic imaging. J Appl Physiol. 2001;90:1267–1274. doi: 10.1152/jappl.2001.90.4.1267. 1985. [DOI] [PubMed] [Google Scholar]
- 39.Klein-Platat C, Drai J, Oujaa M, Schlienger JL, Simon C. Plasma fatty acid composition is associated with the metabolic syndrome and low-grade inflammation in overweight adolescents. Am J Clin Nutr. 2005;82:1178–1184. doi: 10.1093/ajcn/82.6.1178. [DOI] [PubMed] [Google Scholar]
- 40.Lee JS, Pinnamaneni SK, Eo SJ, Cho IH, Pyo JH, Kim CK, Sinclair AJ, Febbraio MA, Watt MJ. Saturated, but not n-6 polyunsaturated, fatty acids induce insulin resistance: role of intramuscular accumulation of lipid metabolites. J Appl Physiol. 2006;1985;100:1467–1474. doi: 10.1152/japplphysiol.01438.2005. [DOI] [PubMed] [Google Scholar]
- 41.Maedler K, Spinas GA, Dyntar D, Moritz W, Kaiser N, Donath MY. Distinct effects of saturated and monounsaturated fatty acids on beta-cell turnover and function. Diabetes. 2001;50:69–76. doi: 10.2337/diabetes.50.1.69. [DOI] [PubMed] [Google Scholar]
- 42.Velan SS, Said N, Durst C, Frisbee S, Frisbee J, Raylman RR, Thomas MA, Rajendran VM, Spencer RG, Alway SE. Distinct patterns of fat metabolism in skeletal muscle of normal-weight, overweight, and obese humans. Am J Physiol Regul Integr Comp Physiol. 2008;295:R1060–1065. doi: 10.1152/ajpregu.90367.2008. [DOI] [PMC free article] [PubMed] [Google Scholar]