

Abstract
Microscopic tissue damage (microdamage) is an aspect of bone quality associated with impaired bone mechanical performance. While it is clear that bone tissue submitted to more severe loading has greater amounts of microdamage (as measured through staining), how microdamage influences future mechanical performance of bone has not been well studied, yet is necessary for understanding the mechanical consequences of the presence of microdamage. Here we determine how stained microdamage generated by a single compressive overload affects subsequent biomechanical performance of cancellous bone. Human vertebral cancellous bone specimens (n = 47) from 23 donors (14 male, 9 female, 64–92 years of age) were submitted to a compressive overload, stained for microdamage, then reloaded in compression to determine the relationship between the amount of microdamage caused by the initial load and reductions in mechanical performance during the reload. Damage volume fraction (DV/BV) caused by the initial overload was related to reductions in Young’s modulus, yield strength, ultimate strength, and yield strain upon reloading (p < 0.05, R2 = 0.18–0.34). The regression models suggest that, on average, relatively small amounts of microdamage are associated with large reductions in reload mechanical properties: a 1.50% DV/BV caused by a compressive overload was associated with an average reduction in Young’s modulus of 41.0 ± 3.2 % (mean ± SE), an average reduction in yield strength of 63.1 ± 4.5% and an average reduction in ultimate strength of 52.7 ± 4.0%. Specimens loaded beyond 1.2% (1.2–4.0% apparent strain) demonstrated a single relationship between reload mechanical properties (Young’s modulus, yield strength, and ultimate strength) and bone volume fraction despite a large range in amounts of microdamage. Hence, estimates of future mechanical performance of cancellous bone can be achieved using the bone volume fraction and whether or not a specimen was previously loaded beyond ultimate strain. The empirical relationships provided in this study make it possible to estimate the degree of impaired mechanical performance resulting from an observed amount of stained microdamage.
1.0 INTRODUCTION
The amount of microscopic tissue damage in bone tissue is an aspect of bone quality that is believed to contribute to whole bone fragility. Microscopic tissue damage in the form of microcracks, diffuse damage or trabecular microfracture is commonly referred to as microdamage and is measured using bulk staining with fluorescent or radio-opaque markers. Microdamage has been widely observed in bone tissue from otherwise normal individuals suggesting that microdamage occurs in vivo during activities of daily living and/or overloading events such as falls or moderate lifting [1]. Microdamage is more common in older individuals [2–5] and accumulation of microdamage has been implicated as a mechanism in the development of fatigue fractures, insufficiency fractures and atypical femoral fractures [6, 7]. Although microdamage is known to form in vivo, the extent to which stained microdamage influences fracture risk is unclear [8].
Studies assessing both microdamage and mechanical performance of cancellous bone use one of two approaches: 1) a microdamage stain approach in which an overload is applied and the resulting amount of stained microdamage is determined [4, 9–21]; or 2) a continuum mechanics approach in which an overload is applied and damage is assessed as the reductions in mechanical properties obtained during a second load [22–26]. The stained microdamage approach provides information about how an overload generates microdamage but does not explain how the microdamage, once present, impairs subsequent mechanical performance. The continuum mechanics approach describes reductions in subsequent mechanical performance, but does not provide information about stained microdamage. We are aware of only one study that has combined the stained microdamage and continuum mechanics approach in specimens of cancellous bone (human femoral bone), which found relationships between the sum of pre-existing microdamage and microdamage caused by a single overload in vitro and reductions in Young’s modulus upon reloading [27]. Studies of microdamage generated by fatigue loading also suggest that the relationship between microdamage and reductions in Young’s modulus are not observed until a sufficiently large range in microdamage is present [19, 28, 29].
As there have not been studies examining the effects of a large range in stained microdamage on reductions in cancellous bone mechanical properties, it is not known how much stained microdamage is necessary to impair cancellous bone Young’s modulus and strength. Understanding the effects of microdamage on future mechanical performance would make it possible to estimate the mechanical consequences of the formation of microdamage formed during stress fractures and orthopaedic implant loosening. Specifically, the current study asks how the amount of stained microdamage in vertebral cancellous bone is related to subsequent reductions in bone mechanical properties. Here we specify quantitative relationships between the amount of microdamage and reductions in cancellous bone uniaxial mechanical properties during future loading.
2.0 METHODS
The second lumbar vertebrae from 9 female (67–88 years of age at death 80 ± 7.0, mean ± SD) and 12 male (64–92 years of age, 77 ± 8.4) donors were examined in the current study. None of the donors had a history of disease known to influence bone metabolism and there was no difference in age range between male and female donors. Tissue was supplied by NDRI (www.ndri.org). Individual vertebrae were dissected free from one another using a surgical saw. Cylindrical cores of cancellous bone aligned in the superior-inferior directions were collected from the centrum of the L2 vertebrae using a diamond tipped coring tool (inner diameter 8.3 mm, Starlite 102095, Rosemont, PA, USA). Specimens were examined visually to ensure that there were no obvious heterogeneities in microarchitecture. Specimen dimensions were 8.19 mm ± 0.07 mm (mean ± SD) in diameter and 26.2 mm ± 1.7 mm in length. A total of 50 individual cancellous bone cores were collected (consisting of 1–3 specimens from each donor that met size and homogeneity requirements). Specimens were wrapped in saline soaked gauze, sealed in airtight containers and stored at −20 °C until mechanical testing.
In preparation for mechanical testing, marrow was removed from the specimens using a low pressure water jet and the specimens were press fit into brass endcaps and secured with cyanoacrylate glue (Loctite 401, Loctite, Newington, CT, USA) [30]. Using the endcap method, the gage length of the specimen was calculated as the exposed length plus one half of the length embedded inside the endcaps (19.90 ± 1.61 mm, mean ± SD). Following the endcap procedure, the specimens were wrapped in saline soaked gauze and stored at 4 °C overnight to allow the glue to cure. Immediately prior to mechanical testing, specimens were thawed to room temperature, gently placed within a tub and stained with alizarin complexone (0.5 mM, Sigma - Aldrich, St. Louis, MO, USA) in saline for two hours at atmospheric pressure. The alizarin complexone therefore stained microscopic tissue damage that was pre-existing or caused by specimen preparation. Specimens were rinsed three times for 10 minutes with deionized water prior to mechanical testing.
Each specimen was submitted to an initial compressive load, unloaded, stained for microdamage, then reloaded in compression. The study design was based on that reported by Keaveny and colleagues [22], but different in that microdamage staining was performed after the initial load. Specimens were secured in lathe chucks mounted on a servo-hydraulic materials testing device (858 MiniBionix, MTS, Eden Prarie, MN, USA). Specimens were submitted to compressive loading under strain control at 0.5% strain/second. Specimens were submitted to 10 preconditioning cycles up to 0.2% strain then a final ramp load to a preassigned applied strain (Young’s modulus was consistent during the final 5 preconditioning cycles). Specimens were distributed among 10 different groups of applied strain ranging from 0.3% to 4.0% to achieve a uniform distribution of donor sex and to distribute specimens from the same donor across groups (distribution in Figure 1). After being compressed to the applied strain, each specimen was unloaded at a rate of 0.05% strain/second. Force was measured with a 1kN load cell (Model 661.18E-01, MTS, Eden Prairie, MN, USA, USA). Strain was measured using a 25 mm extensometer (634.12F-24, MTS, Eden Prairie, MN, USA) attached to the endcaps. Force and strain data were collected at 1024 Hz. After the initial load, specimens with endcaps were carefully removed from the materials testing device and gently placed in a solution of calcein (0.5 mM, MP Biomedicals, LLC., Solon, OH, USA) for two hours at atmospheric pressure to stain microscopic tissue damage caused by the initial load. Specimens and endcaps were rinsed three times with deionized water to remove excess stain. Preliminary experiments demonstrated that removal of the specimens and staining did not influence subsequent specimen stiffness.
Figure 1.

The distribution of donor age across the 10 loading groups is shown with lines connecting specimens from the same donor. Specimens noted with solid symbols provided both mechanical properties and microdamage measurements.
After staining with calcein the specimens were gently placed back into the materials testing device. Under strain control, a series of 10 preconditioning cycles to 0.2% apparent strain were applied, followed by a final ramp to failure (4% apparent compressive strain). Specimens were then unloaded to zero load and removed from the materials testing device.
Stress-strain data were generated from each specimen for both the initial load and the reload (Figure 2). Young’s modulus was determined as the slope of the stress strain curve using a quadratic fit within the first 0.2% of strain relative to load application [31]. Yield strain and yield stress were defined using the 0.2% offset criterion. Ultimate stress and strain were identified at the point of greatest magnitude compressive stress (not all specimens reached ultimate stress during the initial load). Applied strain, residual strain and inelastic strain were also determined (Figure 2). Toughness was defined as the area under the curve up to the point of ultimate stress. The energy applied in the initial load was determined as the area under the stress strain curve before unloading. The same gage length was used for calculations of the initial loading as well as reload.
Figure 2.

A stress-strain curve illustrating the initial load and reload is shown. Specimens were stained with alizarin complexone, submitted to the initial load and unloaded. Calcein stain was applied and the specimen was then reloaded. The applied strain, residual strain and inelastic strain are also defined. Energy applied and toughness are measured as the area under the curve.
After reloading, each specimen was carefully removed from the materials testing device and the exposed gage length was removed with a low speed diamond saw (Isomet, Buehler Ltd., Lake Bluff, IL, USA). Specimens were wrapped in saline soaked gauze and stored in airtight containers at −20 °C. Once all mechanical testing was complete the specimens were thawed to room temperature, fixed in 70% ethanol, dehydrated in increasing concentrations of ethanol, cleared with xylene and embedded undecalcified in methyl methacrylate. Four longitudinal sections, 200 μm in thickness were cut from each embedded specimen with a low speed diamond saw. Sections were hand polished to a thickness of 100 μm using increasing grit sand paper and mounted on glass slides for microscopic tissue damage analysis.
Microscopic tissue damage was measured within a 6 mm X 7 mm reference area in the center of each longitudinal section, more than 1 mm from each cut edge [32]. Microscopic tissue damage was measured by a trained observer blinded to specimen group at 100 X magnification. Microcracks were characterized as thin lines of stain (Figure 3A) and were distinct from vessels, which are more curved and display two surfaces. Additionally, the optical plane of the microscope was moved up and down to confirm that potential microcracks were entirely within bone, removing the possibility that out of plane bone surfaces would be characterized as a microcrack. When cross-hatching was observed, each individual crack within a cross-hatching region was enumerated. Microcracks are reported per unit cross-section of bone observed (Cr.Dn, #/mm2). Diffuse damage was defined as a region of bone tissue displaying stain and was measured through point counting (Figure 3B). The damage volume fraction (DV/BV) was also determined using point counting that included diffuse damage as well as stained halos of damage around microcracks and regions of cross-hatching. Microfractures were characterized as a trabecula in which a microcrack crossed the entire trabecular thickness. Bone volume fraction was determined through point counting using an eyepiece grid reticule (100 μm grid spacing). Pre-existing microdamage (present in vivo or caused during specimen preparation) was identified by the presence of alizarin complexone and is reported below with the term “pre-existing” to distinguish it from microdamage caused by the initial load. Microscopic tissue damage caused by the first load was identified by calcein stain under FITC illumination and is reported below using standard microdamage nomenclature (DV/BV, Cr.Dn, number of microfractures).
Figure 3.

Examples of microdamage measured in the current study are shown including A) microcracks and B) diffuse damage.
Three specimens were lost during mechanical testing due to human error. One specimen displayed an increase in Young’s modulus during reloading but remained within the study as close examination of the stress-strain plots did not suggest that the specimen or mechanical testing regimen were flawed [14]. The final study included 47 specimens. Calcein staining on machine cut edges was considered positive control and was not observed in a subset of specimens (14 specimens) due to a flawed batch of calcein. Specimens without calcein staining on machine cut edges were not used for characterization of microdamage but were used to characterize mechanical properties and bone volume fraction.
Correlation analysis was used to identify relationships between mechanical properties, bone volume fraction, changes in mechanical properties observed during the reload, and measures of microdamage. Regression analyses were performed on correlations where r was significantly different from zero (p < 0.05). Least squares regression models are presented because mixed models including donor as a random effect to account for the inclusion of more than one specimen from each donor did not differ in fixed effects regression coefficients. Regression analyses were directed toward identifying the degree to which measures of microdamage predicted reductions in biomechanical performance during reload; aspects of the initial load that predicted reductions in biomechanical performance during the reload; and aspects of the initial load that predicted the amount of microdamage caused by the initial load. The effect of sex on mechanical properties and microdamage were determined relative to a covariate (bone volume fraction, etc.) using ANCOVA implemented through regression [33].
3.0 RESULTS
The initial overload resulted in the generation of microdamage and reductions in Young’s modulus, yield strength, ultimate strength and toughness during reloading (Table 1). Percent reductions in Young’s modulus, yield strength, ultimate strength and yield strain were correlated with the amount of microdamage generated by the initial load (calcein stained) (p < 0.05, Table 2, Figure 4). Relationships between microdamage and these three mechanical properties were nonlinear; large reductions in mechanical properties were consistently observed when DV/BV exceeded 1.0% or Cr.Dn exceeded, 1.0 /mm2, whereas smaller amounts of microdamage occurred in specimens with large and small reductions in mechanical properties. Regression models (Tables 3, S1, and Figure 4) indicated that a 1.5% DV/BV caused by a compressive overload was associated with, an average reduction in Young’s modulus of 41.0 ± 3.2 % (mean ± SE), average reduction in yield strength of 63.1 ± 4.5%, and an average reduction in ultimate strength of 52.7 ± 4.0%. Reductions in these four mechanical properties associated with a crack density of 1.5 1/mm2 were of similar magnitude. None of the measures of pre-existing microdamage (stained with alizarin complexone) were correlated with the reductions in any of the mechanical properties measured. As the amount of pre-existing microdamage was small relative to that caused by the initial load summing all microdamage (pre-existing and caused by the initial load) did not alter predictive capabilities of the regression models.
Table 1.
Mechanical properties, bone volume fraction and microdamage measures are shown.
| Mechanical/Histomorphometric Property | Sample Size* | Mean (SD) | Range |
|---|---|---|---|
| BV/TV (%) | 47 | 11.32 (3.83) | 4.42 – 23.04 |
| Initial Young’s Modulus (MPa) | 47 | 221 (95) | 56 – 514 |
| Initial Yield Strain (%) | 42 | 0.69 (0.08) | 0.57 – 0.92 |
| Initial Yield Strength (MPa) | 42 | 1.10 (0.50) | 0.29 – 2.66 |
| Initial Ultimate Strain (%) | 34 | 1.29 (0.31) | 0.68 – 1.93 |
| Initial Ultimate Strength (MPa) | 34 | 1.29 (0.58) | 0.35 – 3.03 |
| Initial Toughness (mJ/mm3) | 34 | 1.14*10−2 (6.50*10−3) | 2.30*10−3 – 2.70*10−2 |
| Energy Applied (mJ/mm3) | 47 | 1.98*10−2 (1.52*10−2) | 3.00*10−4 – 6.12*10−2 |
| Inelastic Strain (%) | 47 | 1.76 (1.22) | 0.03 – 3.84 |
| Residual Strain (%) | 47 | 1.09 (0.97) | 0.01 – 3.70 |
| Pre-existing DV/BV (%) | 33 | 0.08 (0.11) | 0.00 – 0.40 |
| Pre-existing Crack Density (#/mm2) | 33 | 0.01 (0.04) | 0.00–0.20 |
| Pre-existing Microfractures (#) | 33 | 0.09 (0.29) | 0 – 1 |
| DV/BV (%) | 33 | 0.65 (0.76) | 0.00 – 3.02 |
| Crack Density (#/mm2) | 33 | 0.99 (1.34) | 0.00 – 6.13 |
| Microfractures (#) | 33 | 1.24 (1.85) | 0.00 – 7.00 |
| Reload Young’s Modulus (MPa) | 47 | 143 (83) | 24 – 423 |
| Reload Yield Strain (%) | 47 | 0.52 (0.11) | 0.38 – 0.77 |
| Reload Yield Strength (MPa) | 47 | 0.49 (0.43) | 0.08 – 2.18 |
| Reload Ultimate Strain (%) | 47 | 1.93 (0.95) | 0.74 – 3.94 |
| Reload Ultimate Strength (MPa) | 47 | 0.77 (0.52) | 0.14 – 2.73 |
| Reload Toughness (mJ/mm3) | 47 | 9.20*10−3 (6.20*10−3) | 1.00*10−3 – 2.79*10−2 |
Not all specimens were loaded to a sufficient applied strain to generate each measure. The distribution of specimens among applied strains and donors is shown in Figure 1.
Table 2.
Correlations between microdamage, mechanical properties from the initial load and percent reduction in mechanical properties during reload are shown. The upper triangle shows the value of Pearson’s r while the lower triangle displays the 95% confidence interval of r. An extended correlation analysis and scatterplot matrix is in the Supplementary Materials.
| Applied Strain (%) | Inelastic Strain (%) | [DV/BV (%)]1/2 | [Crack Density (#/mm2) ]1/2 | [Micro- fractures (#)]1/2 | Reduction in Young's Modulus (%) | Reduction in Yield Strength (%) | Reduction in Ultimate Strength (%) | Reduction in Yield Strain (%) | |
|---|---|---|---|---|---|---|---|---|---|
| Applied Strain (%) | 1.0 | 0.99* | 0.42* | 0.41* | −0.08 | 0.85* | 0.85* | 0.42* | 0.71* |
| Inelastic Strain (%) | (0.98, 1.00) | 1.0 | 0.44* | 0.43* | −0.01 | 0.88* | 0.87* | 0.50* | 0.71* |
| [DV/BV (%)]1/2 | (0.09, 0.66) | (0.10, 0.67) | 1.0 | 0.92* | 0.30 | 0.59* | 0.52* | 0.43* | 0.49* |
| [Crack Density (#/mm2)]1/2 | (0.08, 0.66) | (0.10, 0.67) | (0.85, 0.96) | 1.0 | 0.30 | 0.47* | 0.46* | 0.36 | 0.46* |
| [Micro-fractures (#)]1/2 | (−0.41, 0.27) | (−0.35, 0.34) | (−0.04, 0.58) | (−0.05, 0.58) | 1.0 | 0.15 | 0.27 | 0.39 | 0.30 |
| Reduction in Young' Modulus (%)s | (0.74, 0.91) | (0.80, 0.93) | (0.30, 0.77) | (0.15, 0.70) | (−0.20, 0.47 | 1.0 | 0.90* | 0.66* | 0.65* |
| Reduction in Yield Strength (%) | (0.73, 0.92) | (0.77, 0.93) | (0.19, 0.74) | (0.11, 0.70) | (−0.10, 0.58) | (0.81, 0.94) | 1.0 | 0.79* | 0.90* |
| Reduction in Ultimate Strength (%) | (0.09, 0.66) | (0.19, 0.72) | (0.04, 0.71) | (−0.05, 0.66) | (−0.01, 0.69) | (0.41, 0.82) | (0.61, 0.89) | 1.0 | 0.59* |
| Reduction in Yield Strain (%) | (0.52, 0.83) | (0.52, 0.84) | (0.16, 0.72) | (0.11, 0.70) | (−0.06, 0.60) | (0.44, 0.80) | (0.82, 0.94) | (0.31, 0.77) | 1.0 |
p<0.05 v. r = 0
Figure 4.

The relationships between the amount of microdamage caused by the initial load and the percent reduction in Young’s modulus or Yield Strength upon reloading are shown (p < 0.05). Specimens in which the applied strain in the initial load was less than 1.2% are illustrated with open squares. Regression equations are shown in Table 3.
Table 3.
Regression models are listed in the form Y = B0 + B1*X. Standard error for regression coefficients is noted in parentheses. Listed regressions showed p < 0.05.
| Y | X | B0 | B1 | a R2 |
|---|---|---|---|---|
| Effect of Microdamage on Reduction in Mechanical Properties | ||||
| Reduction in Young’s Modulus (%) | [ DV/BV (%) ]1/2 | 15.65 (5.95) | 20.30 (5.84) | 0.34 |
| Reduction in Young’s Modulus (%) | Crack Density (#/mm2) | 23.67 (4.78) | 6.17 (2.36) | 0.25 |
| Reduction in Yield Strength (%) | [ DV/BV (%) ]1/2 | 34.92 (7.90) | 18.72 (8.39) | 0.27 |
| Reduction in Yield Strength (%) | Crack Density (#/mm2) | 41.89 (6.02) | 6.67 (3.00) | 0.23 |
| Reduction in Ultimate Strength (%) | [ DV/BV (%) ]1/2 | 34.97 (7.77) | 15.07 (7.22) | 0.19 |
| Reduction in Ultimate Strength (%) | Crack Density (#/mm2) | 38.73 (5.41) | 5.69 (2.37) | 0.18 |
| Reduction in Yield Strain (%) | [ DV/BV (%) ]1/2 | 15.57 (4.34) | 10.92 (4.47) | 0.24 |
| Reduction in Yield Strain (%) | Crack Density (#/mm2) | 18.53 (3.14) | 4.04 (1.59) | 0.24 |
| Prediction of Microdamage from Initial Load | ||||
| [ DV/BV (%) ]1/2 | Inelastic Strain (%) | 0.50 (0.17) | 0.22 (0.09) | 0.20 |
| Crack Density (#/mm2) | Inelastic Strain (%) | 0.77 (0.47) | 0.52 (0.25) | 0.16 |
R2 is not well defined for linear mixed models [43] and is presented here for regressions with the fixed effect alone.
Specimens submitted to a greater amount of inelastic strain during the initial load had greater amounts of microdamage from the initial load (p < 0.05, r2 = 0.29–0.34, Figure 5). Crack density associated with the initial load ranged from 0.0–6.1 /mm2 and damage volume fraction ranged from 0.0–3.0%. Measures of microdamage generated by the initial load were all highly correlated with one another (p < 0.01). In particular crack density was highly correlated with DV/BV (r = 0.90). Damage volume fraction, crack density and number of microfractures were correlated with inelastic strain (Table 2). The relationship between the initial load and resulting microdamage was more pronounced when limited to the pool of specimens subjected to an applied strain of 1.0% or more. Regression models predicting DV/BV and Cr.Dn from the inelastic strain were significant but not predictive (p < 0.05, R2 = 0.16–0.20, Table 3, Figure 5). Only small amounts of pre-existing microdamage were observed (Table 1). Pre-existing DV/BV was weakly correlated with DV/BV generated by the initial load (r = 0.52), but no other correlations between pre-existing microdamage and microdamage generated by the initial load were observed. None of the microdamage measures (pre-existing or caused by initial loading) were correlated with BV/TV. Summing pre-existing microdamage with measures of microdamage caused by the initial load did not alter any regression models.
Figure 5.
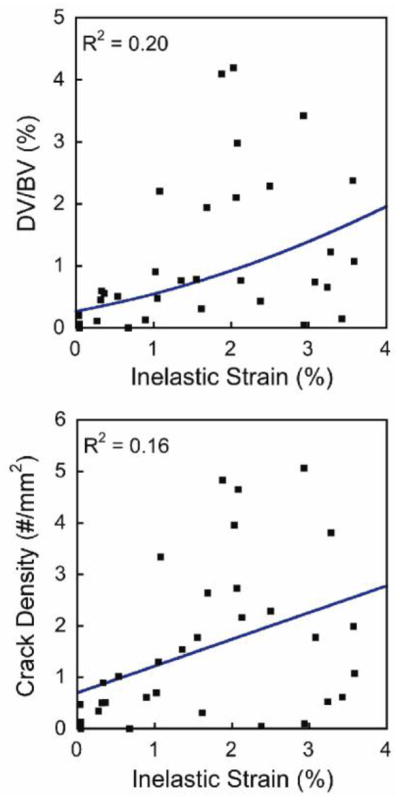
The relationships between the inelastic strain resulting from the initial load and the resulting amounts of damage volume fraction (DV/BV) and crack density are shown (p < 0.05). Regression equations are in Table 3.
The Young’s modulus, yield strength, ultimate strength and toughness of cancellous bone under the initial load were correlated with bone volume fraction (Figure 6, Table S3). Yield strain and ultimate strain were not correlated with bone volume fraction. Reload Young’s modulus, yield stress, ultimate stress and toughness were correlated with bone volume fraction (Figure 6, Table 3). No changes in the relationships between these four mechanical properties and bone volume fraction were observed in specimens loaded initially to an applied strain of less than 1.2% (Figure 6). In specimens loaded beyond an applied strain of 1.2%, the relationships between bone volume fraction and Young’s modulus, Yield strength and ultimate strength during reload followed a different slope and intercept (Figure 6, Table 3). Inelastic strain from the initial load was the single best predictor of percent reductions in mechanical properties (Figure S1).
Figure 6.

The relationship between mechanical properties and bone volume fraction is illustrated for the initial load as well as for the reload. Specimens in which the applied strain in the initial load was less than 1.2% are illustrated with open squares. Regression equations are shown in Table S1.
No differences between male and female donors were observed between mechanical properties during the initial load, microdamage generated by the initial load, or reductions in mechanical properties during the reload (p > 0.05). No correlations between mechanical properties and donor age were observed.
4.0 DISCUSSION
The current study is novel in describing how the presence of induced microdamage is associated with reductions in mechanical properties during subsequent loading. We provide quantitative empirical relationships between microscopic tissue damage and reductions in cancellous bone strength under subsequent loading. We found that relatively small amounts of microdamage (DV/BV ≥ 1%; Cr.Dn ≥ 1 /mm2) were indicators of large reductions in cancellous bone stiffness and strength (30–60%). However, very small amounts of microdamage (DV/BV < 1%; Cr.Dn < 1.0 /mm2) did not provide useful information about reduction in mechanical properties.
A strength of the current study was that it involved a relatively large number of specimens from a moderately sized cohort (n=47 specimens from 21 donors for mechanical properties, n=33 specimens from 20 donors for microdamage). Additionally, the current study applied fluorochrome stains of microdamage before reloading, thereby making it possible to associate microdamage with impaired mechanical performance in subsequent loads. This is in contrast to the great majority of studies of microdamage in cancellous bone that have concentrated on determining the amount of microdamage caused by an applied load and did not examine the effect of microdamage on subsequent loading (i.e. the effect of microdamage on bone quality assessed biomechanically).
There are some limitations that must be considered when interpreting our findings. First, it must be emphasized that the current study measured microdamage stained with fluorochromes. Although staining is the primary methodology for differentiating damage present in bone tissue from that caused by specimen preparation [34], measurable amounts of stains do not always penetrate all regions of bone tissue with permanent deformations [35]. Hence, it is possible that our measures of microdamage underestimate the amount of tissue damage within each specimen. Second, the current study only examined the biomechanical effects of a single compressive damage-generating event. Different loading modes (compression, tension, shear) have been associated with different amounts of microdamage and reductions in mechanical performance in subsequent loading. For example, mixed mode loading (compression + shear) has been shown to cause greater reductions in stiffness and larger amounts of microdamage than a single loading mode [27] and microdamage has been shown to be more likely to propagate when the loading mode is changed [15]. Because compression loading was used for both the initial load and the reload it is likely that the effects of microdamage on subsequent biomechanical performance observed in the current study may be smaller than that expected in vivo where loading is expected to be more variable and include mixed loading modes.
Our findings are consistent with prior work. The study design was adapted from that reported by Keaveny and colleagues [22]. Similar to the findings by Keaveny and colleagues, inelastic strain generated by the initial load was found to be the single best predictor of reductions in Young’s modulus and ultimate strength, although there are subtle differences in the shape of the regression curves. Compared to the study by Keaveny et al. the reductions in Young’s modulus caused by the initial load in the current study are smaller (2.9–75.2% here v. 5.1–91.0% by Keaveny et al.), while estimated changes in ultimate strength in the current study are larger (15.9–84.0% here v. 3.6–63.8%). Our study suggests that an applied strain of 2% would, on average, result in a reduction in Young’s modulus of 30%, which is more than double that reported in similar experiments using dense cancellous bone (12% on average in bovine cancellous bone [15] and human femoral cancellous bone [27]) and less than half that expected from regression models derived using human vertebral cancellous bone (70% on average [22]). The previous study in vertebral cancellous bone [22], however, used a definition of percent reduction in Young’s modulus based on a different portion of the reload curve explaining the larger percent reduction reported. It is unclear why the effects of a compressive overload in the current study are larger than reports in denser cancellous bone, but some potential contributors include the number of donors, specimens per donor, the type of tissue (femoral v. vertebral).
The current study is unique in providing quantitative relationships between the amount of microdamage caused by loading in vitro and subsequent cancellous bone stiffness, yield strength and ultimate strength. The relationships between stained microdamage and reductions in mechanical performance, however were not highly predictive (r2 < 0.34), primarily due to variability in measures of microdamage. We can conclude, however, that moderate amounts of stained microdamage (Cr.Dn > 1.0/mm2, DV/BV > 1.0%, the right hand sides of Figures 4B,C) are associated with reductions in yield strength and ultimate strength of more than 50% and reductions in Young’s modulus of more than 40% (right hand side of Figure 4A). In contrast, smaller amounts of stained microdamage (Cr.Dn < 1.0/mm2, DV/BV < 1.0%) appear to be independent of reductions in mechanical performance. Large variability in microdamage measurement (SD/Mean > 0.50) is common in two dimensional assessment of cancellous bone loaded in vitro [14–16, 18, 27, 32, 36] as well as when using three-dimensional techniques [21, 29], suggesting that the two-dimensional measurement technique is not the primary cause of variability. Microdamage in cancellous bone tends to occur in localized bands [18] and some have isolated measurement of microdamage to regions of cancellous bone with the lowest bone volume fraction where a majority of deflection and microdamage occurs during loading [21, 37]. The current study did not use this approach in order to provide better comparisons to traditional microdamage assessment, which are often made in donor tissue with an unknown loading history.
Measures of bone mass and density such as bone volume fraction are well-recognized predictors of bone tissue mechanical performance. Bone tissue with a biomechanically relevant change in bone quality, however, will have a modified relationship between bone tissue mechanical properties and bone volume fraction (or apparent density), which is observable graphically as a change in the slope or intercept of a plot of the mechanical properties v. BV/TV [38]. We found the relationships between bone volume fraction and reload stiffness and strength could be summarized by one of two linear regressions, one identical to the initial loading (specimens initially loaded to less than 1.2% apparent strain) and a second for specimens initially loaded to more than 1.2% apparent strain (Figure 6). While it is not surprising that the overload impairs reload mechanical properties [39], it is surprising that a single regression model with bone volume fraction can reasonably predict the reload mechanical properties of specimens previously overloaded to applied strains ranging from 1.2 (approximately ultimate strain) to 4.0% (well beyond ultimate strain). Hence, cancellous bone damaged in compression appears to display a single “damaged” biomechanical profile of bone quality. One application of this finding is to whole bone finite element models, which can be derived from clinical scans but are based upon empirical relationships between density/bone volume fraction and mechanical properties [40, 41]. The reload regression models (Figure 4, Table 3), can be used to with reasonable confidence to represent damaged regions of cancellous bone in finite element models without the use of continuum damage material models or detailed kinematic representations of load-reload characteristics, greatly simplifying finite element modeling of damaged tissue in whole bones. Additionally, while loading beyond 1.2% applied strain altered regression models for Young’s modulus, yield strength and ultimate strength, the relationship between toughness and bone volume fraction was not significantly altered during reload, consistent with findings in bovine cancellous bone [25]. That toughness was not altered after the overload is consistent with the idea that energy absorption in cancellous occurs primarily through bending of individual trabeculae which allows considerable energy dissipation.
A major utility of the regression models we observed (Table 3) is for interpreting the mechanical consequences of an observed amount of microdamage, including in vivo microdamage. Microdamage generated in vivo due to normal activity has been observed in tissue collected from deceased donors or following surgery, but such measures of microdamage have never been associated with fracture risk and the degree to which such damage weakens bone tissue remains poorly understood [1]. Studies of in vivo microdamage include a large range in amounts of microdamage in human cancellous bone (Table 4). The large range is most likely due to differences in staining methodology, region of the skeleton, number of sections examined per specimen, donor age/sex and the inherently subjective nature of classifying and counting microdamage, which can differ among laboratories [42]. The amounts of microdamage we generated in vitro are on the low end of the range reported for in vivo microdamage in the literature, suggesting that the amounts of microdamage examined in the current study are not unreasonably large compared to what has been observed in vivo. While it is not known how much the microdamage generated in vivo differs from that generated during uniaxial loading in vitro, our findings suggest that in vivo microdamage may occur in sufficient amounts to cause large reductions in mechanical properties.
Table 4.
The mean (range) in crack density and damage volume fraction determined in cancellous bone loaded in vitro in the current study is shown along with reports of magnitudes of in vivo microdamage in human cancellous bone. Limitations of comparisons among studies are mentioned in the text.
| Study | Regions | Cr.Dn (#/mm2) | DV/BV (%) |
|---|---|---|---|
| Current Study (Loaded In vitro) | Vertebra | 1.56 (0.00, 5.07) | 1.11 (0.00, 4.20) |
| “In vivo” Microdamage (No in vitro Loading) | |||
| [44] | Vertebra | 1.49 (0.11,6.0) | 0.05 (0.00, 0.91) |
| [45],[46] | Vertebra | 5.28 a (0.0, 27.0) | 13.8 (0.0, 61.0) |
| [1] | Vertebra | N.R. (0.0, 12.0) | N.R. |
| [27] | Femur | 0.89 b (0.1,2.8) | N.R. |
| [3]c | Femur | 0.39 c (0.03,0.97) | N.R. |
| [4] | Femur | 1.0 (0.0, 2.3) | N.R. |
N.R. – Not reported
Mean and range for combined male and female
Mean and range for both femoral neck and trochanter specimens
Mean reported for elderly non-fractured group
5.0 CONCLUSIONS
Our findings provide the first quantitative estimates of the effect of stained microdamage on subsequent bone stiffness and strength. While small amounts of microdamage do not necessarily indicate impaired mechanical performance, the presence of modest amounts of microdamage is always indicative of large reductions in cancellous bone stiffness and strength.
Supplementary Material
Highlights.
We determine how microdamage changes future mechanical performance of cancellous bone
Human vertebral cancellous bone damaged under compression was reloaded
Empirical relationships between the amount of microdamage and percent reductions in Young’s modulus, yield strength and ultimate strength are reported.
Small amounts of microdamage are associated with large reductions in strength
Amounts of microdamage associated with >50% reductions in strength were smaller than “in vivo” microdamage reported in the literature.
Acknowledgments
This work was made possible by Grant AR057362 from NIAMS/NIH. Its contents are solely the responsibility of the authors and do not necessarily represent the official views of the NIAMS or NIH. We acknowledge use of human vertebral bodies provided by the National Disease Research Interchange (NDRI), with support from NIH grant 8U42OD011158-22. Support from the Wilbert J. Austin Professor of Engineering Chair (CMR) is gratefully acknowledged. The authors thank Thu Nguyen, Natasha Halarnkar and Srikanth Kowtha for assistance in specimen preparation.
Footnotes
Publisher's Disclaimer: This is a PDF file of an unedited manuscript that has been accepted for publication. As a service to our customers we are providing this early version of the manuscript. The manuscript will undergo copyediting, typesetting, and review of the resulting proof before it is published in its final citable form. Please note that during the production process errors may be discovered which could affect the content, and all legal disclaimers that apply to the journal pertain.
REFERENCES CITED
- 1.Burr DB, Forwood MR, Fyhrie DP, Martin RB, Schaffler MB, Turner CH. Bone microdamage and skeletal fragility in osteoporotic and stress fractures. J Bone Miner Res. 1997;12:6–15. doi: 10.1359/jbmr.1997.12.1.6. [DOI] [PubMed] [Google Scholar]
- 2.Schaffler MB, Choi K, Milgrom C. Aging and matrix microdamage accumulation in human compact bone. Bone. 1995;17:521–525. doi: 10.1016/8756-3282(95)00370-3. [DOI] [PubMed] [Google Scholar]
- 3.Mori S, Harruff R, Ambrosius W, Burr DB. Trabecular bone volume and microdamage accumulation in the femoral heads of women with and without femoral neck fractures. Bone. 1997;21:521–6. doi: 10.1016/s8756-3282(97)00200-7. [DOI] [PubMed] [Google Scholar]
- 4.Fazzalari NL, Forwood MR, Smith K, Manthey BA, Herreen P. Assessment of cancellous bone quality in severe osteoarthrosis: bone mineral density, mechanics, and microdamage. Bone. 1998;22:381–8. doi: 10.1016/s8756-3282(97)00298-6. [DOI] [PubMed] [Google Scholar]
- 5.Zioupos P. Ageing human bone: factors affecting its biomechanical properties and the role of collagen. J Biomater Appl. 2001;15:187–229. doi: 10.1106/5JUJ-TFJ3-JVVA-3RJ0. [DOI] [PubMed] [Google Scholar]
- 6.Shane E, Burr D, Ebeling PR, Abrahamsen B, Adler RA, Brown TD, Cheung AM, Cosman F, Curtis JR, Dell R, Dempster D, Einhorn TA, Genant HK, Geusens P, Klaushofer K, Koval K, Lane JM, McKiernan F, McKinney R, Ng A, Nieves J, O'Keefe R, Papapoulos S, Sen HT, van der Meulen MC, Weinstein RS, Whyte M. Atypical subtrochanteric and diaphyseal femoral fractures: report of a task force of the American Society for Bone and Mineral Research. J Bone Miner Res. 2010;25:2267–94. doi: 10.1002/jbmr.253. [DOI] [PubMed] [Google Scholar]
- 7.Ettinger B, Burr DB, Ritchie RO. Proposed pathogenesis for atypical femoral fractures: Lessons from material research. Bone. 2013 doi: 10.1016/j.bone.2013.02.004. [DOI] [PubMed] [Google Scholar]
- 8.Burr D. Microdamage and bone strength. Osteoporos Int. 2003;14 (Suppl 5):S67–72. doi: 10.1007/s00198-003-1476-2. [DOI] [PubMed] [Google Scholar]
- 9.Schaffler MB, Radin EL, Burr DB. Mechanical and morphological effects of strain rate on fatigue of compact bone. Bone. 1989;10:207–14. doi: 10.1016/8756-3282(89)90055-0. [DOI] [PubMed] [Google Scholar]
- 10.O'Brien FJ, Taylor D, Lee TC. Microcrack accumulation at different intervals during fatigue testing of compact bone. J Biomech. 2003;36:973–80. doi: 10.1016/s0021-9290(03)00066-6. [DOI] [PubMed] [Google Scholar]
- 11.Diab T, Vashishth D. Effects of damage morphology on cortical bone fragility. Bone. 2005;37:96–102. doi: 10.1016/j.bone.2005.03.014. [DOI] [PubMed] [Google Scholar]
- 12.Wachtel EF, Keaveny TM. Dependence of trabecular damage on mechanical strain. J Orthop Res. 1997;15:781–787. doi: 10.1002/jor.1100150522. [DOI] [PubMed] [Google Scholar]
- 13.Lee TC, Arthur TL, Gibson LJ, Hayes WC. Sequential labelling of microdamage in bone using chelating agents. J Orthop Res. 2000;18:322–5. doi: 10.1002/jor.1100180222. [DOI] [PubMed] [Google Scholar]
- 14.Wang X, Guyette J, Liu X, Roeder RK, Niebur GL. Axial-shear interaction effects on microdamage in bovine tibial trabecular bone. Eur J Morphol. 2005;42:61–70. doi: 10.1080/09243860500095570. [DOI] [PubMed] [Google Scholar]
- 15.Wang X, Niebur GL. Microdamage propagation in trabecular bone due to changes in loading mode. J Biomech. 2006;39:781–90. doi: 10.1016/j.jbiomech.2005.02.007. [DOI] [PubMed] [Google Scholar]
- 16.Nagaraja S, Couse TL, Guldberg RE. Trabecular bone microdamage and microstructural stresses under uniaxial compression. J Biomech. 2005;38:707–16. doi: 10.1016/j.jbiomech.2004.05.013. [DOI] [PubMed] [Google Scholar]
- 17.Green JO, Nagaraja S, Diab T, Vidakovic B, Guldberg RE. Age-related changes in human trabecular bone: Relationship between microstructural stress and strain and damage morphology. Journal of Biomechanics. 2011;44:2279–85. doi: 10.1016/j.jbiomech.2011.05.034. [DOI] [PMC free article] [PubMed] [Google Scholar]
- 18.Moore TLA, Gibson LJ. Microdamage accumulation in bovine trabecular bone in uniaxial compression. J Biomech Eng. 2002;124:63–71. doi: 10.1115/1.1428745. [DOI] [PubMed] [Google Scholar]
- 19.Moore TL, Gibson LJ. Fatigue microdamage in bovine trabecular bone. J Biomech Eng. 2003;125:769–76. doi: 10.1115/1.1631584. [DOI] [PubMed] [Google Scholar]
- 20.Tang SY, Vashishth D. A non-invasive in vitro technique for the three-dimensional quantification of microdamage in trabecular bone. Bone. 2007;40:1259–64. doi: 10.1016/j.bone.2006.10.031. [DOI] [PMC free article] [PubMed] [Google Scholar]
- 21.Karim L, Vashishth D. Role of trabecular microarchitecture in the formation, accumulation, and morphology of microdamage in human cancellous bone. J Orthop Res. 2011;29:1739–44. doi: 10.1002/jor.21448. [DOI] [PMC free article] [PubMed] [Google Scholar]
- 22.Keaveny TM, Wachtel EF, Kopperdahl DL. Mechanical behavior of human trabecular bone after overloading. J Orthop Res. 1999;17:346–53. doi: 10.1002/jor.1100170308. [DOI] [PubMed] [Google Scholar]
- 23.Davy DT, Jepsen KJ. Bone Damage Mechanics. In: Cowin SC, editor. Bone Mechanics Handbook. 2. Boca Raton, FL, USA: CRC Press; 2001. [Google Scholar]
- 24.Bredbenner TL, Davy DT. The effect of damage on the viscoelastic behavior of human vertebral trabecular bone. J Biomech Eng. 2006;128:473–80. doi: 10.1115/1.2205370. [DOI] [PubMed] [Google Scholar]
- 25.Garrison JG, Slaboch CL, Niebur GL. Density and architecture have greater effects on the toughness of trabecular bone than damage. Bone. 2009;44:924–9. doi: 10.1016/j.bone.2008.12.030. [DOI] [PMC free article] [PubMed] [Google Scholar]
- 26.Garrison JG, Gargac JA, Niebur GL. Shear strength and toughness of trabecular bone are more sensitive to density than damage. J Biomech. 2011;44:2747–54. doi: 10.1016/j.jbiomech.2011.09.002. [DOI] [PMC free article] [PubMed] [Google Scholar]
- 27.Wu Z, Laneve AJ, Niebur GL. In vivo microdamage is an indicator of susceptibility to initiation and propagation of microdamage in human femoral trabecular bone. Bone. 2013;55:208–15. doi: 10.1016/j.bone.2013.02.019. [DOI] [PMC free article] [PubMed] [Google Scholar]
- 28.Burr DB, Turner CH, Naick P, Forwood MR, Ambrosius W, Hasan MS, Pidaparti R. Does microdamage accumulation affect the mechanical properties of bone? Journal of Biomechanics. 1998;31:337–45. doi: 10.1016/s0021-9290(98)00016-5. [DOI] [PubMed] [Google Scholar]
- 29.Lambers FM, Bouman AR, Rimnac CM, Hernandez CJ. Microdamage caused by fatigue loading in human cancellous bone: relationship to reductions in bone biomechanical performance. PLoS One. 2013;8:e83662. doi: 10.1371/journal.pone.0083662. [DOI] [PMC free article] [PubMed] [Google Scholar]
- 30.Keaveny TM, Pinilla TP, Crawford RP, Kopperdahl DL, Lou A. Systematic and random errors in compression testing of trabecular bone. J Orthop Res. 1997;15:101–110. doi: 10.1002/jor.1100150115. [DOI] [PubMed] [Google Scholar]
- 31.Morgan EF, Yeh OC, Chang WC, Keaveny TM. Nonlinear behavior of trabecular bone at small strains. J Biomech Eng. 2001;123:1–9. doi: 10.1115/1.1338122. [DOI] [PubMed] [Google Scholar]
- 32.Dux SJ, Ramsey D, Chu EH, Rimnac CM, Hernandez CJ. Alterations in damage processes in dense cancellous bone following gamma-radiation sterilization. J Biomech. 2010;43:1509–13. doi: 10.1016/j.jbiomech.2010.01.042. [DOI] [PubMed] [Google Scholar]
- 33.Glantz SA, Slinker BK. Primer of Applied Regression & Analysis of Variance. 2. New York: McGraw-Hill; 2001. [Google Scholar]
- 34.Burr DB, Stafford T. Validity of the bulk-staining technique to separate artifactual from in vivo bone microdamage. Clin Orthop. 1990;260:305–8. [PubMed] [Google Scholar]
- 35.Sun X, Hoon Jeon J, Blendell J, Akkus O. Visualization of a phantom post-yield deformation process in cortical bone. J Biomech. 2010;43:1989–96. doi: 10.1016/j.jbiomech.2010.03.011. [DOI] [PubMed] [Google Scholar]
- 36.Hernandez CJ, Ramsey DS, Dux SJ, Chu EH, Rimnac CM. Irradiation does not modify mechanical properties of cancellous bone under compression. Clin Orthop Relat Res. 2012;470:2488–95. doi: 10.1007/s11999-011-2148-8. [DOI] [PMC free article] [PubMed] [Google Scholar]
- 37.Nazarian A, Stauber M, Zurakowski D, Snyder BD, Muller R. The interaction of microstructure and volume fraction in predicting failure in cancellous bone. Bone. 2006;39:1196–202. doi: 10.1016/j.bone.2006.06.013. [DOI] [PubMed] [Google Scholar]
- 38.Hernandez CJ, Keaveny TM. A biomechanical perspective on bone quality. Bone. 2006;39:1173–81. doi: 10.1016/j.bone.2006.06.001. [DOI] [PMC free article] [PubMed] [Google Scholar]
- 39.Hoshaw SJ, Cody DD, Saad AM, Fyhrie DP. Decrease in canine proximal femoral ultimate strength and stiffness due to fatigue damage. J Biomech. 1997;30:323–9. doi: 10.1016/s0021-9290(96)00159-5. [DOI] [PubMed] [Google Scholar]
- 40.Crawford RP, Cann CE, Keaveny TM. Finite element models predict in vitro vertebral body compressive strength better than quantitative computed tomography. Bone. 2003;33:744–50. doi: 10.1016/s8756-3282(03)00210-2. [DOI] [PubMed] [Google Scholar]
- 41.Engelke K, Libanati C, Fuerst T, Zysset P, Genant HK. Advanced CT based in vivo methods for the assessment of bone density, structure, and strength. Curr Osteoporos Rep. 2013;11:246–55. doi: 10.1007/s11914-013-0147-2. [DOI] [PubMed] [Google Scholar]
- 42.Ehlert KM, O'Brien RG, Hernandez CJ. Statistical power in measures of microscopic tissue damage in cancellous bone. Annual Meeting of the American Society for Bone and Mineral Research; 2011. p. M0052. [Google Scholar]
- 43.Edwards LJ, Muller KE, Wolfinger RD, Qaqish BF, Schabenberger O. An R2 statistic for fixed effects in the linear mixed model. Stat Med. 2008;27:6137–57. doi: 10.1002/sim.3429. [DOI] [PMC free article] [PubMed] [Google Scholar]
- 44.Follet H, Viguet-Carrin S, Burt-Pichat B, Depalle B, Bala Y, Gineyts E, Munoz F, Arlot M, Boivin G, Chapurlat RD, Delmas PD, Bouxsein ML. Effects of preexisting microdamage, collagen cross-links, degree of mineralization, age, and architecture on compressive mechanical properties of elderly human vertebral trabecular bone. J Orthop Res. 2011;29:481–8. doi: 10.1002/jor.21275. [DOI] [PubMed] [Google Scholar]
- 45.Wenzel TE, Schaffler MB, Fyhrie DP. In vivo trabecular microcracks in human vertebral bone. Bone. 1996;19:89–95. doi: 10.1016/8756-3282(96)88871-5. [DOI] [PubMed] [Google Scholar]
- 46.Vashishth D, Koontz J, Qiu SJ, Lundin-Cannon D, Yeni YN, Schaffler MB, Fyhrie DP. In vivo diffuse damage in human vertebral trabecular bone. Bone. 2000;26:147–152. doi: 10.1016/s8756-3282(99)00253-7. [DOI] [PubMed] [Google Scholar]
Associated Data
This section collects any data citations, data availability statements, or supplementary materials included in this article.