Abstract
Muscle and bone are known to act as a functional unit and communicate biochemically during tissue development and maintenance. Muscle-derived factors (myokines) have been found to affect bone functions in vitro. However, the transport times of myokines to penetrate into bone, a critical step required for local muscle-bone crosstalk, have not been quantified in situ or in vivo. In this study, we investigated the permeability of the periosteum, a major barrier to muscle-bone crosstalk by tracking and modeling fluorescent tracers that mimic myokines under confocal microscopy. Periosteal surface boundaries and tracer penetration within the boundaries were imaged in intact murine tibiae using reflected light and time-series xz confocal imaging, respectively. Four fluorescent tracers including sodium fluorescein (376Da) and dextrans (3kDa, 10kDa and 40kDa) were chosen because they represented a wide range of molecular weights (MW) of myokines. We found that i) murine periosteum was permeable to the three smaller tracers while the 40kDa could not penetrate beyond 40% of the outer periosteum within 8 hours, suggesting that periosteum is semi-permeable with a cut-off MW of approximately 40kDa, and ii) the characteristic penetration time through the periosteum (~60μm thick) increased with tracer MW and fit well with a relationship (), from which, the characteristic penetration times of various myokines were extrapolated. To achieve effective muscle-bone crosstalk, likely signaling candidates should have shorter penetration time than their bioactive time, which we assumed to be 5 times of the molecule’s half-life time in the body. Myokines such as PGE2, IGF-1, IL-15 and FGF-2 were predicted to satisfy this requirement. In summary, a novel imaging approach was developed and used to investigate the transport of myokine mimicking-tracers through the periosteum, enabling further quantitative studies of muscle-bone communication in physiologically normal and pathological conditions.
Keywords: muscle-bone unit, muscle-bone communication, reflected light microscope, confocal imaging, periosteum
Introduction
Emerging evidence suggests that muscle and bone, being a functional unit, communicate with each other during tissue development and maintenance [1-3]. Soluble factors secreted by skeletal muscles (termed myokines) can affect the bone metabolism [4-7]. These myokines include growth factors (e.g., insulin like growth factor-1 [IGF-1], fibroblast growth factor-2 [FGF-2], and transforming growth factor-β [TGF-β]), cytokines (e.g., interleukins [IL-6, and IL-15]), and other small signaling molecules (e.g., prostaglandin E2 [PGE2]). A recent study demonstrated that myokines secreted by skeletal muscles protected osteocytes from glucocorticoid-induced apoptosis through the activation of Wnt/β-catenin pathway, and such protective effect was greatly enhanced when the muscle was electrically stimulated [8]. Muscle also serves as an important source of cells and growth factors that promote bone healing [9], and muscle progenitor cells even retain the capacity to differentiate into osteogenic cell lineages [10, 11]. The communication between bone and muscle can operate in both directions. Bone marrow-derived mesenchymal stromal cells (MSCs) were found to stimulate skeletal myoblast proliferation by releasing growth factors [12]. In addition, mechanically stimulated MLO-Y4 osteocytes were found to express anabolic factors, such as IGF-I, vascular endothelial growth factor (VEGF) or hepatocyte growth factor (HGF), which are known to affect muscle mass and its adaptation to mechanical loading [13]. Therefore, understanding the functional interactions between muscle and bone will be crucial to the development of new and efficient bone/muscle repair strategies.
The periosteum, a fibrous membrane that physically separates bone and muscle tissues, acts both as a functional target for muscle/bone derived growth factors as well as an important gatekeeper for fluid and solute exchange between muscle and bone [6, 14]. The periosteum is composed of two distinct layers with the outer fibrous layer containing fibroblasts, collagen, Sharpey’s fibers and an extensive nerve and microvascular network and the inner cambium layer containing nerves, capillaries, and adult mesenchymal progenitor cells [15-19]. As a reservoir of pluripotential mesenchymal stem cells, which can differentiate into bone cells, chondrocytes, adipocytes, and skeletal myocytes [20, 21], periosteum could be a target of muscle/bone-derived factors. A recent study found that periosteum expressed abundant receptors for myokine IGF-1 and FGF-2, which are known to be potent regulators of bone formation [6]. Furthermore, as an interface, the periosteum can act as a molecular sieve, controlling the penetration and transport rates for signaling molecules involved in bone-muscle crosstalk. To date, the periosteum has been described as ranging from a completely sealed/impermeable barrier for fluid perfusion [22-25] to a semi-permeable membrane [26]. A recent study [27] characterized the hydraulic conductance of ovine femoral and tibial periosteum using isolated samples and Darcy’s law. However, the sieving property of the periosteum to signaling molecules has not been determined in situ.
To fill the knowledge gap regarding periosteum permeability and to further elucidate the mechanisms by which muscle and bone communicate with each other, a novel imaging approach was developed to quantify the molecular transport through intact periosteum in situ using confocal microscopy. The murine tibial periosteum was first identified through reflected-light imaging, followed by temporally tracking the penetration of fluorescent tracers into the periosteum, from which the sieving property of the periosteum was obtained. An empirical relationship was established between molecular weight and the characteristic penetration time across the periosteum. These data helped us to analyze the rate-limiting steps controlling bone-muscle crosstalk and the likely molecular candidates responsible for such communication. The new approach and the quantitative data laid the foundation for further investigation of muscle-bone interactions in physiological and pathological conditions.
Materials and Methods
Fluorescent tracers
Four fluorescent tracers including sodium fluorescein (376Da, Sigma-Aldrich, St. Louis, MO), and fluorescein-conjugated dextrans with nominal molecular weights (MW) of 3kDa, 10kDa, and 40kDa (Molecular Probes/Invitrogen Corp, Eugene, OR) were selected as representatives of a spectrum of myokines. The tracer concentration of the tracer solution (0.01mg/mL for sodium fluorescein and 0.02mg/mL for the dextrans, respectively) was chosen based on our preliminary tests to ensure i) adequate fluorescence signal for tracer detection in the periosteum and ii) fluorescence intensity being proportional to the concentration of the tracer (no saturation or loss of fluorescence due to overcrowding [28]).
Specimen preparation
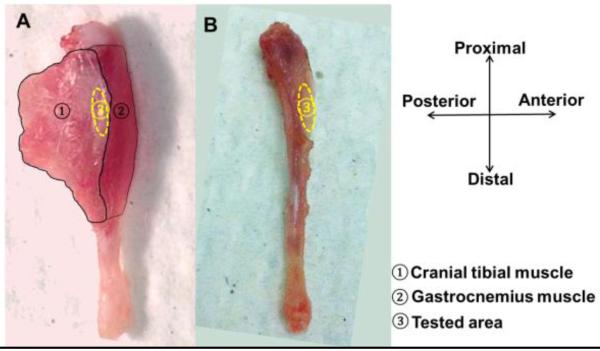
Twelve skeletally mature mice (C57BL/6J or Balb/cJ, five- to eight-month old) were sacrificed with carbon dioxide. Left tibiae were immediately harvested and cleansed of soft/adherent tissues using surgical scissors with care to keep the periosteum structurally intact (Fig. 1). Occasionally, the periosteum might become perforated during preparation. This could be identified easily by the presence of abnormally high-intensity spots in an otherwise uniform background during the tracer-tracking xz imaging (described below). Damaged samples were discarded. The samples were tested within 3h post-mortem to minimize permeability and other postmortem changes. For each tracer, three mice were tested. All animal procedures were approved by the Institutional Animal Use and Care Committee of the University of Delaware.
Figure 1.
Left murine tibia was shown with associated muscles intact (A) and muscles removed (B) to expose the imaging area on periosteum (anterior-medial surface 20%-30% distal from the tibial proximal end).
Experimental set-up
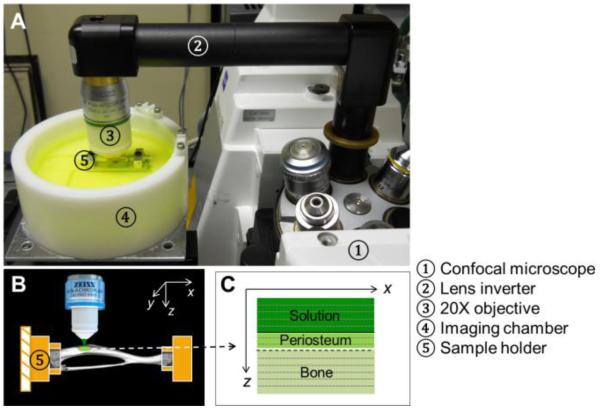
The two ends of left tibiae were rigidly fixed in a custom-made holder placed inside in an imaging chamber containing phosphate buffered saline (PBS, ~120mL) at room temperature (25°C) (Fig. 2A). The anterior-medial periosteal surface of the tibial shaft, located 20-30% distal from the proximal end, was selected for the experiment (Fig. 2B). This region was chosen because i) it is relatively flat and in focus within a microscope-imaging plane (xy) and ii) the local tracer penetration could be simplified as a one-dimensional (z) mathematic problem by neglecting bone curvature. After the region of interest on the periosteal surface was identified, the bone was imaged with an inverted confocal laser-scanning microscope (Zeiss LSM 510, Carl Zeiss Inc., Thornwood, NY) equipped with a lens inverter (LSM Technology, Etters, PA) and a 20× 1.0 numerical aperture water dipping lens (W Plan-Apochromat, Zeiss) (Fig. 2A). The “L” shaped lens inverter alters the laser path so that the tibia with its periosteal surface facing up could be imaged from the top.
Figure 2.
The experimental set-up: (A) A murine tibia was rigidly fixed in a sample holder in an imaging chamber; (B) The relatively flat anterior-medial periosteal surface was imaged under an inverted confocal microscope (Zeiss LSM 510); (C) Schematic of an xz image acquired by multiple line scans in the x direction at different z depths.
Validation and identification of the periosteum
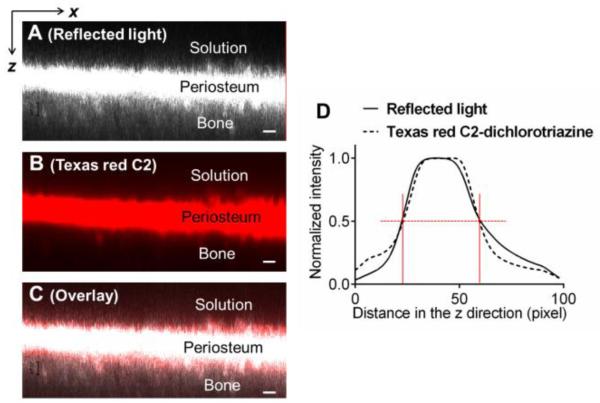
To identify the boundaries of the tibial periosteum, a xz scan under reflected light was captured using a series of line scans (512-pixels) at a rate of 3.93 sec/line as the focus plane was moved incrementally in the z direction, which was perpendicular to the periosteal surface, from the bathing solution towards the interior bone (Fig. 2C). The z-step was chosen to be 1.19 μm. Due to the presence of dense connective tissue in the periosteum [16-19], the exciting laser is easily reflected and a strong signal could be collected during the xz scanning using the reflected mode. To further confirm that this high-intensity layer in the xz reflected image was the periosteum, amine-targeted tissue staining was performed on samples in a separate experiment. Three freshly isolated tibiae with intact periosteum were first imaged under reflected light mode using 488 nm excitation at 7.5% laser power as described above (Fig. 3A), followed by immersion into Texas-red C2-dichlorotriazine dissolved in PBS (2 mg/mL). This reactive dye, with absorption/emission maxima of ~588/601 nm, readily reacts and binds to amine groups that are abundant in proteins found in periosteum. After 24-hours of dye incubation, the tibiae were washed multiple times with PBS for 0.5 hour to remove any residual dye solution and imaged under the confocal microscope using a 561 nm excitation wavelength (3% transmission). The periosteum, with its high content of proteins/amines, was stained red with the Texas red C2-dichlorotriazine dye (Fig. 3B). The position of the tibiae and the region of focus remained unchanged in the imaging chamber during the entire process, so that the red fluorescent and reflected signal channels could be overlaid for comparison (Fig. 3C). Normalized spatial intensity profiles were obtained for the two channels (detailed in the subsequent section of Characteristic Tracer Penetration Time). Our results clearly indicated the fidelity of using reflected light imaging to identify the periosteum (Figs. 3C and 3D). From the spatial intensity profiles (~100 z-steps), the two periosteal boundaries (vertical red lines) were identified at locations with the half maximal intensity value (red horizontal dotted lines, Fig. 3D), from which the periosteum thickness was calculated between the boundaries. These boundaries were also overlaid onto the time-series of images of tracer penetration to define the transport characteristics (detailed below).
Figure 3.
Periosteum was identified using reflected light imaging (A), which was confirmed by amine staining with a protein-binding Texas Red-C2 (B). Excellent agreements were found in the overlay panel (C) and the intensity profiles (D). Scale bar = 20 μm 20 μm
Time-series imaging of tracer penetration
Prior to imaging the tracer penetration into the periosteum, tibiae were isolated as described earlier in Specimen Preparation, followed by reflected light imaging of the periosteum. The bathing PBS was then removed from the imaging chamber and a pre-mixed fluorescent tracer solution (120 mL) was added to the imaging chamber using two 60 mL syringes. The fluid change process was performed with caution to avoid vibration and/or disturbance in the imaging system, and with a high speed (~ seconds) to minimize any drying that may alter the permeability of the periosteum. Continuous xz scanning along the depth of the periosteum was initiated immediately following the introduction of the tracer solution into the imaging chamber. The 488 nm laser power was set to be 5.5% and 7.5% for sodium fluorescein and dextrans, respectively. The length of scan lines was 256 pixels and the z-step was set to 6.15 μm. It usually took ~7 seconds to acquire a single xz scan consisting of 30 z-steps. The xz scan was repeated for up to 400 times, during which the tracer penetration into the periosteum was tracked for up to 8 hours. Representative snapshots of the tracer penetration across the periosteum were grouped at various time points using ImageJ software package (NIH) (Fig. 4).
Figure 4.

A representative time-series of xz scans showing the gradual penetration of dextran-3k (green color) into the periosteum at various time points. The periosteal boundaries were identified in reflected light imaging (not shown). Scale bar = 50 μm.
Characteristic tracer penetration time
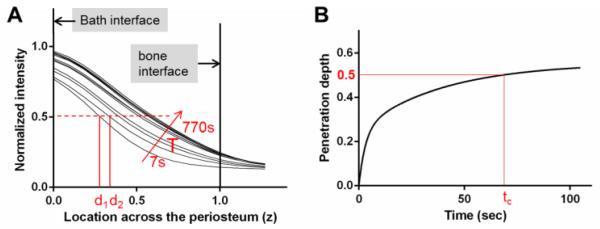
To quantify and compare penetration processes among various tracers, a characteristic transport time was obtained from each time-series scanning test. First, the two-dimensional xz scans at various time points (Fig. 4) were collapsed into one-dimensional intensity profiles along the periosteal depth (z) by averaging the intensity values for the 256 pixels in each x line. The intensity profiles were then normalized with the fluorescence intensity of the bath solution. For each test, the bath-periosteum and periosteum-bone interfaces were identified from the reflected-light imaging as described in the preceding section (Fig. 3D), and overlaid on the tracer penetration profiles, where the interface with the bathing liquid was denoted as z = 0 and the interface with bone as z = 1 (Fig. 5A). Second, the penetration depth at each time point (vertical red lines d1 and d2) was defined as the depth where tracer intensity reached 50% of the normalized tracer intensity (the red dotted line, Fig. 5A). Lastly, the penetration depths as were plotted function of time, from which the characteristic penetration time (tc), defined as the time lag when the penetration depth reached the mid-plane of the periosteum (red horizontal line at z = 0.5, Fig. 5B), were obtained and compared among groups.
Figure 5.
(A) Spatiotemporal profiles of tracer intensity (normalized to the bath intensity) as a function of the location across the periosteum (0 = interface with the bath; 1 = interface with bone) for a representative test with dextran-3k. For each time point, the penetration depth di was defined as the location with a normalized intensity of 0.5. (B) The characteristic penetration time (tc) was obtained as the time when the penetration depth reached the midplane of the periosteum (z = 0.5).
Effective transport rate for tracer penetration into periosteum
To further quantify transport dynamics, transport characteristics at the periosteum-solution interface (z = 0) were calculated from the spatiotemporal profiles (Fig. 5A). The concentration gradient (ΔC/Δz) at the interface was calculated at each time point. As a first approximation, we assumed that solute influx through this interface followed Fick’s law and was proportional to the concentration gradient and a transport rate constant k. As widely used in membrane transport problems [29-31], the first principle (mass conservation) can be applied to the half space consisting of the periosteum and underlying bone (Eq. 1), i.e., the influx of tracer from the bath through the interface z = 0 (the left side) equaled the tracer accumulation within the region of interest during each time step (the right side):
From Eq. 1, the effective transport rate k could be obtained as a function of time. Please note that although it has the same unit as diffusivity, k is an effective constant describing the total transport resulting from diffusion and other transport modes such as binding. The initial effective transport rates (k0) at time zero were obtained first. To compare the time-dependent changes in the transport process, normalized transport rate (k/k0) was plotted as a function of dimensionless time (t/τ), where τ is defined as τ = h2/k0 and h is the periosteal thickness.
Statistical analysis
Data were reported as means and standard deviations. One-way ANOVA followed by Tukey’s post hoc tests were performed to test the differences among four tracer groups, with p < 0.05 indicating a significant difference. Graph Pad Prism 6 (GraphPad Software, Inc. La Jolla, CA) was used.
Results
The spatiotemporal profiles demonstrated that tracer concentration increased inside the periosteum with time and the penetration depth also increased with time but with a decreasing rate (Figs. 5A and 5B). The characteristic penetration time for the particular dextran-3k experiment shown in Fig. 5B was found to be 66 sec.
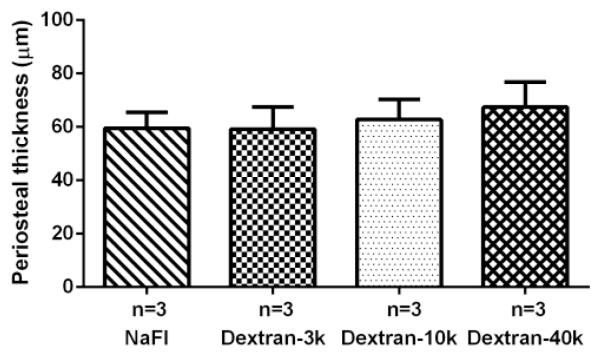
The periosteal thickness was comparable with no significant difference among the four tracer groups (sodium fluorescein: 59.5±6.0μm, dextran-3k 59.2±8.4μm, dextran-10k: 62.8±7.6μm, and dextran-40k: 67.4±9.5μm) (Fig. 6).
Figure 6.
The periosteal thickness was comparable with no significant difference among the four tracer groups (N=3/group).
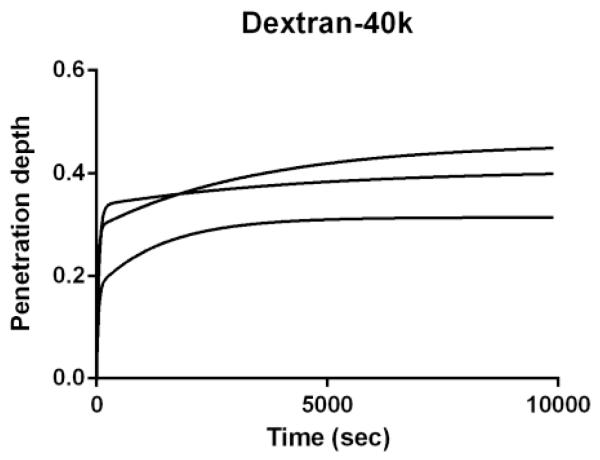
Periosteum exhibits the properties as a semi-permeable membrane, allowing the penetration of smaller tracers (Fig. 5) but effectively blocking the passage of 40kDa-dextran, the largest tracer tested in the study (Fig. 7). The penetration depth of 40kDa was limited to 40% of the outer periosteum, suggesting that the cut-off MW for periosteum was approximately 40kDa.
Figure 7.
Semi-permeable periosteum limited the penetration of dextran-40k within 40% of outer layer even after 8 hours of testing, suggesting the cut-off MW of periosteum to be ~40kDa.
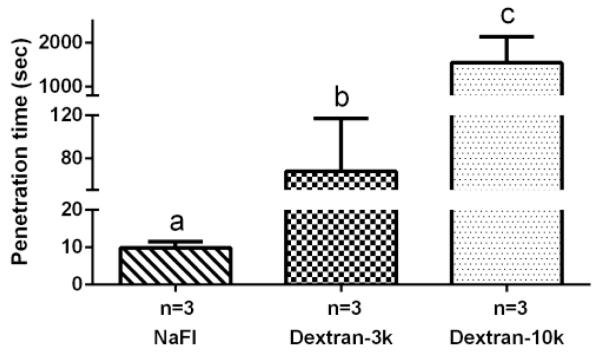
For the three smaller tracers, a significant difference was found in their characteristic penetration times, with sodium fluorescein penetrating the fastest (9.9±1.6 seconds), followed by dextran-3k (67.7±49.5 seconds), and dextran-10k (1547.3±593.9 seconds) (Fig. 8).
Figure 8.
The characteristic penetration time increased with tracer molecular weight. Sodium fluorescein: 376Da; dextran-3k: 3,000Da; dextran-10k: 10,000Da. Dextran-40k was not plotted here since it was blocked by periosteum. Pairs denoted with different letters (a,b,c) were significantly different ( p<0.05).
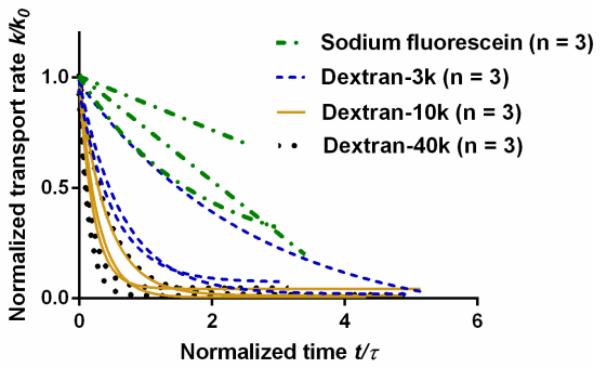
The initial effective transport rate k0 at the periosteal surface was found to decrease with tracer molecular weight (Fig. 9). Sodium fluorescein showed the highest initial transport rate (361 ± 104 μm2/s) while dextrans showed progressively reduced transport rates with increasing molecular weights (157 ± 85 μm2/s for dextran-3k, 101 ± 93 μm2/s for dextran-10k, and 17 ± 15 μm2/s for dextran-40k). As time went on, the effective transport rate declined, with the fastest drop for dextran-40k (Fig. 10).
Figure 9.
Initial transport rate at the periosteal surface decreased with tracer molecular weight. Sodium fluorescein: 376Da; dextran-3k: 3,000Da; dextran-10k: 10,000Da; dextran-40k: 40,000Da; Pairs denoted with different letters (a,b) were significantly different ( p<0.05).
Figure 10.
Transport rate at the periosteal surface decreased with time. Time is normalized with τ = h2/k0 where h is the periosteal thickness and k0 is the initial transport rate.
Discussion
The present study aimed to quantify the sieving properties of the periosteum, a dense connective tissue that acts as a transport barrier as well as a potential target for the signaling molecules. Bone and adjacent muscles are mechanically and biochemically coupled. In this study we focused on quantifying transport of signaling molecules from muscle towards bone. Although it is known that muscles release various functional molecules that are capable of regulating bone metabolism in vitro (Table 1), candidates responsible for the in vivo muscle-bone crosstalk have not been identified. Nor are the mechanisms by which these myokines transport between the tissues elucidated. Presumably, these signaling molecules can be carried away from muscle through extracellular space and/or through systemic vasculature [4,6]. The present study addressed the first transport pathway, especially signaling transport across periosteum covering the cortical bone.
Table 1. Candidate Myokines for Muscle-Bone Crosstalk.
| Myokine | MW (Da) | Effects | Bioactive life time (5 t1/2) |
Penetration time (tc) |
Likely candidate? |
|---|---|---|---|---|---|
| PGE2 | 353 | Promote bone formation [34] | 50 min [35] | 10 sec | ✓ |
| IGF-1 | 7, 600 | Stimulate bone formation [5, 6] | 100 hrs [36] | 13 min | ✓ |
| IL-15 | 12, 000 | Increase bone mass [4] | 5hrs [37] | 41 min | ✓ |
| FGF-2 | 18,000 | Stimulate bone formation [5, 6] | 38 hrs [38] | 2 hrs | ✓ |
| IL-6 | 23,000 | Bone resorption and turnover [4] | 35 min [39] | 5 hrs | X |
| TGF-β | 25, 000 | Regulate bone formation [5] | 10 min [40] | 6 hrs | X |
Because periosteal permeability determines how quick molecules move within the tissue and periosteal thickness is an important physical parameter for permeability, we first determined the periosteal thickness in murine tibiae. Using the xz reflected light imaging, the periosteal thickness was found to be ~ 60μm in adult mice (five to eight-month old, Fig. 6). This result was consistent with previous findings of periosteal thickness (~60μm) from murine femurs using hematoxylin and eosin (H&E) staining and DIC light microscopy [17]. A thinner cambium layer (~40μm) was obtained using confocal z-stack imaging in intact murine tibiae treated with calcein labeling (to stain the bone surface) and nuclei staining (to stain cells) [32]. The consistency of the periosteal thickness measurements obtained using histological sections [17] and confocal microscopy (this study and ref. [34]) alleviated the concerns of “stretching” artifacts in the axial imaging [33] and confirmed the fidelity of the xz confocal scanning imaging approach. This may be attributed to the fact that periosteum is a non-mineralized tissue and thus the optical index mismatch between the tissue and the aqueous solution is not as severe as that presented in bone [33].
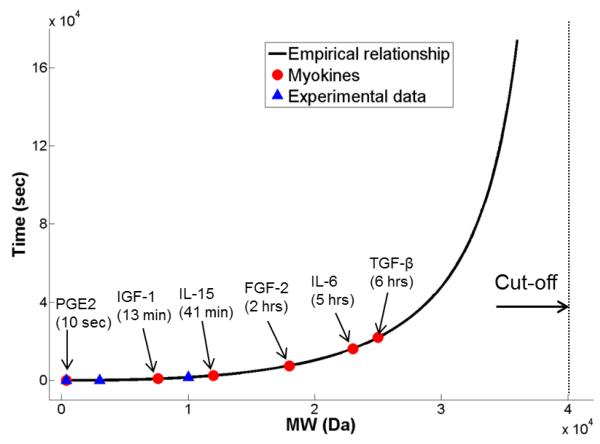
The most important result from this study was that periosteum serves as a semi-permeable sieve with a cut-off MW of ~40kDa. Our tests demonstrated that the penetration of molecules into the periosteum took a longer time with increasing molecular weight and the transport was effectively blocked for dextrans with MW of 40kDa (Figs. 7 and 8). Although we only performed three experiments for each tracer, the achieved power in statistical analysis was close to 1 because of the high effective sizes in the characteristic transport time among the four tracer groups (Fig. 8). The following empirical relationship was found to best fit the experimental data with the cut-off behavior:
| (Eq. 2) |
The equation stipulates that the characteristic transport time through periosteum approaches infinite as MW increases toward 40kDa. Applying Eq. 2 to myokines identified in vitro and in vivo [4-6], their characteristic penetration times were found to vary between 10 sec (PGE2) and 6 hours (TGF-β) (Fig. 11, Table 1).
Figure 11.
Penetration times for several myokines in periosteum were predicted based on the empirical relationship (Eq. 2 in the text), which accounted for the experimental data using four tracers of various molecular weight (MW) as well as the observed cut-off MW of 40kDa for periosteum
During bone-muscle crosstalk, there are two competing time constrains for myokines, i.e., they should be able to penetrate and reach their target bone (described by penetration time) before the ending of their bioactive life time. Assuming that these molecules are degraded and cleared from the body in an exponential fashion, their bioactive concentration will be decreased to a negligible value (3.1%) after five half-life time (5t1/2). It is thus reasonable to assume for an effective messenger that its penetration time tc should be less than 5t1/2. We find that some myokines including PGE2, IGF-1, IL-15 and FGF-2 are predicted to satisfy this criterion and may be likely candidates for muscle-bone crosstalk, while IL-6 and TGF-β do not meet the criterion (Table 1). Interestingly, periosteum was shown to express abundant receptors for IGF-1 and FGF-2 [6]. Although this result provides preliminary guidelines for designing future in vivo experiments to identify candidate myokines for muscle-bone crosstalk, we should be aware of the assumptions and limitations for the current result. The predicted transport times for the myokines are extrapolated from the tracer data based on molecular weight only (Eq. 2). The structure, chemistry, polarity, and charge of the myokines, which may be quite different from those of the tracers used herein, could affect their interactions with extracellular matrix and cell surface receptors and impact their transport, storage, and bioavailability during tissue crosstalk. The efficacy of muscle-bone crosstalk is also dependent on the relative abundance and potency of the signaling molecules. In addition, convections induced by muscle contraction could possibly make the larger molecules move faster. These confounding factors, although beyond the scope of this study, need to be studied further in vivo.
Despite being a molecular sieve, the periosteum is unlikely to be the rate-limiting step for smaller signaling molecules during muscle-bone crosstalk through the extracellular transport pathway consisting of muscle tissue, periosteum, and cortical bone tissue. Without any available solute permeability measurements in muscle tissue, it is impossible to identify which tissue is the rate-limiting step in this pathway. However, comparing the initial transport rates in periosteum (t = 0) and those in bone (Table 2), the permeability of the two tested smaller tracers (sodium fluorescein and dextran-3k) is more than 10-fold higher in periosteum than in bone. For the larger linear dextran tracers (10kDa and 40kDa), their transport rates were not measured in bone. As demonstrated in previous study [41], they are expected to have smaller permeability than those of globular proteins with similar MWs (parvalbumin 12.3kDa, 15.7μm2/s and ovalbumin 43kDa, 6.5μm2/s). Therefore, the initial transport rates of the dextrans-10k and dextran-40k in periosteum are at least 2.5- and 6-fold higher than those in bone, respectively (Table 2). However, after the lapse of one time constant τ = h2/k0, the periosteal transport rates for smaller tracers (376Da, 3kDa) remain higher than those in bone, but those for larger tracers decrease to the levels that are comparable to those in bone (Table 2). Overall, periosteum may be a major barrier to larger molecules (≥10kDa) much like bone, while it is much more permeable to small molecules (≤3000Da) than bone is.
Table 2. Comparison of Solute Permeability in Periosteum and Bone Tissue.
| MW (Da) | Tracers |
*Periosteum (μm2/s) (t = 0) |
Periosteum (μm2/s) (t = τ) |
#Cortical bone (μm2/s) |
|---|---|---|---|---|
| 376 | Sodium | 360.6 ± 103.7 | 270.1 ± 93.3 | 33.0 ± 6.0 [33] |
| fluorescein | 29.5 ± 4.6 [41] | |||
| 3,000 | Dextran-3k | 156.9 ± 85.4 | 47.2 ± 19.2 | 12.8 ± 3.2 [41] |
| 10,000 | Dextran-10k | 101.1 ± 93.3 | 9.9 ± 11.0 | <15.7 [41] |
| 40,000 | Dextran-40k | 16.5 ± 15.3 | 1.6 ± 2.1 | <6.5 [41] |
Note: For periosteum, the effective transport rates at time t = 0 (k0) and t = τ are given. The time constant τ is defined as h2/k0; and h is the periosteal thickness.
Solute permeability over the cortical tissue was estimated based on the permeability measured in the lacunar-canalicular system (LCS) as indicated in the references and the porosity of the LCS in cortical bone, assumed to be 10% [42].
It is not clear why the effective transport rates in periosteum declined with time, especially for larger dextran molecules (Fig. 10). As mentioned earlier, the effective transport rate accounts for diffusion as well as other transport modes involving, for example, binding of the tracer molecules to the fibrous extracellular matrix and to the surface receptors of the resident cells in periosteum. In fact, the observation of temporal decrease of the effective transport rate suggests the presence of the non-diffusion transport modes. Previous work demonstrated that dextrans could specifically bind to the mannose and DC-SIGN family receptors [43, 44]. As more and more mobile molecules are bound to ECM or taken inside cells through endocytosis, the available molecules decrease for diffusive transport, leading to the decline of the effective transport rate (Fig. 10). Note that the experiments were undertaken in room temperature (25°C), at which solute diffusivity was anticipated to be 4% smaller and the cell-mediated transport might also be lower compared with measurements in body temperature (37°C). Therefore, there is a need to test the transport of myokines under in vivo conditions in future.
There are several additional limitations in the present study. i) We focused only on the local pathways for the muscle-derived factors entering the bone tissue through the periosteum. The other complementary pathway is that myokines, after being released to extracellular space, are resorbed into the vasculature, through which they are delivered into bone tissue. Although the semi-permeable capillary wall (~1-2 μm thick) is one-order of magnitude thinner than the periosteum (~60 μm), the plasma concentrations of the myokines are expected to be much lower than those in local muscle tissues due to molecular dilution and binding to plasma proteins. Therefore, we believe that the myokines are more likely to exert their effects on adjacent bone tissues through the local (i.e., direct penetration into/through periosteum) rather than via a systemic vascular effect. ii) The transport of myokines within muscles was not considered in this study. We only investigated their penetration into the periosteum after released from the muscles. Solute transport in muscles at either resting or activated situation is warranted for future study. iii) The dependency of the periosteum permeability on animal age, bone type/site and anatomical location, although beyond the scope of the current study, needs further investigation. iv) The current study utilized fluorescent tracers as surrogates for myokines and mathematical extrapolation (Eq. 2) to predict the transport times of various myokines. In vivo experiments using fluorescently-tagged myokine molecules are needed to confirm the results obtained herein. These experiments will allow more accurate modeling of the sieving properties of periosteum to bioactive globular signals.
Despite these limitations, the present study provides quantitative data on the transport of myokine-mimicking tracers through the periosteum, which helped to identify likely signaling candidates for muscle-bone cross-talk. The current approach could be expanded to further study muscle-bone cross-talk under more physiological conditions in healthy and diseased states. In particularly, the study provides a foundation for further studies of cellular and molecular interactions between muscle and bone, which may lead to new therapeutic strategies for musculoskeletal repair.
Highlights.
A novel imaging approach was developed to characterize the transport of myokine-mimicking tracers across murine tibial periosteum
Periosteal boundaries and tracer penetration were measured in situ with reflected-light and confocal time-series imaging, respectively
Periosteum was found to be semi-permeable, allowing penetration of 376Da-sodium fluorescein and 3kDa- and 10kDa-dextrans while blocking that of 40kDa-dextran
- The characteristic penetration time (tc) through periosteum was found to increase with tracer molecular weight (MW):
Candidates for muscle-bone crosstalk (PGE2, IGF-1, IL-15 and FGF-2) were identified by comparing their predicted periosteal penetration and bioactive times
Acknowledgements
This study was supported by NIH grants (RO1AR054385, P30GM103333).
Funding sources:
NIH (RO1AR054385, P30GM103333)
Footnotes
Disclosures: All authors state that they have no conflicts of interest.
Publisher's Disclaimer: This is a PDF file of an unedited manuscript that has been accepted for publication. As a service to our customers we are providing this early version of the manuscript. The manuscript will undergo copyediting, typesetting, and review of the resulting proof before it is published in its final citable form. Please note that during the production process errors may be discovered which could affect the content, and all legal disclaimers that apply to the journal pertain.
References
- 1.Frost HM, Schonau E. The “muscle-bone unit” in children and adolescents: a 2000 overview. J Pediatr Endocrinol Metab. 2000;13(6):571–90. doi: 10.1515/jpem.2000.13.6.571. [DOI] [PubMed] [Google Scholar]
- 2.DiGirolamo DJ, D.P.K., Esser KA. Bone and skeletal muscle: neighbors with close ties. Journal of Bone and Mineral Research. 2013;28:1509–18. doi: 10.1002/jbmr.1969. [DOI] [PMC free article] [PubMed] [Google Scholar]
- 3.Kaji H. Linkage between muscle and bone: common catabolic signals resulting in osteoporosis and sarcopenia. Curr Opin Clin Nutr Metab Care. 2013;16(3):272–7. doi: 10.1097/MCO.0b013e32835fe6a5. [DOI] [PubMed] [Google Scholar]
- 4.Hamrick MW. The skeletal muscle secretome: an emerging player in muscle-bone crosstalk. Bonekey Rep. 2012;1:60. doi: 10.1038/bonekey.2012.60. [DOI] [PMC free article] [PubMed] [Google Scholar]
- 5.Willett NJ, Li MT, Uhrig BA, Boerckel JD, Huebsch N, Lundgren TL, Warren GL, Guldberg RE. Attenuated human bone morphogenetic protein-2-mediated bone regeneration in a rat model of composite bone and muscle injury. Tissue Eng Part C Methods. 2013;19(4):316–25. doi: 10.1089/ten.tec.2012.0290. [DOI] [PMC free article] [PubMed] [Google Scholar]
- 6.Hamrick MW, McNeil PL, Patterson SL. Role of muscle-derived growth factors in bone formation. J Musculoskelet Neuronal Interact. 2010;10(1):64–70. [PMC free article] [PubMed] [Google Scholar]
- 7.Tanaka K, Matsumoto E, Higashimaki Y, Sugimoto T, Seino S, Kaji H. FAM5C is a soluble osteoblast differentiation factor linking muscle to bone. Biochem Biophys Res Commun. 2012;418(1):134–9. doi: 10.1016/j.bbrc.2011.12.147. [DOI] [PubMed] [Google Scholar]
- 8.Jahn K, Lara-Castillo N, Brotto L, Mo CL, Johnson ML, Brotto M, Bonewald LF. Skeletal muscle secreted factors prevent glucocorticoid-induced osteocyte apoptosis through activation of beta-catenin. Eur Cell Mater. 2012;24:197–209. doi: 10.22203/ecm.v024a14. discussion 209-10. [DOI] [PMC free article] [PubMed] [Google Scholar]
- 9.Shah K, Majeed Z, Jonason J, O’Keefe RJ. The role of muscle in bone repair: the cells, signals, and tissue responses to injury. Curr Osteoporos Rep. 2013;11(2):130–5. doi: 10.1007/s11914-013-0146-3. [DOI] [PMC free article] [PubMed] [Google Scholar]
- 10.Hashimoto N, Kiyono T, Wada MR, Umeda R, Goto Y, Nonaka I, Shimizu S, Yasumoto S, Inagawa-Ogashiwa M. Osteogenic properties of human myogenic progenitor cells. Mech Dev. 2008;125(3-4):257–69. doi: 10.1016/j.mod.2007.11.004. [DOI] [PubMed] [Google Scholar]
- 11.Gersbach CA, Guldberg RE, Garcia AJ. In vitro and in vivo osteoblastic differentiation of BMP-2- and Runx2-engineered skeletal myoblasts. J Cell Biochem. 2007;100(5):1324–36. doi: 10.1002/jcb.21118. [DOI] [PubMed] [Google Scholar]
- 12.Sassoli C, Pini A, Chellini F, Mazzanti B, Nistri S, Nosi D, Saccardi R, Quercioli F, Zecchi-Orlandini S, Formigli L. Bone marrow mesenchymal stromal cells stimulate skeletal myoblast proliferation through the paracrine release of VEGF. PLoS One. 2012;7(7):e37512. doi: 10.1371/journal.pone.0037512. [DOI] [PMC free article] [PubMed] [Google Scholar]
- 13.Juffer P, Jaspers RT, Lips P, Bakker AD, Klein-Nulend J. Expression of muscle anabolic and metabolic factors in mechanically loaded MLO-Y4 osteocytes. Am J Physiol Endocrinol Metab. 2012;302(4):E389–95. doi: 10.1152/ajpendo.00320.2011. [DOI] [PubMed] [Google Scholar]
- 14.Evans SF, Chang H, Knothe Tate ML. Elucidating multiscale periosteal mechanobiology: a key to unlocking the smart properties and regenerative capacity of the periosteum? Tissue Eng Part B Rev. 2013;19(2):147–59. doi: 10.1089/ten.teb.2012.0216. [DOI] [PMC free article] [PubMed] [Google Scholar]
- 15.Malizos KN, Papatheodorou LK. The healing potential of the periosteum molecular aspects. Injury. 2005;3(Suppl 3):S13–9. doi: 10.1016/j.injury.2005.07.030. [DOI] [PubMed] [Google Scholar]
- 16.Allen MR, Hock JM, Burr DB. Periosteum: biology, regulation, and response to osteoporosis therapies. Bone. 2004;35(5):1003–12. doi: 10.1016/j.bone.2004.07.014. [DOI] [PubMed] [Google Scholar]
- 17.Martin CD, Jimenez-Andrade JM, Ghilardi JR, Mantyh PW. Organization of a unique net-like meshwork of CGRP+ sensory fibers in the mouse periosteum: implications for the generation and maintenance of bone fracture pain. Neurosci Lett. 2007;427(3):148–52. doi: 10.1016/j.neulet.2007.08.055. [DOI] [PMC free article] [PubMed] [Google Scholar]
- 18.Evans SF, Docheva D, Bernecker A, Colnot C, Richter RP, Knothe Tate ML. Solid-supported lipid bilayers to drive stem cell fate and tissue architecture using periosteum derived progenitor cells. Biomaterials. 2013;34(8):1878–87. doi: 10.1016/j.biomaterials.2012.09.024. [DOI] [PubMed] [Google Scholar]
- 19.Squier CA, Ghoneim S, Kremenak CR. Ultrastructure of the periosteum from membrane bone. J Anat. 1990;171:233–9. [PMC free article] [PubMed] [Google Scholar]
- 20.Arnsdorf EJ, Jones LM, Carter DR, Jacobs CR. The periosteum as a cellular source for functional tissue engineering. Tissue Eng Part A. 2009;15(9):2637–42. doi: 10.1089/ten.tea.2008.0244. [DOI] [PMC free article] [PubMed] [Google Scholar]
- 21.De Bari C, Dell’Accio F, Vanlauwe J, Eyckmans J, Khan IM, Archer CW, Jones EA, McGonagle D, Mitsiadis TA, Pitzalis C, Luyten FP. Mesenchymal multipotency of adult human periosteal cells demonstrated by single-cell lineage analysis. Arthritis Rheum. 2006;54(4):1209–21. doi: 10.1002/art.21753. [DOI] [PubMed] [Google Scholar]
- 22.Johnson MW, Chakkalakal DA, Harper RA, Katz JL, Rouhana SW. Fluid flow in bone in vitro. J Biomech. 1982;15(11):881–5. doi: 10.1016/0021-9290(82)90054-9. [DOI] [PubMed] [Google Scholar]
- 23.Salzstein RA, Pollack SR. Electromechanical potentials in cortical bone--II. Experimental analysis. J Biomech. 1987;20(3):271–80. doi: 10.1016/0021-9290(87)90294-6. [DOI] [PubMed] [Google Scholar]
- 24.Li GP, Bronk JT, An KN, Kelly PJ. Permeability of cortical bone of canine tibiae. Microvasc Res. 1987;34(3):302–10. doi: 10.1016/0026-2862(87)90063-x. [DOI] [PubMed] [Google Scholar]
- 25.Gardinier JD, Townend CW, Jen KP, Wu Q, Duncan RL, Wang L. In situ permeability measurement of the mammalian lacunar-canalicular system. Bone. 2010;46(4):1075–81. doi: 10.1016/j.bone.2010.01.371. [DOI] [PMC free article] [PubMed] [Google Scholar]
- 26.Qin YX, Kaplan T, Saldanha A, Rubin C. Fluid pressure gradients, arising from oscillations in intramedullary pressure, is correlated with the formation of bone and inhibition of intracortical porosity. J Biomech. 2003;36(10):1427–37. doi: 10.1016/s0021-9290(03)00127-1. [DOI] [PubMed] [Google Scholar]
- 27.Evans SF, Parent JB, Lasko CE, Zhen X, Knothe UR, Lemaire T, Knothe Tate ML. Periosteum, bone’s “smart” bounding membrane, exhibits direction-dependent permeability. J Bone Miner Res. 2013;28(3):608–17. doi: 10.1002/jbmr.1777. [DOI] [PubMed] [Google Scholar]
- 28.Guilbault GG. Practical Fluorescence. Second ed. Marcel Dekker, Inc.; New York: 1990. p. 30. [Google Scholar]
- 29.Ho NF, Park J, Morozowich W, Higuchi WI. A physical model for the simultaneous membrane transport and metabolism of drugs. J Theor Biol. 1976;61(1):185–93. doi: 10.1016/0022-5193(76)90112-0. [DOI] [PMC free article] [PubMed] [Google Scholar]
- 30.Wang GP, Shi HC, Shen ZS. Influence of osmotic distillation on membrane absorption for the treatment of high strength ammonia wastewater. J Environ Sci (China) 2004;16(4):651–5. [PubMed] [Google Scholar]
- 31.Zhang W, Li J, Chen G, You W, Jiang Y, Sun W. Experimental study of mass transfer in membrane absorption process using membranes with different porosities. Industrial and Engineering Chemistry Research. 2010;49:6641–6648. [Google Scholar]
- 32.Sakai D, Kii I, Nakagawa K, Matsumoto HN, Takahashi M, Yoshida S, Hosoya T, Takakuda K, Kudo A. Remodeling of actin cytoskeleton in mouse periosteal cells under mechanical loading induces periosteal cell proliferation during bone formation. PLoS One. 2011;6(9):e24847. doi: 10.1371/journal.pone.0024847. [DOI] [PMC free article] [PubMed] [Google Scholar]
- 33.Wang L, Wang Y, Han Y, Henderson SC, Majeska RJ, Weinbaum S, Schaffler MB. In situ measurement of solute transport in the bone lacunar-canalicular system. Proc Natl Acad Sci U S A. 2005;102(33):11911–6. doi: 10.1073/pnas.0505193102. [DOI] [PMC free article] [PubMed] [Google Scholar]
- 34.Mo C, Romero-Suarez S, Bonewald L, Johnson M, Brotto M. Prostaglandin E2: from clinical applications to its potential role in bone-muscle crosstalk and myogenic differentiation. Recent Pat Biotechnol. 2012;6(3):223–9. doi: 10.2174/1872208311206030223. [DOI] [PMC free article] [PubMed] [Google Scholar]
- 35.Brochhausen C, Zehbe R, Watzer B, Halstenberg S, Schubert H, Kirkpatrick CJ. PLGA-microspheres as a release-system for sginalling molecules in tissue engineering-first results of prostaglandin E2 release. European Cells and Materials. 2007;14:57. [Google Scholar]
- 36.Grahnen A, Kastrup K, Heinrich U, Gourmelen M, Preece MA, Vaccarello MA, Guevara-Aguirre J, Rosenfeld RG, Sietnieks A. Pharmacokinetics of recombinant human insulin-like growth factor I given subcutaneously to healthy volunteers and to patients with growth hormone receptor deficiency. Acta Paediatr Suppl. 1993;82(Suppl 391):9–13. doi: 10.1111/j.1651-2227.1993.tb12918.x. discussion 14. [DOI] [PubMed] [Google Scholar]
- 37.Berger C, Berger M, Hackman RC, Gough M, Elliott C, Jensen MC, Riddell SR. Safety and immunologic effects of IL-15 administration in nonhuman primates. Blood. 2009;114(12):2417–26. doi: 10.1182/blood-2008-12-189266. [DOI] [PMC free article] [PubMed] [Google Scholar]
- 38.Beenken A, Mohammadi M. The FGF family: biology, pathophysiology and therapy. Nat Rev Drug Discov. 2009;8(3):235–53. doi: 10.1038/nrd2792. [DOI] [PMC free article] [PubMed] [Google Scholar]
- 39.Toft AD, Falahati A, Steensberg A. Source and kinetics of interleukin-6 in humans during exercise demonstrated by a minimally invasive model. Eur J Appl Physiol. 2011;111(7):1351–9. doi: 10.1007/s00421-010-1755-5. [DOI] [PubMed] [Google Scholar]
- 40.Kaminska B, Wesolowska A, Danilkiewicz M. TGF beta signalling and its role in tumour pathogenesis. Acta Biochim Pol. 2005;52(2):329–37. [PubMed] [Google Scholar]
- 41.Li W, You L, Schaffler MB, Wang L. The dependency of solute diffusion on molecular weight and shape in intact bone. Bone. 2009;45(5):1017–23. doi: 10.1016/j.bone.2009.07.076. [DOI] [PMC free article] [PubMed] [Google Scholar]
- 42.Bartel DL, Davy DT, Keaveny TM. Orthopaedic Biomechanics: Chapter 1 The Musculoskeletal System. Pearson education, Inc.; 2006. p. 8. [Google Scholar]
- 43.Sallusto F, Cella M, Danieli C, Lanzavecchia A. Dendritic cells use macropinocytosis and the mannose receptor to concentrate macromolecules in the major histocompatibility complex class II compartment: downregulation by cytokines and bacterial products. J Exp Med. 1995;182(2):389–400. doi: 10.1084/jem.182.2.389. [DOI] [PMC free article] [PubMed] [Google Scholar]
- 44.Garcia-Nieto S, Johal RK, Shakesheff KM, Emara M, Royer PJ, Chau DY, Shakib F, Ghaemmaghami AM. Laminin and fibronectin treatment leads to generation of dendritic cells with superior endocytic capacity. PLoS One. 2010;5(4):e10123. doi: 10.1371/journal.pone.0010123. [DOI] [PMC free article] [PubMed] [Google Scholar]


