

Abstract
Background/Purpose
Serum neurokininA, chromograninA, serotonin, and pancreastatin reflect tumor burden in neuroendocrine tumors. We sought to determine whether their levels correlate with survival in surgically-managed small bowel (SBNETs) and pancreatic neuroendocrine tumors (PNETs).
Methods
Clinical data were collected with IRB approval for patients undergoing surgery at one center. Progression-free (PFS) and overall survival (OS) were from time of surgery. Event times were estimated by Kaplan-Meier method. Pre- and postoperative laboratory values were tested for correlation with outcomes. A multivariate Cox model adjusted for confounders.
Results
Included were 98 SBNETs and 78 PNETs. Median follow-up was 3.8 years; 62% had metastatic disease. SBNETs had lower median PFS than PNETs(2.0 vs. 5.6 years, p<0.01). Median OS was 10.5 years for PNETs and not reached for SBNETs. Preoperative neurokininA did not correlate with PFS or OS. Preoperative serotonin correlated with PFS but not OS. Higher levels of preoperative chromograninA and pancreastatin showed significant correlation with worse PFS and OS(p<0.05). After multivariate adjustment for confounders, pre- and postoperative pancreastatin remained independently predictive of worse PFS and OS(p<0.05). Whether pancreastatin normalized postoperatively further discriminated outcomes. Median PFS was 1.7 years in patients with elevated preoperative pancreastatin versus 6.5 years in patients with normal levels(p<0.001).
Conclusions
Higher pancreastatin levels are significantly associated with worse PFS and OS in SBNETs and PNETs. This effect is independent of age, primary tumor site, and presence of nodal or metastatic disease. Pancreastatin provides valuable prognostic information and identifies surgical patients at high risk of recurrence who could benefit most from novel therapies.
Introduction
Small bowel (SBNETs) and pancreatic (PNETs) neuroendocrine tumors have an annual incidence in the United States of 1-2 per 100,000.1,2 Surgery represents the primary treatment for SBNETs and PNETs, and benefits even patients with advanced metastases.2-13 Despite effective treatments and long overall survival times, tumor recurrence occurs frequently after resection.7 Medical treatment with somatostatin analogues, such as octreotide, is indicated in patients with symptomatic or recurrent disease.12 Octreotide promotes disease stabilization and prolongs survival in selected patients.7,14 Additional treatments, such as peptide-receptor radionuclide therapy in SBNETs and PNETs and everolimus or sunitinib in PNETs can help patients with recurrent, extensive, or refractory disease.15-17
The difficulty of distinguishing patients with indolent disease from those likely to experience early progression and death remains a major problem in neuroendocrine tumor management.18 In addition to features visible on cross-sectional imaging, serum levels of tumor markers inform prognosis in SBNETs and PNETs. Neuroendocrine cells secrete proteins and amines such as chromograninA, neurokininA, pancreastatin, and serotonin, which reflect extent of disease and can herald progression.19-23 Of these, chromograninA is the most widely used, and represents the only tumor marker recommended by current NET management guidelines2,3,12,24. Despite these endorsements, chromograninA has important limitations for predicting NET prognosis, including false elevation due to comorbid conditions or medications, and lack of assay standardization.24-26 Pancreastatin has been proposed as an alternative biomarker, as its levels are less susceptible to non-specific effects, the assay is more standardized, and early experience indicated a correlation with tumor burden and outcomes.25-30
Improving biomarker-based prognostication through long-term correlation with outcomes at specialized centers is identified as a priority in NET treatment.18 In addition to improving the accuracy of discussions with patients, distinguishing high-risk patients before surgery allows inclusion in clinical trials of those most likely to benefit. To improve prognostication in neuroendocrine disease, we therefore sought to determine whether pre- and postoperative serum levels of these four tumor markers correlate with outcomes in a large cohort of surgically-managed SBNET and PNET patients with long-term follow-up.
Patients and Methods
Clinical data for patients undergoing surgery for SBNETs and PNETs at a single center between 1999-2013 were retrospectively reviewed under an Institutional Review Board-approved protocol. The operative approach was as previously described.31 Pre- and postoperative laboratory values were recorded and clinical notes and radiology reports were reviewed for dates of surgery, disease progression, last follow-up, and death. All event times were defined as from the date of surgery. Pancreastatin was measured with a C-terminal specific radioimmunoassay as described.25 Laboratory values were log-transformed due to skew and tested both as continuous and categorical (normal range vs. elevated) variables for correlation with progression-free (PFS) and overall survival (OS). Median event times were estimated using the Kaplan-Meier method and P values calculated using Log-Rank test.32 Follow-up times were estimated by reverse Kaplan-Meier method.33 For laboratory values showing significant association with outcomes(p<0.05) on univariate analysis, multivariate Cox models adjusted for effects of confounding factors.34 Proportional hazards assumptions were verified. Patient characteristics were compared using Fisher Exact or Wilcoxon Rank-Sum tests. Pre- and postoperative laboratory values were compared by Wilcoxon Sign-Rank test. All analyses used R v.3.0.1(Vienna, Austria).
Results
Patient Characteristics
Included were 98 SBNET and 78 PNET patients (n=176), 46% of whom were female. The median age at surgery was 58 years and 62% had metastatic disease. The median time from diagnosis to surgery was 65 days. Significant differences existed between SBNET and PNET patients in median age at surgery, the proportion who were female, and the proportion with low-grade, node-positive, or metastatic disease (Table 1). Median follow-up was 3.8 years and was similar between SBNET and PNET patients. Median PFS was 3.3 years overall, but was significantly shorter among patients with SBNETs compared to PNETs (2.0 vs. 5.6 years, p<0.01). Despite high rates of tumor progression, estimated median OS was 10.5 years in patients with PNETs, and was not reached in SBNET patients (Figure 1). Five-year OS was 79% in SBNETs and 80% in PNETs. In 108 patients with metastatic disease at the time of surgery, 5-year OS was 76% for SBNETs and 71% for PNETs.
Table 1.
Patient Characteristics and Survival.
| Combined n=176 | SBNETs n=98 | PNETs n=78 | SBNETs vs. PNETs | |
|---|---|---|---|---|
| P value | ||||
| Age at Surgery, Median Years (Range) | 58.2 (22.2-85.3) | 60.4 (27.6-85.3) | 54.8 (22.2-81.5) | <0.01 |
| Female (%) | 46.0 | 38.8 | 55.1 | 0.03 |
| Node Positive Disease (%) | 75.6 | 92.6 | 52.9 | <0.001 |
| Metastatic Disease (%) | 62.1 | 81.4 | 37.7 | <0.001 |
| Low-Grade Tumor (%) | 76.4 | 85.2 | 65.2 | 0.01 |
| Intermediate-Grade Tumor (%) | 21.0 | 14.8 | 29.0 | 0.047 |
| High-Grade Tumor (%) | 2.5 | 0.0 | 5.8 | 0.047 |
| Follow-up, Median Years (95% CI) | 3.8 (3.0-4.5) | 3.7 (2.7-4.4) | 4.2 (3.2-5.6) | 0.2 |
| PFS, Median Years (95% CI) | 3.3 (2.5-5.6) | 2.0 (1.7-4.2) | 5.6 (3.6-NA) | <0.01 |
| OS, Median Years (95% CI) | 10.5 (10.0-NA) | NA (9.1-NA) | 10.5 (10.0-NA) | 0.9 |
SBNET: Small bowel neuroendocrine tumor; PNET: Pancreatic neuroendocrine tumor; n: number; CI: Confidence interval; NA: Cannot be estimated.
Figure 1.
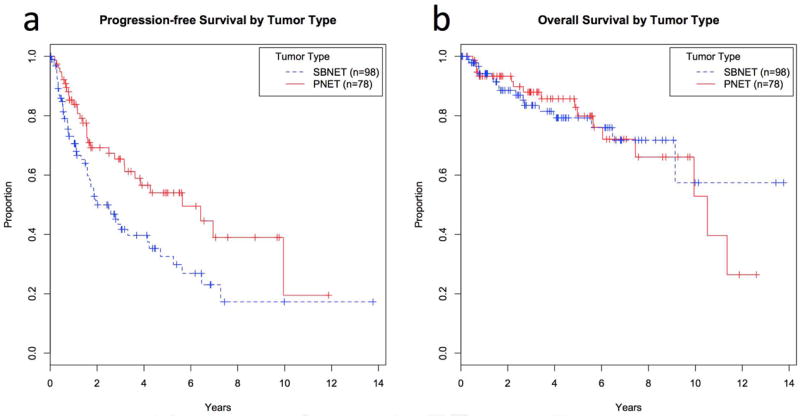
Progression-free (a) and overall survival (b) by primary tumor type. SBNETs are shown with dashed lines and PNETs with solid lines. Progression-free survival was significantly lower among SBNET patients. SBNET: Small bowel neuroendocrine tumor; PNET: Pancreatic neuroendocrine tumor.
Laboratory Values and Outcomes
To understand their relation to outcomes, preoperative serum levels of tumor markers as well as clinical factors were tested for univariate association with PFS and OS. As expected, N and M stage, as well as tumor grade showed significant correlations with PFS and OS(Table 2). Lymph node ratio, T-stage, and primary site showed significant associations with PFS, while age at surgery significantly correlated with OS. Preoperative labs were collected a median of 30 days prior to surgery(interquartile range 16-57 days). Of 176 patients, preoperative chromograninA(n=121), pancreastatin(n=130), and serotonin(n=137) were available for most patients, while neurokininA(n=71) was less-commonly measured. Laboratory values were tested as continuous variables for association with outcomes. The risk of progression or death did not correlate with preoperative neurokininA levels(PreopNKA) (p>0.4) (Table 2). Although neurokininA was previously reported to correlate with OS in 35 midgut NET patients,19 even with analysis limited to SBNET patients with PreopNKA levels(n=52), no association with PFS or OS existed(p>0.4). Preoperative serotonin levels were significantly associated with PFS, but not OS(p=0.02 and 0.9). In contrast, preoperative chromograninA(PreopCgA) and pancreastatin(PreopPST) levels showed significant correlation with both PFS and OS(p<0.05). These results suggested that PreopCgA and PreopPST offer prognostic insight in SBNETs and PNETs.
Table 2.
Univariate analysis of association with progression-free (PFS) and overall survival (OS) by Log-Rank test. Tumor markers were analyzed both as continuous log-transformed variables and as categorical elevated vs. normal variables. Preoperative pancreastatin shows significant correlation with PFS and OS.
| Combined (n=176) | SBNETs (n=98) | PNETs (n=78) | ||||
|---|---|---|---|---|---|---|
| Clinical Feature | PFS | OS | PFS | OS | PFS | OS |
| P value | P value | P value | P value | P value | P value | |
| Tumor Site | <0.01 | 0.9 | - | - | - | - |
| Sex | 0.7 | 0.8 | 0.4 | 0.2 | 0.7 | 0.4 |
| Age at surgery | 0.11 | <0.01 | 0.13 | <0.01 | 0.8 | 0.3 |
| T-stage | <0.01 | 0.08 | 0.7 | 0.6 | <0.01 | 0.06 |
| N-stage | <0.001 | 0.023 | 0.4 | 0.2 | <0.001 | 0.032 |
| M-stage | <0.001 | <0.01 | <0.01 | 0.08 | <0.01 | 0.038 |
| Low-Grade | 0.08 | 0.8 | 0.2 | 0.4 | 0.02 | 0.7 |
| Lymph Node Ratio | 0.012 | 0.5 | 0.4 | 0.3 | 0.017 | 0.7 |
| Log Preop NeurokininA | 0.9 | 0.6 | 0.9 | 0.5 | 0.9 | 0.7 |
| Log Preop Serotonin | 0.017 | 0.9 | <0.01 | 0.43 | 0.9 | 0.9 |
| Log Preop ChromograninA | 0.024 | 0.033 | 0.08 | 0.027 | 0.2 | 0.4 |
| Log Preop Pancreastatin | <0.001 | <0.001 | <0.01 | 0.039 | <0.001 | <0.001 |
| Preop NeurokininA >40ng/mL | 0.9 | 0.6 | 0.9 | 0.3 | 0.8 | 0.2 |
| Preop Serotonin >200ng/mL | 0.3 | 0.3 | 0.10 | 0.9 | 0.5 | 0.8 |
| Preop ChromograninA >95ng/mL | 0.4 | 0.3 | 0.8 | 0.6 | 0.5 | 0.3 |
| Preop Pancreastatin >135pg/mL | <0.001 | 0.048 | <0.01 | 0.15 | 0.054 | 0.066 |
SBNET: Small bowel neuroendocrine tumor; PNET: Pancreatic neuroendocrine tumor.
To investigate whether a simple distinction between elevated versus not-elevated tumor markers provided useful information, laboratory values were next considered as categorical variables. Preoperative levels of chromograninA, pancreastatin, serotonin, and neurokininA were elevated above their reference ranges in 66, 65, 69, and 39% of patients tested, respectively. When considered as binary variables, high PreopPST, but no other marker, showed significant association with worse PFS and OS(p<0.05) (Table 2). When compared to those with normal levels, patients with PreopPST above the reference range of 135pg/mL had significantly shorter median PFS(1.7 vs. 6.5 years) and OS(9.1 years vs. not reached) (Table 3, Figure 2A,2B). Five-year PFS was 14.9% among patients with elevated PreopPST, compared to 59.4% among patients with normal levels, and 5-year OS fell to 72.6% with elevated PreopPST from 88.3% among patients with normal levels.
Table 3.
Survival differences based on tumor marker elevation, shown in all patients and in small bowel (SBNET) and pancreatic neuroendocrine tumor (PNET) subgroups. Both pre- and postoperative pancreastatin levels provide strong discrimination of patient outcomes. Among those with elevated preoperative tumor markers, postoperative pancreastatin levels provide additional prognostic information.
| All Patients Tumor Marker | Level | Median Years PFS (95% CI) | PFS P value | 5-year PFS (%) | Median Years OS (95% CI) | OS P value | 5-year OS (%) |
|---|---|---|---|---|---|---|---|
| Preoperative Pancreastatin | High (>135pg/mL)(n=84) | 1.7 (1.3-2.6) | <0.001 | 14.9 | 9.1 (5.6-NA) | 0.048 | 72.6 |
| Normal (n=46) | 6.5 (4.7-NA) | 59.4 | NA (7.5-NA) | 88.3 | |||
| Preoperative ChromograninA | High (>95ng/mL) (n=80) | 2.0 (1.7-5.3) | 0.4 | 33.8 | NA (6.5-NA) | 0.3 | 77.0 |
| Not Elevated (n=41) | 3.2 (2.5-NA) | 28.1 | NA (5.6-NA) | 88.5 | |||
| Postoperative Pancreastatin | High (>135pg/mL) (n=57) | 1.6 (1.1-1.9) | <0.001 | 16.4 | 7.5 (5.6-NA) | <0.01 | 67.2 |
| Normal (n=67) | 7.3 (6.5-NA) | 64.3 | NA (9.1-NA) | 90.3 | |||
| Postoperative ChromograninA | High (>95ng/mL/) (n=61) | 1.9 (1.6-3.3) | <0.01 | 27.8 | NA (NA-NA) | 0.03 | 72.8 |
| Normal (n=56) | 5.6 (3.2-NA) | 57.3 | NA (6.5-NA) | 87.1 | |||
| Preoperative, Postoperative Pancreastatin | High, High (>135pg/mL) (n=44) | 1.6 (0.8-1.9) | <0.01 | 8.6 | 6.5 (4.0-NA) | 0.15 | 63.8 |
| High, Normal (n=17) | 3.9 (2.6-NA) | 32.1 | 9.1 (5.6-NA) | 100 | |||
| Preoperative, Postoperative ChromograninA | High, High (>95ng/mL) (n=49) | 1.6 (1.3-3.3) | 0.02 | 24.5 | 6.5 (6.1-NA) | 0.03 | 71.0 |
| High, Normal (n=16) | 6.5 (2.5-NA) | 57.1 | NA (NA-NA) | 100 | |||
| SBNETs Only Tumor Marker | Level | Median Years PFS (95% CI) | PFS P value | 5-year PFS (%) | Median Years OS (95% CI) | OS P value | 5-year OS (%) |
| Preoperative Pancreastatin | High(>135pg/mL) (n=64) | 1.7 (1.3-2.6) | <0.01 | 15.0 | 9.1 (6.5-NA) | 0.15 | 74.7 |
| Normal (n=15) | 6.5 (4.7-NA) | 70.9 | NA (NA-NA) | 92.3 | |||
| Postoperative Pancreastatin | High (>135pg/mL) (n=42) | 1.5 (0.8-1.9) | <0.001 | 8.8 | NA (6.5-NA) | 0.03 | 68.9 |
| Normal (n=32) | 7.3 (6.5-NA) | 74.5 | NA (9.1-NA) | 100 | |||
| Preoperative, Postoperative Pancreastatin | High, High (>135pg/mL) (n=37) | 1.6 (0.8-2.0) | 0.02 | 11.0 | NA (6.5-NA) | 0.6 | 69.4 |
| High, Normal (n=11) | 4.2 (2.6-NA) | 32.5 | 9.1 (5.6-NA) | 100 | |||
| PNETs Only Tumor Marker | Level | Median Years PFS (95% CI) | PFS P value | 5-year PFS (%) | Median Years OS (95% CI) | OS P value | 5-year OS (%) |
| Preoperative Pancreastatin | High(>135pg/mL) (n=20) | 1.6 (1.2-NA) | 0.054 | 16.4 | 5.6 (2.7-NA) | 0.07 | 68.6 |
| Normal (n=31) | 5.6 (2.5-NA) | 56.1 | NA (7.5-NA) | 86.6 | |||
| Postoperative Pancreastatin | High (>135pg/mL) (n=15) | 1.6 (1.3-NA) | 0.02 | 32.6 | 6.1 (5.0-NA) | 0.053 | 66.5 |
| Normal (n=35) | NA (3.2-NA) | 56.5 | NA (NA-NA) | 82.7 | |||
| Preoperative, Postoperative Pancreastatin | High, High (>135pg/mL) (n=7) | 1.3 (0.5-NA) | 0.14 | 0.0 | 2.7 (2.2-NA) | 0.04 | 41.7 |
| High, Normal (n=6) | 3.9 (3.2-NA) | 27.8 | NA (NA-NA) | 100 |
PFS: Progression-free Survival; OS: Overall Survival; CI: Confidence Interval; NA: Cannot be estimated
Figure 2.
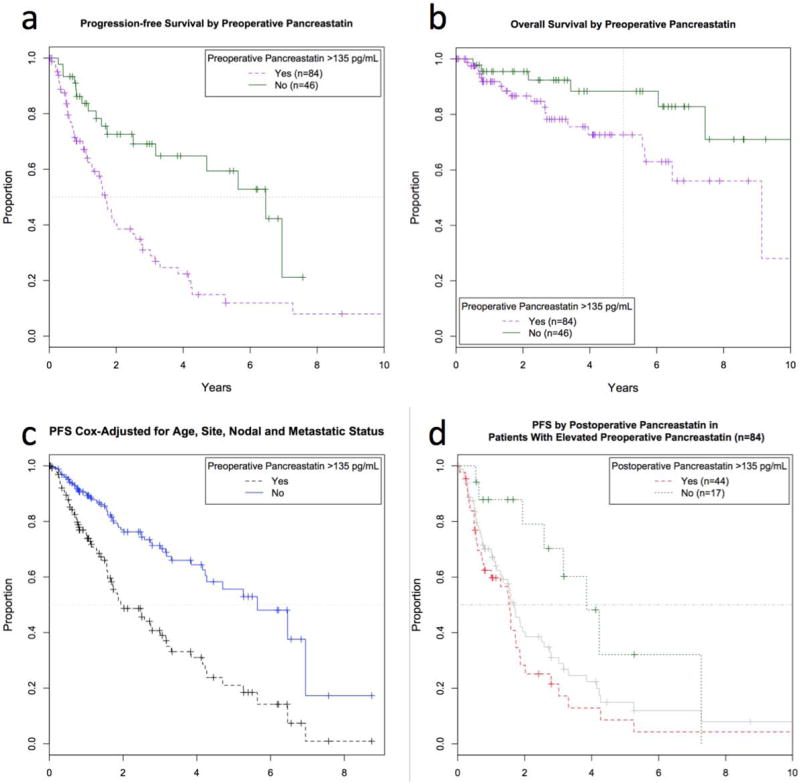
Median progression-free (PFS) (a) and 5-year overall survival (OS) (b) were higher in patients with normal (upper solid line, n=46) vs. elevated preoperative pancreastatin (lower dashed line, n=84) (median PFS 6.5 vs. 1.7 years; 5-year OS 88 vs. 73%). (c) Multivariate Cox model-adjusted PFS. Estimated median PFS was significantly longer in patients with normal preoperative pancreastatin (upper solid line) compared to elevated (lower dashed line) even after adjustment for confounding factors, (d) PFS by postoperative pancreastatin in patients with elevated preoperative pancreastatin levels. Patients with elevated preoperative pancreastatin (middle solid line, same as the dashed line in Fig. 2a, n=84) can be further stratified by elevated (lower dashed line, n=44) vs. normalized (upper dotted line, n=17) postoperative pancreastatin levels.
Multivariate Analysis
Univanate association of PreopCgA and PreopPST levels with outcomes suggested that these tests could be predictive of earlier progression and death. However, clinical characteristics predictive of PFS and OS were not equally represented in SBNET and PNET patients. To investigate whether differences in preoperative laboratory values provided independent prognostic information, multivariate Cox models adjusted for confounding factors. After accounting for the primary tumor site, age at surgery, and presence of nodal or metastatic disease, higher PreopPST, but not PreopCgA, remained independently predictive of worse PFS and OS(p<0.001 and p=0.01 for PreopPST, p=0.27 and p=0.29 for PreopCgA) (Table 4). These results did not change when tumor grade was added to the model(Table S1). Due to changes in grading criteria over time and low numbers of non-low-grade tumors, grade was omitted from the final model. Estimated median Cox-adjusted PFS was 2.0 years among patients with elevated PreopPST versus 5.6 years among patients with normal PreopPST(Figure 2C). Thus, independent of known prognostic factors, a 3.6-year difference in median PFS is attributable to whether PreopPST is elevated.
Table 4.
Multivariate Cox model results. Preoperative pancreastatin levels remained independently predictive of progression-free and overall survival after adjustment for confounding factors.
| Results in All Patients | Progression-Free Survival | Overall Survival | ||||
|---|---|---|---|---|---|---|
| Factor | HR | 95% CI | P value | HR | 95% CI | P value |
| Log Preoperative Pancreastatin (Per doubling) | 1.40 | 1.18-1.67 | <0.001 | 1.54 | 1.11-2.14 | 0.01 |
| Node-Positive Disease | 2.40 | 1.03-5.58 | 0.043 | 12.7 | 1.59-109 | 0.02 |
| Metastatic Disease | 2.32 | 1.01-5.32 | 0.047 | 3.07 | 0.60-15.7 | 0.18 |
| Age at Surgery (Per year) | 1.02 | 1.00-1.04 | 0.066 | 1.07 | 1.03-1.12 | <0.01 |
| Primary Site (If SBNET) | 0.48 | 0.26-0.89 | 0.02 | 0.17 | 0.06-0.47 | <0.001 |
| Results in PNETs Only | Progression-Free Survival | Overall Survival | ||||
| Factor | HR | 95% CI | P value | HR | 95% CI | P value |
| Log Preoperative Pancreastatin (Per doubling) | 1.57 | 1.08-2.27 | 0.02 | 1.85 | 1.05-3.28 | 0.03 |
| Node-Positive Disease | 2.66 | 0.88-8.00 | 0.08 | 5.27 | 0.53-52.4 | 0.16 |
| Metastatic Disease | 2.27 | 0.79-6.52 | 0.13 | 1.55 | 0.23-10.4 | 0.7 |
| Age at Surgery (Per year) | 1.01 | 0.98-1.04 | 0.6 | 1.02 | 0.96-1.08 | 0.6 |
| Results in SBNETs Only | Progression-Free Survival | Overall Survival | ||||
| Factor | HR | 95% CI | P value | HR | 95% CI | P value |
| Log Preoperative Pancreastatin (Per doubling) | 1.36 | 1.11-1.67 | <0.01 | Insufficient events for multivariate analysis in this subgroup | ||
| Node-Positive Disease | 1.52 | 0.43-5.35 | 0.5 | |||
| Metastatic Disease | 1.77 | 0.41-7.57 | 0.4 | |||
| Age at Surgery (Per year) | 1.03 | 0.99-1.06 | 0.10 | |||
HR: Hazard ratio; SBNET: Small bowel neuroendocrine tumor; CI: Confidence interval.
The location of the primary tumor also remained independently predictive of PFS and OS after multivariate adjustment. To confirm that differences in survival by PreopPST levels were not due to differences inherent in SBNET versus PNET tumors, PFS and OS were compared by primary tumor site in patients with elevated versus normal PreopPST. No significant differences existed. In patients with normal PreopPST, PFS and OS were similar in SBNET and PNET patients(median PFS 6.5 and 5.6 years, p=0.4; OS not reached for both, p=0.4) (Table 3). In patients with elevated PreopPST, PFS and OS were lower than in patients with normal PreopPST, but again similar between SBNET and PNET patients(median PFS 1.7 and 1.6 years, p=0.6; OS 9.1 and 5.6 years, p=0.3). From these analyses we conclude that elevated PreopPST is associated with a sharp decrease in predicted PFS and OS regardless of SBNET or PNET origin.
Postoperative tumor marker levels
Postoperative laboratory values were next tested for association with PFS and OS. Postoperative levels were drawn at a median of 124 days after surgery, and were recorded for most patients. In these patients, surgery reduced serum tumor markers, and postoperative chromograninA(PostopCgA)(n=117), pancreastatin(PostopPST)(n=124), and serotonin(n=129) were significantly lower than preoperative levels (median changes -30.5ng/mL, -55.0pg/mL, -88.0ng/mL, respectively, p<0.01 for all). Postoperative neurokininA(n=54) did not differ from PreopNKA(p=0.09). Correlations of these values with PFS and OS mirrored those of preoperative values, with postoperative serotonin showing significant association with PFS but not OS(p=0.01 and 0.9), and PostopCgA and PostopPST showing significant correlation with PFS and OS(p<0.05). Both PostopCgA and PostopPST remained independently correlated with PFS and OS after multivariate adjustment for patient age, tumor site, and presence of nodal and distant metastases(p<0.01). Elevated levels of either permitted strong discrimination between patients more and less likely to have early progression or death(Table 3).
The impact of post-surgical normalization of tumor markers was assessed by considering outcomes in patients with elevated PreopPST by whether PostopPST remained elevated. Among 84 patients with elevated PreopPST, PostopPST levels were available for 61. In these patients, PostopPST levels remained significantly predictive of both PFS and OS(p<0.01). Whereas elevated PreopPST by itself indicates predicted median PFS and 5-year OS of 1.7 years and 73%, among those whose PreopPST levels normalized after surgery, median PFS and 5-year OS improved to 3.9 years and 100%(Table 3, Figure 2D). In those whose PostopPST remained elevated, 5-year PFS was only 8.6%, (versus 14.9% as predicted by elevated PreopPST alone) and median OS dropped to 6.5 years. Deceptively, combining PreopCgA with PostopCgA information resulted in statistically significant differences in OS(Table 3), but this was because elevated PreopCgA failed to select a high-risk subset of patients. Due to the non-significant influence of elevated PreopCgA, there was little additional information gained by combining pre- and postoperative measurements, and differences in outcome were similar to those predicted by PostopCgA alone. Survival by normalization of PostopPST in SBNET and PNET subgroups were similar to the combined results, although larger sample sizes make results in the combined group more robust.
Discussion
In this study we demonstrate that PreopPST provides significant prognostic information in SBNET and PNET patients, with higher levels independently predicting worse PFS and OS. Although considering the degree of tumor marker elevation allowed the strongest correlations with outcomes, a binary distinction between pancreastatin elevated above the reference range versus normal allowed separation of patients into groups at high and low risk for progression and death. Incorporating PostopPST measurements further refines prognostic predictions.
Pancreastatin is a fragment of the 439-amino acid chromograninA peptide produced by the peptidase Prohormone Convertase-2.25,35,36 Its predominant human form contains 52 amino acids, although tumors may secrete additional shorter N-terminal-truncated fragments.37 Stored in secretory granules, pancreastatin inhibits glucose-stimulated insulin release and pancreatic and gastric secretion while it promotes glycogenolysis and impairs glucose uptake in muscle, fat, and liver.37,38 Although high pancreastatin has been recognized as a feature of neuroendocrine tumors for some time, pancreastatin’s role in normal physiology remains poorly understood.36,39 Pancreastatin seems to exert its effects through activity at membrane-associated G-proteins and phospholipase C, but a specific membrane-bound pancreastatin receptor (PSTR) has not been identified.37,39 Attempts to identify the PSTR have focused on affinity purification from rodent liver.37,39 NETs overexpress many hormone receptors such as those for somatostatin and gastric-inhibitory polypeptide,40-42 making it tempting to speculate that the putative PSTR might be more abundant in, and more readily isolated from, NET tissue specimens. Pancreastatin causes Ras-independent activation of the mitogen-activated protein kinase (MAPK) pathway, and also activates the phosphatidyl-inositol-3-kinase/Akt pathway.37 Whether pancreastatin represents a potential pharmacologic target in addition to reflecting NET disease burden is unknown.
Recent research highlights pancreastatin’s advantages in assessing neuroendocrine disease. Pancreastatin assays are more standardized than those for chromograninA, and pancreastatin levels do not vary with PPI exposure.25,30 Pancreastatin has greater sensitivity and specificity for diagnosing NETs than chromograninA, and might better reflect neuroendocrine disease burden.25,28,29 Pancreastatin also correlates with outcomes. In 122 NET patients undergoing hepatic artery chemoembolization, pancreastatin predicted response to therapy and elevated levels independently correlated with lower survival(1.9 versus 3.4 years).29 Pre-treatment pancreastatin independently predicted worse survival in 59 NET patients beginning somatostatin analogue therapy, and also closely paralleled tumor burden.27
Our results showing dramatic differences in outcomes based on pancreastatin levels in 176 surgically-managed patients extend these findings and support pancreastatin’s utility for predicting NET behavior. Elevated PreopPST predicted median PFS of 4.8 years less than with normal PreopPST, and a 5-year OS more than 15% lower(Figures 2A,B). Adding PostopPST measurements allowed further separation of these estimates(Figure 2D). Patients whose elevated PreopPST remained high after surgery had a greater than 90% chance of progression and nearly 40% chance of death within 5 years, while none of the patients whose pancreastatin normalized after surgery died during the same period, and median PFS more than doubled(Table 3). It is unknown whether serial pancreastatin measurements during follow-up add additional information, however, Pre- and PostopPST offer significant prognostic power. Multivariate analysis and investigation of results stratified by tumor type confirm that these effects do not reflect the status of other prognostic markers, but constitute independent information. Furthermore, if PreopPST levels are not available, this study demonstrates that isolated PostopPST or PostopCgA serve as strong indicators of probable outcomes.
The divergent prognoses of patients with elevated and normal PreopPST recommend updates in NET management and in future research. First, its strong prognostic implications support using pancreastatin as part of SBNET and PNET initial work-up and subsequent monitoring. Next, although somatostatin analogues are effective in progressive disease and are well-tolerated, they are expensive and many patients enjoy long periods of progression-free survival after surgery without additional treatment.12,14 Current guidelines do not recommend adjuvant octreotide in asymptomatic patients. Instead, patients begin additional therapeutics upon evidence of progression.2,3 Whether early initiation of octreotide or other treatments prior to tumor progression would impact survival is unknown. The currently-enrolling Eastern Cooperative Oncology Group E2212 phase-II trial (NCT02031536) will determine whether adjuvant everolimus prolongs PFS in metastatic PNETs. As identification of novel NET therapeutic targets and development of new agents proceeds,40,43 pancreastatin’s ability to discriminate outcomes even in patients with metastases suggests that future trials for advanced disease should consider monitoring pancreastatin. Our results support that elevated PreopPST selects patients with median PFS nearly 5 years lower than patients with normal levels, who could benefit most from more aggressive therapy. Incorporation of pancreastatin in new clinical trial inclusion criteria could help identify patients most likely to benefit, and reduce required sample sizes by selecting patients at highest risk in whom researchers could best discern treatment effects.
The independent association of PostopCgA levels with survival agrees with earlier data. Extensive evidence supports chromograninA for NET evaluation, but few studies specifically address PreopCgA.20,22,23,44-47 In the present study, PreopCgA was not significantly associated with outcomes after adjusting for prognostic covariates. The reason for this result is unclear, but could relate to the influence of factors beyond tumor burden, such as proton pump inhibitor(PPI) use, kidney disease, inflammation, and hypertension on PreopCgA levels.24,26,30,44 Thus, although PostopCgA is helpful, our results suggest lower utility of PreopCgA in prognostication. In terms of price, tests of CgA and PST are comparable with Interscience Institute quoting a list price of $125 for clinical CgA testing compared to $225 for PST, although actual prices vary depending on testing volume (ISI, Inglewood, CA).48
Limitations of this analysis include its retrospective nature and that correlations were stronger in terms of PFS than OS. This may be due to a low number of deaths, which limit our study’s power to detect differences in OS. The five-year survival rates for metastatic SBNETs and PNETs of 76 and 71% in this cohort compare favorably with results from SEER (5-year survival of approximately 45% in SBNETs and 25% in PNETs with metastases).1 It is likely that longer follow-up and accumulation of more OS events will augment the significant correlation between pancreastatin and survival. A strength of this study is that because pancreastatin predicted similar differences in outcome in SBNETs and PNETs (Table 3), these groups could reasonably be analyzed together, increasing sample sizes and statistical power to detect pancreastatin’s effects on survival.
In summary, pre- and post-operative pancreastatin levels constitute strong independent predictors of PFS and OS in SBNET and PNET patients. PreopPST identifies high-risk patients before surgery independent of patient age, tumor site, and presence of nodal or metastatic disease. Combining PreopPST with PostopPST stratifies patients into low and extremely high-risk groups for progression and death. Pancreastatin levels should be included in initial workup and subsequent follow-up of SBNETs and PNETs, and can select high-risk patients for inclusion in prospective trials of novel therapeutic approaches.
Supplementary Material
Acknowledgments
We gratefully acknowledge our patients for their participation.
Supported by NIH 5T32#CA148062-04 (SKS, JEM)
Footnotes
Presented at the Society of Surgical Oncology, 67th Annual Cancer Symposium, Phoenix, AZ, March 13, 2014
References
- 1.Yao JC, Hassan M, Phan A, et al. One hundred years after “carcinoid”: epidemiology of and prognostic factors for neuroendocrine tumors in 35,825 cases in the United States. J Clin Oncol. 2008;26:3063–72. doi: 10.1200/JCO.2007.15.4377. [DOI] [PubMed] [Google Scholar]
- 2.Falconi M, Bartsch DK, Eriksson B, et al. ENETS Consensus Guidelines for the management of patients with digestive neuroendocrine neoplasms of the digestive system: well-differentiated pancreatic non-functioning tumors. Neuroendocrinology. 2012;95:120–34. doi: 10.1159/000335587. [DOI] [PubMed] [Google Scholar]
- 3.Pape UF, Perren A, Niederle B, et al. ENETS Consensus Guidelines for the management of patients with neuroendocrine neoplasms from the jejunoileum and the appendix including goblet cell carcinomas. Neuroendocrinology. 2012;95:135–56. doi: 10.1159/000335629. [DOI] [PubMed] [Google Scholar]
- 4.Givi B, Pommier SJ, Thompson AK, Diggs BS, Pommier RF. Operative resection of primary carcinoid neoplasms in patients with liver metastases yields significantly better survival. Surgery. 2006;140:891–7. doi: 10.1016/j.surg.2006.07.033. discussion 7-8. [DOI] [PubMed] [Google Scholar]
- 5.Hill JS, McPhee JT, McDade TP, et al. Pancreatic neuroendocrine tumors: the impact of surgical resection on survival. Cancer. 2009;115:741–51. doi: 10.1002/cncr.24065. [DOI] [PubMed] [Google Scholar]
- 6.Taner T, Atwell TD, Zhang L, et al. Adjunctive radiofrequency ablation of metastatic neuroendocrine cancer to the liver complements surgical resection. HPB (Oxford) 2013;15:190–5. doi: 10.1111/j.1477-2574.2012.00528.x. [DOI] [PMC free article] [PubMed] [Google Scholar]
- 7.Oberg K, Knigge U, Kwekkeboom D, Perren A. Neuroendocrine gastro-entero-pancreatic tumors: ESMO Clinical Practice Guidelines for diagnosis, treatment and follow-up. Ann Oncol. 2012;23(Suppl 7):viil24–30. doi: 10.1093/annonc/mds295. [DOI] [PubMed] [Google Scholar]
- 8.Capurso G, Bettini R, Rinzivillo M, Boninsegna L, Delle Fave G, Falconi M. Role of resection of the primary pancreatic neuroendocrine tumour only in patients with unresectable metastatic liver disease: a systematic review. Neuroendocrinology. 2011;93:223–9. doi: 10.1159/000324770. [DOI] [PubMed] [Google Scholar]
- 9.Capurso G, Rinzivillo M, Bettini R, Boninsegna L, Delle Fave G, Falconi M. Systematic review of resection of primary midgut carcinoid tumour in patients with unresectable liver metastases. Br J Surg. 2012;99:1480–6. doi: 10.1002/bjs.8842. [DOI] [PubMed] [Google Scholar]
- 10.Eriksson J, Stalberg P, Nilsson A, et al. Surgery and radiofrequency ablation for treatment of liver metastases from midgut and foregut carcinoids and endocrine pancreatic tumors. World J Surg. 2008;32:930–8. doi: 10.1007/s00268-008-9510-3. [DOI] [PubMed] [Google Scholar]
- 11.Mayo SC, de Jong MC, Pulitano C, et al. Surgical management of hepatic neuroendocrine tumor metastasis: results from an international multi-institutional analysis. Ann Surg Oncol. 2010;17:3129–36. doi: 10.1245/s10434-010-1154-5. [DOI] [PubMed] [Google Scholar]
- 12.Pavel M, Baudin E, Couvelard A, et al. ENETS Consensus Guidelines for the management of patients with liver and other distant metastases from neuroendocrine neoplasms of foregut, midgut, hindgut, and unknown primary. Neuroendocrinology. 2012;95:157–76. doi: 10.1159/000335597. [DOI] [PubMed] [Google Scholar]
- 13.Sarmiento JM, Heywood G, Rubin J, Ilstrup DM, Nagorney DM, Que FG. Surgical treatment of neuroendocrine metastases to the liver: a plea for resection to increase survival. J Am Coll Surg. 2003;197:29–37. doi: 10.1016/S1072-7515(03)00230-8. [DOI] [PubMed] [Google Scholar]
- 14.Rinke A, Muller HH, Schade-Brittinger C, et al. Placebo-controlled, double-blind, prospective, randomized study on the effect of octreotide LAR in the control of tumor growth in patients with metastatic neuroendocrine midgut tumors: a report from the PROMID Study Group. J Clin Oncol. 2009;27:4656–63. doi: 10.1200/JCO.2009.22.8510. [DOI] [PubMed] [Google Scholar]
- 15.Zaknun JJ, Bodei L, Mueller-Brand J, et al. The joint IAEA, EANM, and SNMMI practical guidance on peptide receptor radionuclide therapy (PRRNT) in neuroendocrine tumours. Eur J Nucl Med Mol Imaging. 2013;40:800–16. doi: 10.1007/s00259-012-2330-6. [DOI] [PMC free article] [PubMed] [Google Scholar]
- 16.Yao JC, Shah MH, Ito T, et al. Everolimus for advanced pancreatic neuroendocrine tumors. N Engl J Med. 2011;364:514–23. doi: 10.1056/NEJMoa1009290. [DOI] [PMC free article] [PubMed] [Google Scholar]
- 17.Raymond E, Dahan L, Raoul JL, et al. Sunitinib malate for the treatment of pancreatic neuroendocrine tumors. N Engl J Med. 2011;364:501–13. doi: 10.1056/NEJMoa1003825. [DOI] [PubMed] [Google Scholar]
- 18.Modlin IM, Moss SF, Chung DC, Jensen RT, Snyderwine E. Priorities for improving the management of gastroenteropancreatic neuroendocrine tumors. J Natl Cancer Inst. 2008;100:1282–9. doi: 10.1093/jnci/djn275. [DOI] [PMC free article] [PubMed] [Google Scholar]
- 19.Turner GB, Johnston BT, McCance DR, et al. Circulating markers of prognosis and response to treatment in patients with midgut carcinoid tumours. Gut. 2006;55:1586–91. doi: 10.1136/gut.2006.092320. [DOI] [PMC free article] [PubMed] [Google Scholar]
- 20.Nikou GC, Marinou K, Thomakos P, et al. Chromogranin a levels in diagnosis, treatment and follow-up of 42 patients with non-functioning pancreatic endocrine tumours. Pancreatology. 2008;8:510–9. doi: 10.1159/000152000. [DOI] [PubMed] [Google Scholar]
- 21.Vinik AI, Silva MP, Woltering EA, Go VL, Warner R, Caplin M. Biochemical testing for neuroendocrine tumors. Pancreas. 2009;38:876–89. doi: 10.1097/MPA.0b013e3181bc0e77. [DOI] [PubMed] [Google Scholar]
- 22.Jensen EH, Kvols L, McLoughlin JM, et al. Biomarkers predict outcomes following cytoreductive surgery for hepatic metastases from functional carcinoid tumors. Ann Surg Oncol. 2007;14:780–5. doi: 10.1245/s10434-006-9148-z. [DOI] [PubMed] [Google Scholar]
- 23.Janson ET, Holmberg L, Stridsberg M, et al. Carcinoid tumors: analysis of prognostic factors and survival in 301 patients from a referral center. Ann Oncol. 1997;8:685–90. doi: 10.1023/a:1008215730767. [DOI] [PubMed] [Google Scholar]
- 24.Boudreaux JP, Klimstra DS, Hassan MM, et al. The NANETS consensus guideline for the diagnosis and management of neuroendocrine tumors: well-differentiated neuroendocrine tumors of the Jejunum, Ileum, Appendix, and Cecum. Pancreas. 2010;39:753–66. doi: 10.1097/MPA.0b013e3181ebb2a5. [DOI] [PubMed] [Google Scholar]
- 25.O’Dorisio TM, Krutzik SR, Woltering EA, et al. Development of a highly sensitive and specific carboxy-terminal human pancreastatin assay to monitor neuroendocrine tumor behavior. Pancreas. 2010;39:611–6. doi: 10.1097/MPA.0b013e3181c68d7a. [DOI] [PubMed] [Google Scholar]
- 26.Ito T, Igarashi H, Jensen RT. Serum pancreastatin: the long sought universal, sensitive, specific tumor marker for neuroendocrine tumors? Pancreas. 2012;41:505–7. doi: 10.1097/MPA.0b013e318249a92a. [DOI] [PMC free article] [PubMed] [Google Scholar]
- 27.Stronge RL, Turner GB, Johnston BT, et al. A rapid rise in circulating pancreastatin in response to somatostatin analogue therapy is associated with poor survival in patients with neuroendocrine tumours. Ann Clin Biochem. 2008;45:560–6. doi: 10.1258/acb.2008.008033. [DOI] [PubMed] [Google Scholar]
- 28.Rustagi S, Warner RR, Divino CM. Serum pancreastatin: the next predictive neuroendocrine tumor marker. J Surg Oncol. 2013;108:126–8. doi: 10.1002/jso.23359. [DOI] [PubMed] [Google Scholar]
- 29.Bloomston M, Al-Saif O, Klemanski D, et al. Hepatic artery chemoembolization in 122 patients with metastatic carcinoid tumor: lessons learned. J Gastrointest Surg. 2007;11:264–71. doi: 10.1007/s11605-007-0089-z. [DOI] [PubMed] [Google Scholar]
- 30.Raines D, Chester M, Diebold AE, et al. A prospective evaluation of the effect of chronic proton pump inhibitor use on plasma biomarker levels in humans. Pancreas. 2012;41:508–11. doi: 10.1097/MPA.0b013e318243a0b6. [DOI] [PubMed] [Google Scholar]
- 31.Dahdaleh FS, Calva-Cerqueira D, Carr JC, et al. Comparison of clinicopathologic factors in 122 patients with resected pancreatic and ileal neuroendocrine tumors from a single institution. Ann Surg Oncol. 2012;19:966–72. doi: 10.1245/s10434-011-1997-4. [DOI] [PubMed] [Google Scholar]
- 32.Kaplan EL, Meier P. Nonparametric Estimation from Incomplete Observations. J Am Stat Assoc. 1958;53:457–81. [Google Scholar]
- 33.Schemper M, Smith TL. A note on quantifying follow-up in studies of failure time. Control Clin Trials. 1996;17:343–6. doi: 10.1016/0197-2456(96)00075-x. [DOI] [PubMed] [Google Scholar]
- 34.Cox DR. Regression Models and Life-Tables (With Discussion) J R Statist Soc B. 1972;34:187–220. [Google Scholar]
- 35.Konecki DS, Benedum UM, Gerdes HH, Huttner WB. The primary structure of human chromogranin A and pancreastatin. J Biol Chem. 1987;262:17026–30. [PubMed] [Google Scholar]
- 36.Taupenot L, Harper KL, O’Connor DT. The chromogranin-secretogranin family. N Engl J Med. 2003;348:1134–49. doi: 10.1056/NEJMra021405. [DOI] [PubMed] [Google Scholar]
- 37.Sanchez-Margalet V, Gonzalez-Yanes C, Najib S, Santos-Alvarez J. Metabolic effects and mechanism of action of the chromogranin A-derived peptide pancreastatin. Regul Pept. 2010;161:8–14. doi: 10.1016/j.regpep.2010.02.005. [DOI] [PubMed] [Google Scholar]
- 38.O’Connor DT, Cadman PE, Smiley C, et al. Pancreastatin: multiple actions on human intermediary metabolism in vivo, variation in disease, and naturally occurring functional genetic polymorphism. J Clin Endocrinol Metab. 2005;90:5414–25. doi: 10.1210/jc.2005-0408. [DOI] [PubMed] [Google Scholar]
- 39.Biswas N, Friese RS, Gayen JR, Bandyopadhyay G, Mahata SK, O’Connor DT. Discovery of a novel target for the dysglycemic chromogranin A fragment pancreastatin: interaction with the chaperone GRP78 to influence metabolism. PLoS One. 2014;9:e84132. doi: 10.1371/journal.pone.0084132. [DOI] [PMC free article] [PubMed] [Google Scholar]
- 40.Sherman SK, Carr JC, Wang D, O’Dorisio MS, O’Dorisio TM, Howe JR. Gastric inhibitory polypeptide receptor (GIPR) is a promising target for imaging and therapy in neuroendocrine tumors. Surgery. 2013;154:1206–14. doi: 10.1016/j.surg.2013.04.052. [DOI] [PMC free article] [PubMed] [Google Scholar]
- 41.Sherman SK, Maxwell JE, Carr JC, et al. GIPR expression in gastric and duodenal neuroendocrine tumors. J Surg Res. 2014 doi: 10.1016/j.jss.2014.01.044. [Epub] [DOI] [PMC free article] [PubMed] [Google Scholar]
- 42.Carr JC, Sherman SK, Wang D, et al. Overexpression of membrane proteins in primary and metastatic gastrointestinal neuroendocrine tumors. Ann Surg Oncol. 2013;20(Suppl 3):739–46. doi: 10.1245/s10434-013-3318-6. [DOI] [PMC free article] [PubMed] [Google Scholar]
- 43.Waser B, Rehmann R, Sanchez C, Fourmy D, Reubi JC. Glucose-dependent insulinotropic polypeptide receptors in most gastroenteropancreatic and bronchial neuroendocrine tumors. J Clin Endocrinol Metab. 2012;97:482–8. doi: 10.1210/jc.2011-2454. [DOI] [PubMed] [Google Scholar]
- 44.Stivanello M, Berruti A, Torta M, et al. Circulating chromogranin A in the assessment of patients with neuroendocrine tumours. A single institution experience. Ann Oncol. 2001;12(Suppl 2):S73–7. doi: 10.1093/annonc/12.suppl_2.s73. [DOI] [PubMed] [Google Scholar]
- 45.Kolby L, Bernhardt P, Sward C, et al. Chromogranin A as a determinant of midgut carcinoid tumour volume. Regul Pept. 2004;120:269–73. doi: 10.1016/j.regpep.2004.03.017. [DOI] [PubMed] [Google Scholar]
- 46.Korse CM, Bonfrer JM, Aaronson NK, Hart AA, Taal BG. Chromogranin A as an alternative to 5-hydroxyindoleacetic acid in the evaluation of symptoms during treatment of patients with neuroendocrine Tumors. Neuroendocrinology. 2009;89:296–301. doi: 10.1159/000162876. [DOI] [PubMed] [Google Scholar]
- 47.Arnold R, Wilke A, Rinke A, et al. Plasma chromogranin A as marker for survival in patients with metastatic endocrine gastroenteropancreatic tumors. Clin Gastroenterol Hepatol. 2008;6:820–7. doi: 10.1016/j.cgh.2008.02.052. [DOI] [PubMed] [Google Scholar]
- 48.Personal Communication: Interscience Institute Pricing. 2014 [Google Scholar]
Associated Data
This section collects any data citations, data availability statements, or supplementary materials included in this article.