

Abstract
Biofortification to increase provitamin A carotenoids is an agronomic approach to alleviate vitamin A deficiency. Two studies compared biofortified foods using in vitro and in vivo methods. Study 1 screened maize genotypes (n = 44) using in vitro analysis, which demonstrated decreasing micellarization with increasing provitamin A. Thereafter, seven 50% biofortified maize feeds that hypothesized a one-to-one equivalency between β-cryptoxanthin and β-carotene were fed to Mongolian gerbils. Total liver retinol differed among the maize groups (P = 0.0043). Study 2 assessed provitamin A bioefficacy from 0.5% high-carotene carrots added to 60% staple-food feeds, followed by in vitro screening. Liver retinol was highest in the potato and banana groups, maize group retinol did not differ from baseline, and all treatments differed from control (P < 0.0001). In conclusion, β-cryptoxanthin and β-carotene have similar bioefficacy; meal matrix effects influence provitamin A absorption from carrot; and in vitro micellarization does not predict bioefficacy.
Keywords: α-retinol, biofortification, carrots, nixtamalization
Introduction
Biofortification of staple crops to improve provitamin A carotenoid concentrations is a promising agronomic approach to increase vitamin A (VA) intake in populations. One such crop is maize, which makes up 55-70% of energy intake in countries such as Mexico and Zambia.1,2 The provitamin A carotenoids, β-carotene (βC), β-cryptoxanthin (βCX), and α-carotene (αC), are present in typical yellow maize in low concentrations3 and higher concentrations in biofortified varieties.4,5 The bioefficacy to make retinol from provitamin A carotenoids in maize was demonstrated by maintaining liver retinol stores of VA-depleted Mongolian gerbils (Meriones unguiculatus).4,6 Furthermore, favorable bioconversion factors, which were more efficient than the Institute of Medicine (IOM) values of 12 μg βC equivalents to 1 μg retinol,7 were measured from single test meals made with biofortified maize in US women8 and Zimbabwean men.9
Several studies have evaluated the effects of the relative carotenoid ratio, food matrices, meal components, and food processing on bioavailability, which is defined as provitamin A carotenoid that is absorbed and available for physiological function. For example, βCX and βC from biofortified maize are equally efficacious at maintaining baseline retinol stores in gerbils;10 cooking carotenoid-containing foods increases bioefficacy;11 and dietary fat in meals increases carotenoid absorption.12-14 However, carotenoid bioavailability from combined meals prepared with staple crops (biofortified or not) and vegetables, such as carrots and green leaves,5 has not been determined.
In vitro carotenoid bioaccessibility screening methods (i.e., measuring provitamin A carotenoid released from the food matrix) involve digestion assays and may predict carotenoid bioavailability in vivo.15-18 The micellarization efficiency (i.e., the fraction of carotenoid transferred from digesta to aqueous fraction) of maize carotenes was higher for porridge than extruded puffs and bread,17 indicating that wet-cooking enhances bioaccessibility. In vitro digestions have been coupled with Caco-2 cell uptake as a model to screen the relative absorption of carotenoids from micelles with direct proportionality to the amount of provitamin A in cassava.16 In vitro digestions were used to determine carotenoid bioavailability from vegetables;19,20 however, it has not been coupled with animal studies to assess the same foods.
Two studies coupled in vitro and in vivo components. Study 1 screened 44 maize genotypes (Zea mays sp.) with different βCX to βC ratios. Thereafter, 50% maize feeds, assuming 1:1 rather than the theoretical 2:1 retinol activity equivalency between βCX and βC, were fed to Mongolian gerbils to assess in vivo bioaccessibility and bioconversion to VA, i.e., bioefficacy. The hypothesis was that bioaccessibility of provitamin A carotenoids is correlated to concentration when measured by in vitro methods and that βCX will be as bioefficacious as βC in maize at the molar level in vivo. Study 2 assessed the bioefficacy of αC and βC from a small amount of biofortified, high-βC carrots (Daucus carota L.) when added to 60% staple-food feeds of gerbils, and compared this with in vitro carotenoid bioaccessibility. In prior studies, high-βC carrots provided an abundant amount of retinol to gerbils.21 In study 2, the hypothesis was that small amounts of high-βC carrots will be an effective complementary food to maintain liver retinol reserves in gerbils despite potential effects of the combined food matrix.
Materials and Methods
Maize and Carrots
Maize genotypes, including lines and synthetics, from the International Maize and Wheat Improvement Center (CIMMYT)/HarvestPlus maize provitamin A biofortification project were grown in Mexico at Agua Fria, Puebla (20°32′N, 97°28′ W; 110 m above sea level). Ears were harvested, dried, and grain was stored at -20°C before shipping to University of Wisconsin (UW)-Madison. Genotypes were selected based on carotenoid profile and contrasting βCX:βC. Carrots from the USDA carrot breeding and genetics program were grown by the University of California Desert Research and Extension Station in sandy, loam soil in October and harvested in March the following year. Carrots were refrigerated at 2°C until shipped overnight from California to Wisconsin. Upon arrival, they were immediately returned to 2°C and utilized for feed preparation after freeze-drying. Genotypes used (i.e., HCM and B2327) were selected for high βC concentrations.
In Vitro Digestion, Isolation of Micellarized Fraction, and Analyses
For study 1, maize genotypes (n = 44) were prescreened using HPLC (Supplemental Table 1) and in vitro methods.16,17 From these data, four genotypes were selected along with three others for gerbil study 1. Three genotypes had high βC and four had high βCX concentrations (Table 1). Biofortified maize and feeds from study 2 were weighed (∼3 g) in triplicate and subjected to in vitro digestion as described by Thakkar et al.16 and modified by Kean et al.17 The method involves an oral phase using α-amylase; gastric phase with porcine pepsin and pH adjustment with HCl; and an intestinal phase using porcine pancreatin, lipase, and bile extracts to mimic what happens in vivo. After the intestinal phase, the digesta is comprised of the fluid and food products. Digesta were transferred to polycarbonate tubes for high-speed centrifugation (10,000 g for 1 h). Aqueous fractions (5-10 mL) were collected and syringe filtered into 15 mL centrifuge tubes, covered with nitrogen, and stored at -80°C until analysis.21-23 Digesta and aqueous fractions (3 mL) were placed in glass tubes with internal standard (β-apo-8′-carotenal, 50 μL) and ethanol with 0.1% butylated hydroxytoluene (500 μL). The carotenoids were extracted three times with hexanes (1 mL), pooled, dried under nitrogen, reconstituted in 100 μL 50:50 methanol:dichloroethane, and 50 μL injected into a photodiode array HPLC.
Table 1. Provitamin A carotenoid concentrations, fiber and resistant starch content of feeds, feed intake, and theoretical retinol intake for Mongolian gerbils (studies 1 and 2)a,b.
| Component | β-cryptoxanthin | β-carotene | Hypothetical retinol | Neutral detergent fiber | Resistant starch | Feed intake/cage | Daily hypothetical intake/cagec | Daily theoretical intake/caged |
|---|---|---|---|---|---|---|---|---|
|
| ||||||||
| nmol/g feed | % | g/d | nmol/d | |||||
| Study 1 | ||||||||
| P value | < 0.0001 | < 0.0001 | 0.53 | 0.048 | < 0.0001 | < 0.0001 | < 0.0001 | < 0.0001 |
| VA - | ND | ND | ND | - | - | NM | - | - |
| G1 | 0.005 ± 0.001C | 4.45 ± 0.60A | 4.46 ± 0.60 | 10.6 ± 0.07A | 5.13 ± 0.14D | 10.6 ± 1.8D | 47.2 ± 8.1D | 94.3 ± 16.1C |
| G2 | 4.08 ± 0.62A | 0.92 ± 0.19B | 5.00 ± 0.79 | 9.46 ± 0.45C | 5.73 ± 0.14BC | 11.5 ± 2.1B | 57.3 ± 10.7B | 67.8 ± 12.6F |
| G3 | 0.006 ± 0.000C | 4.41 ± 0.35A | 4.41 ± 0.35 | 10.6 ± 0.33AB | 5.98 ± 0.08AB | 11.3 ± 2.2BC | 49.9 ± 9.7C | 99.8 ± 19.4B |
| G4 | 4.25 ± 0.55A | 1.13 ± 0.20B | 5.39 ± 0.75 | 9.85 ± 0.58ABC | 5.87 ± 0.06AB | 10.9 ± 1.9CD | 58.5 ± 10.4AB | 71.0 ± 12.8EF |
| G5 | 3.50 ± 0.35B | 1.52 ± 0.16B | 5.02 ± 0.49 | 9.08 ± 0.69C | 5.42 ± 0.01CD | 12.0 ± 1.9A | 60.2 ± 9.6A | 78.4 ± 12.5D |
| G6 | 4.26 ± 0.49A | 1.04 ± 0.23B | 5.30 ± 0.67 | 9.55 ± 0.90BC | 5.97 ± 0.02AB | 11.5 ± 1.9AB | 60.9 ± 9.9A | 72.9 ± 11.8E |
| G7 | 0.030 ± 0.046C | 4.99 ± 0.84A | 5.02 ± 0.86 | 10.1 ± 0.71ABC | 6.08 ± 0.02A | 11.3 ± 2.7BC | 56.5 ± 13.6B | 113 ± 27.0A |
| VA + | - | - | - | - | - | NM | 49.9 | - |
|
| ||||||||
| Component | α-carotene | β-carotene | Theoretical retinol | Neutral detergent fiber | Resistant starch | Feed intake | Daily theoretical intake/cage | |
|
| ||||||||
| Study 2 | ||||||||
| P value | < 0.0001 | < 0.0001 | < 0.0001 | < 0.0001 | < 0.0001 | 0.024 | < 0.0001 | |
| VA - | ND | ND | ND | NM | 0.31 ± 0.01D | 10.8 ± 0.20AB | ND | |
| 60% Rice | 4.23 ± 0.40B | 11.8 ± 0.46B | 29.5 ± 2.92B | 2.65 ± 0.53D | 4.54 ± 0.21A | 9.89 ± 0.66C | 291 ± 19.5B | |
| 60% Potato | 4.05 ± 0.52B | 12.1 ± 1.49B | 28.3 ± 3.75B | 4.63 ± 0.98C | 1.20 ± 0.01C | 10.4 ± 0.63BC | 294 ± 17.8B | |
| 60% Banana | 6.42 ± 0.94A | 16.8 ± 2.19A | 40.0 ± 4.89A | 4.62 ± 0.76C | 4.76 ± 0.78A | 11.3 ± 0.80A | 452 ± 32.2A | |
| 60% White maize | 4.15 ± 0.63B | 12.3 ± 1.62B | 28.7 ± 4.40B | 6.29 ± 0.90B | 2.35 ± 0.96B | 10.4 ± 0.67BC | 297 ± 19.3B | |
| Carrot only | 4.17 ± 0.68B | 12.2 ± 1.81B | 28.6 ± 4.89B | 9.96 ± 0.51A | 0.32 ± 0.02D | 10.5 ± 0.41BC | 300. ± 11.9B | |
Values are means ± SD, n ≥ 3 replicates (diet analysis), and n = 5 (feed intake and daily theoretical retinol intake). Means in a column with superscripts without a common capital letter differ. Feed intake and theoretical retinol are per cage (n = 2/cage, n = 10/treatment group). ND, not detected; NM, not measured; VA+, positive control; VA-, negative control.
The limit for detection for carotenoids is <0.001 nmol and that for resistant starch is 0.08%. Assay includes all resistant starch.
Daily hypothetical retinol intake assumes 1 mol β-carotene = 1 mol β-cryptoxanthin = 1 mol retinol.
Daily theoretical retinol intake assumes 100% bioefficacy (i.e., 1 mol β-carotene provides 2 mol retinol and 1 mol α-carotene or β-cryptoxanthin provides 1 mol retinol). This calculation (theoretical retinol X feed intake) accounts for losses in provitamin A concentrations over time.
Gerbil Study Designs
For studies 1 and 2, male 34-40 d-old Mongolian gerbils (Charles River Laboratories; Kingston, NY) were group housed (2-3/cage) during VA-depletion and treatment (2/cage). During depletion, gerbils were weighed daily for 2 wk, and thereafter three times/wk. Room temperature and humidity were held constant with a 12-h light/dark cycle. Animal handling procedures were approved by the College of Agriculture and Life Sciences Animal Care and Use Committee at UW-Madison.
For study 1, gerbils (n = 97) were fed 50% white maize feed as a wash-out for 5 wk. A baseline kill (n = 7) was performed via exsanguination while under isoflurane anesthesia. Remaining gerbils were divided into 9 treatment groups (n = 10/group) and fed 50% white (VA− and VA+ groups) or seven orange maize feeds (G1-G7) prepared as published.6 The feeds were developed hypothesizing that 1 molecule βC = 1 molecule βCX = 1 molecule retinol from the feed or supplement (Table 1). This contrasts with the theoretical relationship of 0.5 molecule βC = 1 molecule βCX = 1 molecule retinol. Oral supplements, administered using a positive displacement pipette, consisted of retinyl acetate (VA+ group) or oil only, which was given to groups G1-G7 and the VA- control. The VA+ dose was matched to the nmol βC + βCX consumed from the orange maize on the prior day and oil doses were matched by volume. Gerbils were fed for 4 wk and then killed for tissue collection.
For study 2, gerbils (n = 66) were randomly separated into 6 treatment groups and acclimated to their study treatment by increasing staple amounts by 15% each week during depletion (4 wk). Feeds ultimately contained 60% white staple food [i.e., potato (PT), rice (RC), banana (BN), or maize (MZ)] + carrot, or VA-free feed with (CA) and without (VA-) carrot (Table 2). After depletion, one gerbil from each group (n = 6) was killed to determine initial serum and liver retinol concentrations. During treatment (4 wk), 0.5% freeze-dried high βC carrots were added to the staple feeds and the CA group. After treatment, the gerbils were killed and blood and livers were collected. Blood was centrifuged 15 min at 2200 g in serum separator Vacutainer tubes (Becton Dickinson; Franklin Lakes, NJ). Livers and serum were stored at -80°C.
Table 2. Composition of experimental feeds for study 2 designed in consultation with a nutritionist at the feed supplier (Harlan-Teklad, Madison, WI, USA) that were fed to Mongolian gerbils to determine vitamin A efficacy of high β-carotene carrot mixed with a variety of staple foods.
| Ingredient | 60% Potato | 60% Rice | 60% Bananaa | 60% White Maize | Vitamin A-freeb |
|---|---|---|---|---|---|
|
| |||||
| g/kg feed | |||||
| Component | 600 | 600 | 600 | 600 | --- |
| Casein | 146 | 149 | 172 | 140 | 200 |
| L-Cystine | 2.57 | 2.57 | 2.57 | 2.57 | 3 |
| Sucrose | 145 | 143 | 75.1 | 170 | 360.5 |
| Maltodextrin | 0 | 0 | 21.7 | 0 | 120 |
| Corn starch | 0 | 0 | 29.4 | 0 | 150 |
| Cottonseed oilc | 55.6 | 53.7 | 48.5 | 36.5 | 60 |
| Cellulose | 0 | 0 | 0 | 0 | 60 |
| Mineral Mix, AIN-93M-MX | 34.6 | 34.6 | 34.6 | 34.6 | 35 |
| Magnesium oxide | 1.73 | 1.73 | 1.73 | 1.73 | 1.75 |
| Calcium phosphate, dibasic | 1.98 | 1.98 | 1.98 | 1.98 | 2 |
| Vitamin Mixd, w/o choline, A, D, E2 | 4.94 | 4.94 | 4.94 | 4.94 | 5 |
| Vitamin E, DL-α-tocopheryl acetate | 0.239 | 0.239 | 0.239 | 0.239 | 0.242 |
| Vitamin D3, cholecalciferol | 0.004 | 0.004 | 0.004 | 0.004 | 0.044 |
| Choline bitartrate | 0.004 | 0.004 | 0.004 | 0.004 | 2.5 |
| Fiber | 146 | 149 | 172 | 140 | 200 |
All banana was chopped, freeze-dried and ground.
Vitamin A-free feed was used for both the VA- diet and the 0.5% Carrot diet.
Fat content was equalized in the feeds as well as nitrogen and energy.
Vitamin mix provided the following, mg/kg purified diet: biotin, 0.4; calcium pantothenate,66.1; folic acid, 2; inositol, 110.1; menadione, 49.6; niacin, 99.1; p-aminobenzoic acid, 110.1; pyridoxine-HCl, 22; riboflavin, 22; thiamin-HCl, 22; vitamin B12 (0.1% in mannitol), 29.7; ascorbic acid (97.5%), 1016.6.
Feed Preparation for Study 2
Green bananas were purchased from a local grocery store, peeled and sliced, lyophilized for ∼6 d, ground into flour, and kept frozen (-20°C) until mixed into feeds. Nixtamalized (processed) white maize meal that contained no carotenoids (Masa™), precooked dehydrated potato flakes (Roundy's™), and precooked instant rice (Roundy's™) were purchased from a grocery store. Nixtamalization is a common processing method where the maize grains are soaked in limewater prior to grinding to improve consistency, increase calcium, reduce phytic acid, and enhance niacin bioavailability from the maize.24 Potato flakes and rice were ground into fine powders using a Vitamix™ blender. Basal mixes were formulated for each food item with assistance from a feed nutritionist (Harlan-Teklad, Madison, WI) to provide VA- and carotenoid-free, isoenergetic and isonitrogenous feeds, which were mixed weekly with 0.5% carrot and stored at -20°C (Table 2).
Carotenoid, Retinoid, Resistant Starch, and Fiber Analyses
Maize (0.6 g), feeds (0.6 g), and carrots (0.01 g) were analyzed each week in triplicate for carotenoid concentrations using a modified procedure after grinding with a mortar and pestle.23 Serum preparation followed published methods.22 Originally, the livers were analyzed for retinyl esters and carotenoids without saponification;4 however, after initial data analyses, liver retinol was re-analyzed using a saponification procedure in order to better assess total retinol in study 1 and total α-retinol concentrations in study 2 derived from carrot αC.22 For liver carotenoids, an unsaponified 5-mL aliquot of the 25 mL liver extract was dried, re-suspended in 100 μL 50:50 methanol: dichloroethane, and 50 μL was injected into an HPLC system as published.23 Resistant starch and fiber were analyzed using previously published methods.25,26
Statistical Analysis and Calculation of Bioconversion Factors
Values are reported as means ± SD. Data were analyzed using the General Linear Model procedure in the Statistical Analysis System (SAS Institute, version 9.2). Outcomes of interest (i.e., gerbil weights, retinol, α-retinol, and carotenoid concentrations) were evaluated using one-way ANOVA and differences among treatment groups were determined using least significant difference tests. One and two-tailed t-tests were used when appropriate. For calculation of bioconversion factors, the mean total liver retinol of the negative control group was subtracted from each treatment group prior to calculation. In study 1, bioconversion factors were calculated in reference to the retinyl acetate dosed group.6 In study 2, bioconversion factors were calculated by taking into account the amount of retinol utilized during the treatment period by the negative control group and the amount of provitamin A carotenoids ingested.27 α < 0.05 was considered significant.
Results
Study 1
In Vitro Digestion of Maize Genotypes
Typically, when the βCX to βC ratio was < 0.045, micellarized βCX was ≤ 6%. However, above this parameter, βCX was highly micellarized at all concentrations (Figure 1A). Incorporating all data points resulted in a positive relationship of βCX concentration and micellarization (P = 0.017). After removing the βCX:βC < 0.045 maize genotypes (n = 6), the slope was not different from zero (P = 0.58). βC micellarization efficiency and total carotenoid micellarized had significant negative relationships with the amount in the maize (Figure 1B and 1C, respectively, P < 0.0001). At lower βC concentrations, i.e., < 5.5 μg/g maize, micellarization was 35.2 ± 12.6%; at concentrations > 8.1 μg/g, it was 17.2 ± 6.6 % (Figure 1B, P < 0.0001). The total amount of βCX + βC micellarized was stable across genotypes (Figure 1D, r = 0.12, P = 0.45).
Figure 1.

The micellarization efficiencies (concentration in aqueous micellar fraction/concentration in internal digesta × 100%) of provitamin A carotenoids from biofortified maize genotypes in relationship to the amount of the carotenoid, either β-cryptoxanthin (βCX, Panel A) or β-carotene (βC, Panel B). The total % micellarized [(μg βC + βCX in aqueous micellar fraction)/(μg βC + βCX in maize)] in relationship to (μg βC + βCX) in maize (Panel C). Total (βC + βCX) micellarized per g maize in relationship to (μg βC + βCX) in maize (Panel D). It is worth noting that the amount of total provitamin A carotenoid micellarized was the same across combined concentrations. Values are means ± SD.
Weights and Feed Intakes
Final gerbil body weights (73.0 ± 5.43 g) and liver weights (2.49 ± 0.46 g) were not different among groups. Feed intake differed among groups and therefore affected daily hypothetical and theoretical retinol intake (Table 1). Fiber differed by 1.5% (P = 0.048) and resistant starch by 1% (P < 0.0001) of total dietary content among the feeds (Table 1).
Tissue Concentrations
Serum retinol concentrations did not differ among groups (1.87 ± 0.90 μmol/L, data not shown). Total liver retinol and retinol concentrations differed among groups (Figure 2, P ≤ 0.0043). All biofortified maize groups showed no difference in liver retinol concentration from each other (Figure 2B) and all maize groups maintained baseline concentrations. When corrected for total retinol/liver by multiplying by liver weight, treatment groups differed, but remained similar to baseline. Two of three high βC maize genotypes achieved liver retinol similar to VA+, while the other was not different from VA- (Figure 2A). Two of four high βCX maize genotypes achieved total liver retinol similar to VA+, while the other two were not different from VA- (Figure 2A). When the theoretical retinol intake (Table 1) is compared between the high βC and βCX groups, intakes differed (P = 0.010), but this difference was not reflected in the increase in liver retinol, which supports the hypothesis that βCX is as bioefficacious as βC on a molar level. The bioconversion factors calculated in reference to the VA in oil dose ranged from 1.2 to 6.1 μmol provitamin A carotenoid to 1 μmol retinol and did not differ between the high βC and βCX maize genotypes (Table 3).
Figure 2.
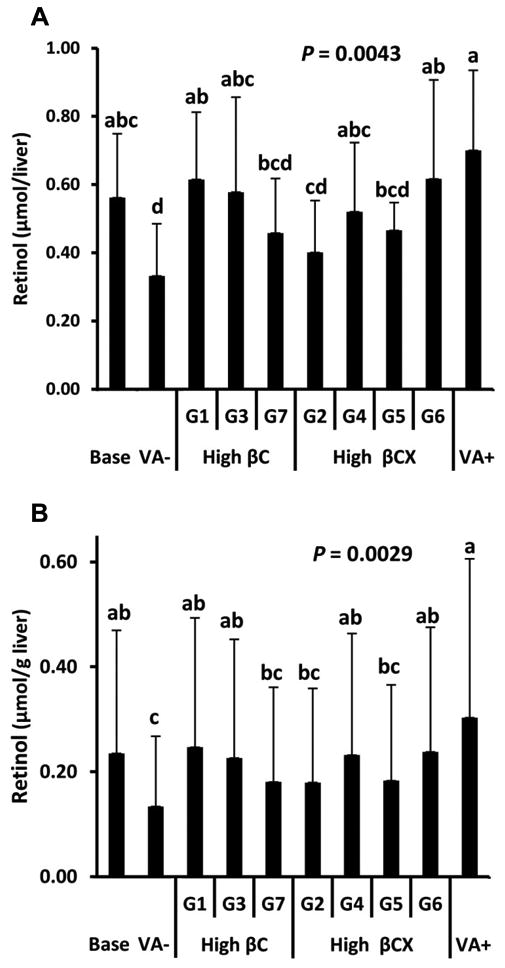
Total liver retinol (A) and retinol concentrations (B) from saponified livers in Mongolian gerbils at baseline after 5 wk of being fed a vitamin A-free feed (Base, n = 7) or fed vitamin A-free (VA-), 50% high β-carotene maize (G1, G3, G7), high β-cryptoxanthin maize (G2, G4, G5, G6), or vitamin A-free feed with daily retinyl acetate doses (VA+) in study 1 (n = 10/group). All other treatment groups received a plain oil dose matched to the VA+ group for 4 wk. Values are means ± SD.
Table 3. Bioconversion factors in Mongolian gerbils fed high β-carotene or high β-cryptoxanthin maize or 0.5% freeze-dried carrots with different staple food matrices.
| Study 1 | μmol provitamin
A: μmol retinol |
μg provitamin A: μg retinol |
IOM referencea |
% IOM value |
|---|---|---|---|---|
| High β-carotene | ||||
| G1 | 1.2 | 2.3 | 12.0 | 19 |
| G3 | 1.5 | 2.8 | 12.0 | 23 |
| G7 | 3.3 | 6.3 | 12.1 | 52 |
| High β-cryptoxanthin | ||||
| G2 | 6.1 | 11.8 | 21.8 | 54 |
| G4 | 2.3 | 4.4 | 21.5 | 20 |
| G5 | 3.3 | 6.4 | 20.4 | 31 |
| G6 | 1.6 | 3.0 | 21.6 | 14 |
| Study 2 | ||||
|
| ||||
| Carrot alone | 3.2 | 6.0 | 15.1 | 40 |
| Rice matrix | 3.0 | 5.7 | 15.2 | 38 |
| Potato matrix | 2.7 | 5.1 | 15.0 | 34 |
| Banana matrix | 4.4 | 8.2 | 15.3 | 54 |
| Maize matrix | 4.6 | 8.5 | 15.0 | 57 |
The Institute of Medicine (IOM) values7 were calculated by determining the proportion of β-cryptoxanthin and α-carotene in the diet compared with the β-carotene and multiplying by the IOM values of 12:1 for β-carotene and 24:1 for β-cryptoxanthin and α-carotene.
Liver provitamin A carotenoid concentrations reflected those in the feeds and therefore differed (P < 0.0001). Total liver βCX was the same among the four high βCX groups (0.754 ± 0.285 nmol/liver) and low in the high βC groups (0.125 ± 0.203 nmol/liver). Although there were slight differences in βC concentrations in the high βC groups, total liver βC did not differ among high βC groups (3.21 ± 1.16 nmol/liver) or among the high βCX groups (1.54 ± 0.53 nmol/liver). Combined βC and βCX concentrations per g liver [(nmol βC + nmol βCX)/g liver] did not differ among treatment groups, but total liver carotenoid amounts were different (P = 0.031), with more carotenoids generally found in the high βC groups than in the high βCX groups, which supports preferential bioconversion of βCX. Furthermore, βCX:βC in the feed and liver did not differ in the groups fed high βC maize, but was much lower in the liver than feed in those fed high βCX maize (P = 0.0065).
Study 2
Carotenoid, Fiber, and Resistant Starch Concentrations, and Micellarization
The concentrations of αC and βC were higher in the BN feed than other feeds (P < 0.0001) due to naturally occurring carotenoids in banana.11 The theoretical retinol, based on 100% bioefficacy of all feeds (Table 1), exceeded gerbil requirements, which allowed for ample liver storage. Fiber content was lowest in RC feed and highest in the VA-free feeds (P < 0.0001). Resistant starch concentration was highest in the BN and RC feeds and lowest in controls (P < 0.0001). Micellarization efficiency did not differ nor predict findings in vivo (Table 4; r = 0.02), where MZ resulted in lower liver retinol concentrations than PT, RC, BN, and CA (Figure 3).
Table 4. Micellarization efficiencies (aqueous divided by digesta fraction X 100) of α- and β-carotene from 0.5% freeze-dried carrot powder mixed with staple foods in feeds fed to Mongolian gerbils in study 2a.
| Component | Micelle
fraction α-carotene |
Micelle
fraction β-carotene |
Micelle fraction theoretical retinol |
|---|---|---|---|
|
| |||
| % | |||
|
|
|||
| 60% Potato | 6.5 ± 5.0 | 5.7 ± 3.0 | 18 ± 5.3 |
| 60% Rice | 12 ± 7.4 | 13 ± 5.4 | 37 ± 11 |
| 60% Banana | 26 ± 20 | 14 ± 14 | 54 ± 23 |
| 60% Maize | 10. ± 0.2 | 12 ± 1.0 | 33 ± 11 |
| Carrot only | 11 ± 5.0 | 9.0 ± 5.2 | 29 ± 8.3 |
Figure 3.
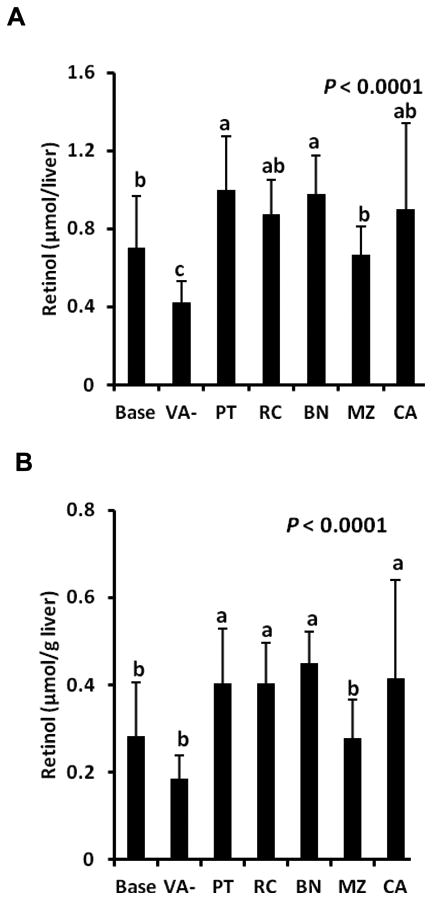
Total liver retinol (A) and retinol concentrations (B) from saponified livers in Mongolian gerbils at baseline after 4 wk of being fed a vitamin A-free feed (Base, n = 6); or fed 60% potato (PT), rice (RC), banana (BN), or maize (MZ) with 0.5% high β-carotene carrot, or vitamin A-free feed with (CA) or without (VA-) 0.5% high β-carotene carrot for 4 wk in study 2 (n = 10/group). Values are means ± SD.
Weights and Intakes
Final gerbil weights were higher in the BN and MZ (74.1 ± 6.2 g) groups than in CA, VA-, and RC groups (68.4 ± 3.0 g, P = 0.0036). Liver weights were highest in the PT group (2.61 ± 0.59 g) and lowest in the CA, RC, and BN groups (2.20 ± 0.27 g). Percent liver weight was higher in PT, MZ, and VA- groups (3.46 ± 0.53%) than BN group (2.91 ± 0.23%, P = 0.020). Feed (P = 0.024) and theoretical retinol intakes (P < 0.0001) were highest in BN group and lowest in RC group (Table 1).
Tissue Concentrations
Serum retinol concentrations did not differ (1.34 ± 0.19 μmol/L, data not shown). Total liver retinol was highest in the PT and BN groups and lowest in VA- (Figure 3A, P < 0.0001). Liver retinol concentrations did not differ among the PT, RC, BN, and CA groups, but the MZ group was lower and did not differ from baseline or VA- groups (Figure 3B, P < 0.0001). Total liver α-retinol differed (Figure 4A, P < 0.0001) and was highest in the BN group, which reflected the higher αC concentration. The MZ group had lower α-retinol than the BN and PT groups, but did not differ from the RC and CA groups. Liver α-retinol concentrations differed (Figure 4B, P < 0.0001) and were highest in the BN group followed by PT, RC, and CA groups, which did not differ, and MZ, which was lowest. Bioconversion factors were adjusted for differences in provitamin A carotenoid intakes and ranged from 2.7 μmol carrot provitamin A from PT matrix to 4.6 μmol from MZ matrix producing 1 μmol retinol (36 ± 15% of IOM values; Table 3).
Figure 4.
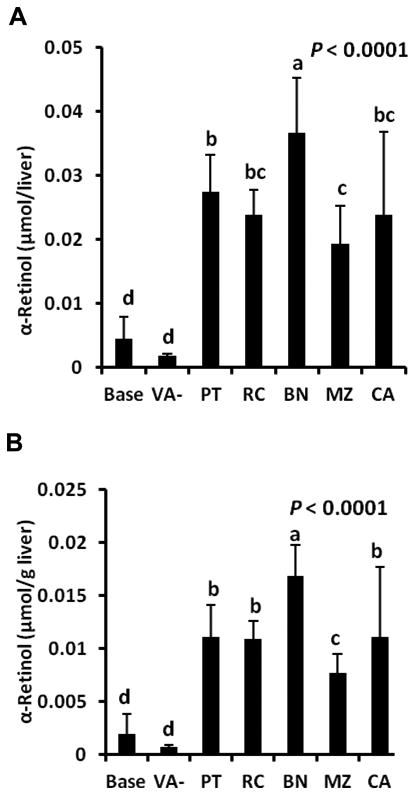
Total liver α-retinol (A) and liver α-retinol concentration (B) from saponified livers in Mongolian gerbils at baseline after 4 wk of being fed a vitamin A-free feed (base, n = 6); or fed 60% potato (PT), rice (RC), banana (BN), or maize (MZ) with 0.5% high β-carotene carrot, or vitamin A-free feed with (CA) or without (VA-) 0.5% high β-carotene carrot for 4 wk in study 2 (n = 10/group). Values are means ± SD.
The PT, RC, and BN (8.11 ± 3.27 nmol αC/liver) groups had more αC than the MZ and CA (4.01 ± 2.04 nmol αC/liver) groups (P = 0.0009). Similarly, βC was higher in the PT, RC, and BN (12.8 ± 5.77 nmol βC/liver) groups than in the MZ and CA (6.47 ± 3.41 nmol βC/liver) groups (P = 0.0025). Liver provitamin A carotenoid concentrations did not reflect those in the feeds. The ratio of αC to βC in the feeds (0.35 ± 0.02) was approximately half of that in the liver (0.63 ± 0.04) (P < 0.0001), which may reflect preferential cleavage of βC. The ratio in the in vitro micellarized fraction was 0.49 ± 0.16, which is mid-way between these two ratios.
Discussion
Biofortification of staple and horticultural crops with provitamin A carotenoids is a promising technique to diminish VA deficiency.28,29 In study 1, % total carotenoid and βC micellarized were negatively correlated with the total amount of provitamin A carotenoid, but the absolute amount micellarized remained relatively stable and was not related to genotype. βCX was not well-micellarized when concentrations were < 0.5 μg/g and βC concentrations were > 8 μg/g. Considering the physiochemical properties of micelles, several reasons explain these findings, which were consistent in this study and largely based on maize genotypes with a similar pedigree (entries 17, 19-22, and 27 in Supplemental Table 1). In vitro, βCX likely did not meet a critical concentration needed for micelle incorporation in the genotypes that had a low βCX:βC.30 Carotenoid interactions are well-documented;31,32 therefore, the polarity difference between βC and βCX may not have allowed the βCX into the overwhelmingly non-polar micellar microenvironment formed from the high βC content in these genotypes. Further, lipid profile differentially affects incorporation of xanthophyll and hydrocarbon carotenoids into micelles.33 Future studies on maize lines that are close to commercialization should include characterization of the endogenous oil. Study 2 demonstrated good micellarization of αC and βC (6 to 26%) compared with other studies (0.2 to 16.7%),18,31 but perhaps higher variability. This is due to the small amount of carrot added to the feed, which acts more like a fortificant and not an endogenous component, which may lead to higher variability among replicates.
In study 1, gerbil feeds were equalized for total carotenoid content by assuming that 1 mol βC or βCX would supply 1 mol retinol; βCX was as good as βC on a molar basis for maintaining VA status, confirming previous studies.6,10 If 2 βCX:1 βC applied, the high βC maize should have resulted in two times the amount of retinol over the high βCX maize because of the hypothetical study design. Although the gerbils maintained balance, based on no difference from baseline regardless of feed, differences in liver reserves existed among genotypes. This important finding, not explained by fiber or resistant starch, demonstrates that other factors, such as endogenous interactive nutrients, must be investigated especially among commercial biofortified lines that are being developed and released.28,34 A recent study in Zambian children showed a genotype effect with biofortified maize intake due to different cooking properties.35 Further, the current study was able to quantify βCX in the livers of gerbils fed biofortified maize. While βCX was quantifiable in a study that fed fruits,36 prior studies with maize did not find quantifiable βCX. Thus, the amounts in the maize likely exceeded gerbil requirements because βCX was absorbed intact and stored.
A review of human studies concluded that the apparent bioavailability of βCX is much higher than that of βC from Western foods.37 Researchers need to consider resources available and the question being asked when selecting an experimental model. No animal model can replace human studies, but Mongolian gerbils are better predictors of provitamin A bioefficacy than rats or mice.38 For example, the range of bioconversion factors among the maize genotypes in study 1 was 2.3 through 11.8 μg provitamin A carotenoids to 1 μg retinol, which is similar to the range from single test meals of biofortified maize in young US women (3.9 through 13.3 μg βC equivalents to 1 μg retinol)8 and Zimbabwean men (1.5 through 5.3 μg βC equivalents to 1 μg retinol).9
In study 2, α-retinol, retinol, αC, and βC were quantified. A negative matrix effect occurred on the uptake and storage of αC and βC from carrot and bioconversion to α-retinol and retinol when gerbils consumed 60% nixtamalized MZ feed, which was not found in the in vitro analysis. On the other hand, PT exhibited the least matrix effects. Based on the gerbil studies, in vitro digestion, which evaluates carotenoid release from the food matrix and micellarization, did not predict bioefficacy, which is regulated by in vivo processes, such as cellular uptake, bioconversion, and chylomicron packaging and secretion.
In agreement with a prior study in gerbils that were fed high-carotene carrot,21 as αC increased, αC liver reserves increased; however, in that study, α-retinol was not quantified. Nonetheless, in a subsequent study, αC was as effective as βC in maintaining liver retinol reserves when fed at double the amount, and quantification of α-retinol implied central cleavage of αC.22 Bioconversion factors in that study revealed 2 αC to 1 βC, but factors were less efficient than IOM values for supplements.7,22 In the current study, a small amount of carrot was fed so that the regulatory systems would not be overwhelmed by carotenoids. In the prior carrot study, the group that was fed high-carotene carrots had only 14% more retinol in the liver than the group fed typical orange carrots but had 120% more βC.21 While post-absorptive bioconversion occurs,39 the major site for meeting daily retinol needs is bioconversion at the gut level. The relative amount of carotenoid fed affects bioconversion.34 In humans and gerbils, extra dietary carotenoid that is not converted to retinol is absorbed and stored, but not currently considered when determining bioavailability. The βC absorbed from biofortified carrot and stored in the liver was 2650% higher in the prior study at 3.3%21 than the current study at 0.5% of the feed. Carrot intake, in contrast to VA supplements, impacts antioxidant capacity of tissues and may support optimal health.40,41
The food matrix effect on the uptake of carotenoids from MZ feed was not due to fiber because the CA feed had more fiber. Soluble fiber had no effect on βC efficacy when feeding gerbils orange sweet potato.14 White maize, as in Masa™ meal, is soaked in limewater (i.e., nixtamalized) to increase some nutrients' bioavailability and other nutrients are sometimes added, which may have affected the bioavailability of the carrot carotenoids. If nixtamalization, which is widely practiced, does have a negative effect on carotenoid utilization, it needs to be further investigated in biofortifed maize products. The processed maize in this study had a negative impact on the bioconversion factor, which is a similar finding to commercially processed banana.36 The BN group utilized endogenous carotenoids despite the presence of resistant starch, which is congruent with previous studies11 and supported by the higher liver α-retinol. All of the mixed feeds maintained or enhanced total liver reserves by the addition of a small amount of carrot as a source of provitamin A carotenoids. As a global measure of bioavailability, the nmol/liver of (retinol + α-retinol + βC + αC) were summed after correcting for the negative control group and differed among the treatments (P = 0.05). PT had the most desirable matrix, endogenous BN carotenoids are bioavailable, and nixtamalized MZ had the least desirable outcome for provitamin A bioefficacy from mixed food.
Determining the many factors that affect carotenoid absorption and utilization from biofortified and mixed foods is important for biofortification and nutrition education efforts to alleviate VA deficiency. While biofortification of staple crops with provitamin A carotenoids is efficacious, adding a little carrot (and perhaps other high provitamin A fruits and vegetables) to the diet had a greater impact on VA status of the gerbils, which highlights the importance of multipronged approaches to eradicate VA deficiency.
Supplementary Material
Acknowledgments
The authors thank Peter Crump for statistical assistance and Mario Ferruzzi's laboratory at Purdue University for the hands-on training of SAA in the in vitro analysis procedures.
Funding: This work was supported by USDA Hatch WIS01528 (SAT), an endowment to SAT entitled “Friday Chair for Vegetable Processing Research”, NIH grant T32-DK007665 (BG), California Fresh Carrot Advisory Board (PWS), and HarvestPlus Agreement 5204 (KVP). HarvestPlus (www.harvestplus.org) is a global alliance of agriculture and nutrition research institutions working to increase the micronutrient density of staple food crops through biofortification. The views expressed do not necessarily reflect those of HarvestPlus.
Abbreviations
- αC
α-carotene
- BN
banana group
- βC
β-carotene
- βCX
β-cryptoxanthin
- CA
carrot group
- IOM
Institute of Medicine
- MZ
maize group
- PT
potato group
- RC
rice group
- UW
University of Wisconsin
- VA
vitamin A
Footnotes
Author Contributions: SS and SC conducted gerbil studies. SS, BG, and SAA conducted in vitro analyses. SS, BG, and SAT analyzed data. SG analyzed samples. NPR and KVP selected and provided biofortified maize. PWS provided high βC carrots. SAT, NPR, and KVP designed research. SS, BG, and SAT wrote the manuscript. All authors have read and approved the final version of the paper.
Notes: None of the authors had any financial interest in the work or a conflict of interest with the sponsors of this study.
References
- 1.FAO. Agricultural commodities: profiles and relevant WTO negotiating issues. [Accessed on October 31, 2012];2003 :5–25. http://www.fao.org/docrep/006/Y4343E/y4343e02.htm.
- 2.Nuss ET, Tanumihardjo SA. Maize: A paramount staple crop in the context of global nutrition. Compr Rev Food Sci Food Saf. 2010;9:417–436. doi: 10.1111/j.1541-4337.2010.00117.x. [DOI] [PubMed] [Google Scholar]
- 3.Ortiz-Monasterio JI, Palacios-Rojas N, Meng E, Pixley K, Trethowan R, Peña RJ. Enhancing the mineral and vitamin content of wheat and maize through plant breeding. J Cereal Sci. 2007;46:293–307. [Google Scholar]
- 4.Howe JA, Tanumihardjo SA. Carotenoid-biofortified maize maintains adequate vitamin A status in Mongolian gerbils. J Nutr. 2006;136:2562–2567. doi: 10.1093/jn/136.10.2562. [DOI] [PubMed] [Google Scholar]
- 5.Nuss ET, Arscott SA, Bresnahan K, Pixley KV, Rocheford T, Hotz C, Siamusantu W, Chileshe J, Tanumihardjo SA. Comparative intake of white- versus orangecolored maize by Zambian children in the context of promotion of biofortified maize. Food Nutr Bull. 2012;33:63–71. doi: 10.1177/156482651203300106. [DOI] [PubMed] [Google Scholar]
- 6.Davis C, Jing H, Howe JA, Rocheford T, Tanumihardjo SA. β-Cryptoxanthin from supplements or carotenoid-enhanced maize maintains liver vitamin A in Mongolian gerbils (Meriones unguiculatus) better than or equal to β-carotene supplements. Br J Nutr. 2008;100:786–793. doi: 10.1017/S0007114508944123. [DOI] [PubMed] [Google Scholar]
- 7.Institute of Medicine. Dietary reference intakes for vitamin A, vitamin K, arsenic, boron, chromium, copper, iodine, iron, manganese, molybdenum, nickel, silicon, vanadium, and zinc. Washington, DC: National Academy Press; 2001. Food and Nutrition Board; pp. 65–126. [PubMed] [Google Scholar]
- 8.Li S, Nugroho A, Rocheford T, White WS. Vitamin A equivalence of the β-carotene in β-carotene-biofortified maize porridge consumed by women. Am J Clin Nutr. 2010;92:1105–1112. doi: 10.3945/ajcn.2010.29802. [DOI] [PubMed] [Google Scholar]
- 9.Muzhingi T, Gadaga TH, Siwela AH, Grusak MA, Russell RM, Tang G. Yellow maize with high β-carotene is an effective source of vitamin A in healthy Zimbabwean men. Am J Clin Nutr. 2011;94:510–519. doi: 10.3945/ajcn.110.006486. [DOI] [PMC free article] [PubMed] [Google Scholar]
- 10.Davis CR, Howe JA, Rocheford TR, Tanumihardjo SA. The xanthophyll composition of biofortified maize (Zea mays Sp.) does not influence the bioefficacy of provitamin A carotenoids in Mongolian gerbils (Meriones unguiculatus) J Agric Food Chem. 2008;56:6745–6750. doi: 10.1021/jf800816q. [DOI] [PubMed] [Google Scholar]
- 11.Bresnahan KA, Arscott SA, Khanna H, Arinaitwe G, Dale J, Tushemereirwe W, Mondloch S, Tanumihardjo JP, De Moura FF, Tanumihardjo SA. Cooking enhances but the degree of ripeness does not affect provitamin A carotenoid bioavailability from bananas in Mongolian gerbils. J Nutr. 2012;142:2097–2104. doi: 10.3945/jn.112.167544. [DOI] [PubMed] [Google Scholar]
- 12.Brown MJ, Ferruzzi MG, Nguyen ML, Cooper DA, Eldridge AL, Schwartz SJ, White WS. Carotenoid bioavailability is higher from salads ingested with fullfat than with fat-reduced salad dressings as measured with electrochemical detection. Am J Clin Nutr. 2004;80:396–403. doi: 10.1093/ajcn/80.2.396. [DOI] [PubMed] [Google Scholar]
- 13.Goltz SR, Campbell WW, Chitchumroonchokchai C, Failla ML, Ferruzzi MG. Meal triacylglycerol profile modulates postprandial absorption of carotenoids in humans. Mol Nutr Food Res. 2012;56:866–877. doi: 10.1002/mnfr.201100687. [DOI] [PubMed] [Google Scholar]
- 14.Mills JP, Tumuhimbise G, Jamil KM, Thakkar S, Failla ML, Tanumihardjo SA. Sweet potato β-carotene bioefficacy is enhanced by dietary fat and not reduced by soluble fiber intake in Mongolian gerbils. J Nutr. 2009;139:44–50. doi: 10.3945/jn.108.098947. [DOI] [PubMed] [Google Scholar]
- 15.Reboul E, Richelle M, Perrot E, Desmoulins-Malezet C, Pirisi V, Borel P. Bioaccessibility of carotenoids and vitamin E from their main dietary sources. J Agric Food Chem. 2006;54:8749–8755. doi: 10.1021/jf061818s. [DOI] [PubMed] [Google Scholar]
- 16.Thakkar SK, Maziya-Dixon B, Dixon AG, Failla ML. β-Carotene micellarization during in vitro digestion and uptake by Caco-2 cells is directly proportional to β-carotene content in different genotypes of cassava. J Nutr. 2007;137:2229–2233. doi: 10.1093/jn/137.10.2229. [DOI] [PubMed] [Google Scholar]
- 17.Kean EG, Hamaker BR, Ferruzzi MG. Carotenoid bioaccessibility from whole grain and degermed maize meal products. J Agric Food Chem. 2008;56:9918–9926. doi: 10.1021/jf8018613. [DOI] [PubMed] [Google Scholar]
- 18.Thakkar SK, Failla ML. Bioaccessibility of pro-vitamin A carotenoids is minimally affected by non pro-vitamin A xanthophylls in maize (Zea mays sp.) J Agric Food Chem. 2008;56:11441–11446. doi: 10.1021/jf802430u. [DOI] [PubMed] [Google Scholar]
- 19.Chitchumroonchokchai C, Schwartz SJ, Failla ML. Assessment of lutein bioavailability from meals and a supplement using simulated digestion and Caco-2 human intestinal cells. J Nutr. 2004;134:2280–2286. doi: 10.1093/jn/134.9.2280. [DOI] [PubMed] [Google Scholar]
- 20.Granado-Lorencio F, Olmedilla-Alonso B, Herrero-Barbudo C, Pérez-Sacristan B, Blanco-Navarro I, Blazquez-García S. Comparative in vitro bioaccessibility of carotenoids from relevant contributors to carotenoid intake. J Agric Food Chem. 2007;55:6387–6394. doi: 10.1021/jf070301t. [DOI] [PubMed] [Google Scholar]
- 21.Dosti MP, Mills JP, Simon PW, Tanumihardjo SA. Bioavailability of β-carotene (βC) from purple carrots is the same as typical orange carrots while high-βC carrots increase βC stores in Mongolian gerbils (Meriones unguiculatus) Br J Nutr. 2006;96:258–267. doi: 10.1079/bjn20061562. [DOI] [PubMed] [Google Scholar]
- 22.Tanumihardjo SA, Howe JA. Twice the amount of α-carotene isolated from carrots is as effective as β-carotene in maintaining the vitamin A status of Mongolian gerbils. J Nutr. 2005;135:2622–2626. doi: 10.1093/jn/135.11.2622. [DOI] [PubMed] [Google Scholar]
- 23.Howe JA, Tanumihardjo SA. Evaluation of analytical methods for carotenoid extraction from biofortified maize (Zea mays sp.) J Agric Food Chem. 2006;54:7992–7997. doi: 10.1021/jf062256f. [DOI] [PubMed] [Google Scholar]
- 24.Bressani R, Rooney LW, Saldivar SOS. Fortification of corn masa flour with iron and/or other nutrients – A literature and industry experience review. US Agency for International Development; Washington, DC: 1997. [Google Scholar]
- 25.Champ M. Determination of resistant starch in foods and food products: Interlaboratory study. Eur J Clin Nutr. 1992;46:S51–S62. [PubMed] [Google Scholar]
- 26.Mertens DR. Gravimetric determination of amylase-treated neutral detergent fiber in feeds with refluxing in beakers or crucibles: Collaborative study. J AOAC Int. 2002;85:1217–1240. [PubMed] [Google Scholar]
- 27.Mills JP, Simon PW, Tanumihardjo SA. β-Carotene from red carrot maintains vitamin A status, but lycopene bioavailability is lower relative to tomato paste in Mongolian gerbils. J Nutr. 2007;137:1395–1400. doi: 10.1093/jn/137.6.1395. [DOI] [PubMed] [Google Scholar]
- 28.Pixley K, Palacios-Rojas N, Babu R, Mutale R, Surles R, Simpungwe E. Biofortification of maize with provitamin A carotenoids. In: Tanumihardjo SA, editor. Carotenoids and Human Health. Springer Science and Business Media; New York, NY: 2013. pp. 271–292. [Google Scholar]
- 29.Simon PW, Bowman MJ, Tanumihardjo SA. Horticultural crops as a source of carotenoids. In: Tanumihardjo SA, editor. Carotenoids and Human Health. Springer Science and Business Media; New York, NY: 2013. pp. 293–301. [Google Scholar]
- 30.Moulik SP. Micelles: Self-organized surfactant assemblies. Current Sci. 1996;71:368–376. [Google Scholar]
- 31.Tyssandier V, Lyan B, Borel P. Main factors governing the transfer of carotenoids from emulsion lipid droplets to micelles. Biochim Biophys Acta. 2001;1533:285–292. doi: 10.1016/s1388-1981(01)00163-9. [DOI] [PubMed] [Google Scholar]
- 32.Kostic D, White WS, Olson JA. Intestinal absorption, serum clearance, and interactions between lutein and β-carotene when administered to human adults in separate or combined oral doses. Am J Clin Nutr. 1995;62:604–610. doi: 10.1093/ajcn/62.3.604. [DOI] [PubMed] [Google Scholar]
- 33.Fernandez-Garcia E, Minguez-Mosquera MI, Perez-Galvez A. Changes in composition of the lipid matrix produce a differential incorporation of carotenoids in micelles. Interaction effect of cholesterol and oil. Innovative Food Sci Emerging Technol. 2007;8:379–384. [Google Scholar]
- 34.Tanumihardjo SA, Palacios N, Pixley KV. Provitamin A carotenoid bioavailability: What really matters? Int J Vitam Nutr Res. 2010;80:336–350. doi: 10.1024/0300-9831/a000042. [DOI] [PubMed] [Google Scholar]
- 35.Schmaelzle S, Kaliwile C, Arscott SA, Gannon B, Masi C, Tanumihardjo SA. Nutrient and non-traditional food intakes by Zambian children in a controlled feeding trial. Food Nutr Bull. 2014 doi: 10.1177/156482651403500108. In press. [DOI] [PMC free article] [PubMed] [Google Scholar]
- 36.Arscott SA, Howe JA, Davis CR, Tanumihardjo SA. Carotenoid profiles in provitamin A-containing fruits and vegetables affect the bioefficacy in Mongolian gerbils. Exp Bio Med. 2010;235:839–848. doi: 10.1258/ebm.2010.009216. [DOI] [PubMed] [Google Scholar]
- 37.Burri BJ, Chang JST, Neidlinger TR. β-Cryptoxanthin- and α-carotene-rich foods have greater apparent bioavailability than β-carotene-rich foods in Western diets. Br J Nutr. 2011;105:212–219. doi: 10.1017/S0007114510003260. [DOI] [PubMed] [Google Scholar]
- 38.Tanumihardjo SA. Report: WHO technical consultation on vitamin A in newborn health: Mechanistic studies. World Health Organization; Geneva, Switzerland: 2012. Mammalian models for understanding mechanisms of retinol and retinoid actions; pp. 93–108. [Google Scholar]
- 39.Tang G, Qin J, Dolnikowski GG, Russell RM. Short-term (intestinal) and long-term (postintestinal) conversion of β-carotene to retinol in adults as assessed by a stableisotope reference method. Am J Clin Nutr. 2003;78:259–266. doi: 10.1093/ajcn/78.2.259. [DOI] [PubMed] [Google Scholar]
- 40.Mills JP, Simon PW, Tanumihardjo SA. Biofortified carrot intake enhances liver antioxidant capacity and vitamin A status in Mongolian gerbils. J Nutr. 2008;138:1692–1698. doi: 10.1093/jn/138.9.1692. [DOI] [PubMed] [Google Scholar]
- 41.Sun T, Simon PW, Tanumihardjo SA. Antioxidant phytochemicals and antioxidant capacity of biofortified carrots (Daucus carota L.) of various colors. J Agric Food Chem. 2009;57:4142–4147. doi: 10.1021/jf9001044. [DOI] [PubMed] [Google Scholar]
Associated Data
This section collects any data citations, data availability statements, or supplementary materials included in this article.