

Abstract
The blood-brain barrier (BBB) presents a significant obstacle for the treatment of many central nervous system (CNS) disorders, including invasive brain tumors, Alzheimer’s, Parkinson’s and stroke. Therapeutics must be capable of bypassing the BBB and also penetrate the brain parenchyma to achieve a desired effect within the brain. In this study, we test the unique combination of a noninvasive approach to BBB permeabilization with a therapeutically relevant polymeric nanoparticle platform capable of rapidly penetrating within the brain microenvironment. MR-guided focused ultrasound (FUS) with intravascular microbubbles (MBs) is able to locally and reversibly disrupt the BBB with submillimeter spatial accuracy. Densely poly(ethylene-co-glycol) (PEG) coated, brain-penetrating nanoparticles (BPNs) are long-circulating and diffuse 10-fold slower in normal rat brain tissue compared to diffusion in water. Following intravenous administration of model and biodegradable BPN in normal healthy rats, we demonstrate safe, pressure-dependent delivery of 60 nm BPNs to the brain parenchyma in regions where the BBB is disrupted by FUS and MBs. Delivery of BPNs with MR-guided FUS has the potential to improve efficacy of treatments for many CNS diseases, while reducing systemic side effects by providing sustained, well-dispersed drug delivery into select regions of the brain.
Keywords: nanoparticles, focused ultrasound, central nervous system
INTRODUCTION
Many therapeutic agents have potential for treatment of central nervous system (CNS) disorders; however, few are able to cross the blood-brain barrier (BBB) and/or penetrate within CNS tissue. The BBB is essential for the maintenance of the CNS environment and regulates the traffic of most molecules to and from the brain [1, 2]. Unfortunately, the BBB also limits systemically administered drugs from reaching the brain in therapeutically relevant concentrations [3,4]; thus, drug dose and efficacy are often limited by systemic side effects [5]. In the case of some CNS disorders, such as glioblastoma, Alzheimer’s, Parkinson’s, cerebral palsy, epilepsy and stroke, the BBB can be impaired and “leaky” [6-8]; however, this impairment is often heterogeneous and diseased cells are often found in normal brain parenchyma in regions supplied by healthy blood vessels with normal BBB function [9]. Other CNS disorders, including lysosomal storage diseases[10], depression [11], and recurrent migraines [12] present even higher obstacles to effective drug delivery into the brain.
Transcranial MRI-guided focused ultrasound (MRgFUS) can non-invasively permeabilize the BBB in a safe, reversible fashion. Image guidance adds the ability to target specific regions with a high degree of accuracy [13-15]. Using this strategy, standard microbubble (MB) contrast agents [16-18] are first injected intravenously. In the region receiving FUS, the MBs are activated, producing a variety of mechanical, chemical and thermal effects [19-24] that lead to a transient disruption of tight junction complexes and induction of active transport of agents into the brain parenchyma [25-27]. Small animal studies have demonstrated that the BBB or blood-tumor barrier permeability is increased by MRgFUS [28], improving delivery of therapeutic agents, such as Herceptin and Doxil, antibody- and liposomal-based delivery systems respectively, as well as treatment outcomes in experimental models of diseases such as glioma and Alzheimer’s [29, 30] [31, 32]. Additionally, MRgFUS-mediated BBB disruption in non-human primates was shown to be safe and accurate, while producing no significant brain tissue damage or compromised visual function in highly eloquent occipital cortex regions [15].
Once therapeutics cross the BBB, they next encounter a complex microenvironment within the brain extracellular space (ECS), which significantly limits and controls their movement. The ECS is anisotropic with mixed electrostatically charged and hydrophobic regions comprising 15-20% of the total normal brain volume [33]. Although it was previously thought that a therapeutic nanoparticle must be smaller than 64 nm to penetrate within the ECS [34], it was recently shown that much larger particles, up to 114 nm in size, can penetrate within normal brain parenchyma, if densely coated with low molecular weight poly(ethylene glycol) (PEG) [35]. PEG sterically stabilizes nanoparticles and minimizes protein absorption, increasing nanoparticle circulation time. However, PEGylated stealth particles also show decreased interactions with cells, limiting cell uptake or passage across an intact BBB. MRgFUS has yet to be combined with a drug delivery platform that can provide sustained release of a therapeutic and can overcome the tissue-penetration barrier within the brain microenvironment once crossing a permeabilized BBB.
The ideal method to deliver drugs to the CNS would include (i) a stealth circulating nanoparticle that can avoid rapid clearance by the reticuloendothelial system (RES), (ii) a noninvasive approach to bypass the BBB, (iii) the ability of the nanoparticle to penetrate within the brain parenchyma and (iv) provide sustained release of a therapeutic agent at the sites of disease. We hypothesized that coupling MRgFUS-mediated BBB opening with circulating, brain penetrating nanoparticles (BPNs) would achieve significant accumulation and spread of BPNs in select regions of the brain with minimal side-effects. We designed and characterized the behavior of densely PEGylated NPs within brain tissue and demonstrated that 60 nm BPNs can penetrate the rat brain parenchyma when delivered with MRgFUS. This is the first study to show, in combination with MRgFUS and MBs, the successful trans-BBB delivery of a biodegradable polymeric nanoparticle that is capable of penetrating within the brain microenvironment. This approach represents a promising strategy to overcome the significant hurdles for drug delivery to the brain and improve therapeutic efficacy for many CNS diseases.
MATERIALS and METHODS
Nanoparticle preparation and characterization
Model nanoparticles were prepared as previously described [35]. Briefly, 40- to 200-nm red fluorescent COOH-modified polystyrene (PS) particles (Molecular Probes) were covalently modified with methoxy (MeO)-PEG-amine (NH2) (5 kDa MW; Creative PEG Works) by carboxyl amine reaction. An excess of MeO-PEG-NH2 was added to the PS particle suspension and mixed to dissolve the PEG. N-Hydroxysulfosuccinimide (Sigma) was added to the reaction tube and 200 mM borate buffer, pH 8.2, was added to a 4-fold dilution of the starting volume. 1-Ethyl-3-(3-dimethylaminopropyl) carbodiimide (EDC, Invitrogen) was added and particle suspensions were placed on a rotary incubator for 4 hours at 25°C, then centifuged (Amicon Ultra 0.5 mL 100k MWCO; Millipore). Particles were resuspended in ultrapure water to the initial particle volume (100 μL) and stored at 4°C until use.
Polymer labeling with a fluorescence dye
PEG-PLGA (75:25) (25% PEG) copolymers (Total MW: 20 kDa; Jinan Daigang Biomaterials Co. Ltd., Jinan, China) were labeled with AlexaFluor 555 cadaverine (AF 555, Molecular Probes) or AlexaFluor 647 cadaverine (AF647, Molecular Probes) fluorescence dye, as described previously [36]. Briefly, the polymer was first dissolved in dichloromethane (DCM) and was activated by p-nitrophenyl chloroformate and pyridine. The reaction was carried out for 3 hours under constant stirring. The activated polymer was precipitated in 4°C diethyl ether, washed in dimethylformamide (DMF) and dried overnight under vacuum. Then, the activated polymer and the AF 555 dye were dissolved DMF, and triethylamine was added immediately to the polymer-dye mixture. The reaction was carried out for 4 hours under constant stirring. The fluorescently labeled polymer was precipitated in 4°C diethyl ether, washed in DMF, and dried overnight under vacuum. Polymers were stored at −20°C in the dark until use.
Formulation of nanoparticles in CHA for MRgFUS studies
Fluorescently labeled PEG5k-PLGA15k polymer was dissolved in 1 mL DCM at 20 mg/mL. The polymer solution was added to 5 mL cholic acid (0.5% CHA) immediately followed by sonication (30% magnitude for 2 min) in an ice water bath. Then, the emulsified solution was added to 25 mL of surfactant solutions and stirred for three hours to remove solvent. The sample solutions were filtered and collected. PEG-PLGA nanoparticles made in 0.5% CHA were collected by using centrifugal filtering units (MWCO: 100 kDa, Millipore Ltd. Ireland) at 3600 x g for 12-16 min so that the final sample volume in the filter unit was less than 1 mL. The nanoparticles were washed three times in ultrapure (UP) water. Particle size, surface charge, and PDI were characterized as described above.
Nanoparticle diffusion in ex vivo and in vivo rodent brain
All animal experiments were carried out at Johns Hopkins University School of Medicine following National Institutes of Health guidelines and local Institutional Animal Care and Use Committee regulations. Rat brain tissue slices were prepared as described previously [35]. 0.5 μL of fluorescently labeled nanoparticles were injected into the gray matter region using a 10 μL syringe (Hamilton Company, Reno, NV).
For in vivo spread, a cranial window technique was used, as previously described [35]. Briefly, a warm agarose solution (20% w/v) was placed over the exposed brain region and a 5-mm glass coverslip was quickly placed prior to agarose cooling and gelatinization to create a stable window. A custom circular metal bar was secured to the adjacent bone and cement (HyBond, Inc.) was then applied to secure the agarose, glass, and metal bar construct rigidly to the calvarium. A channel representing approximately 90 degrees of the cover glass circle was not cemented and left exposed for the glass pipette to insert into the brain. The cranial bar was secured to a custom microscope stage allowing stable imaging of the anesthetized mouse. An upright confocal microscope (Zeiss, Inc.) with a two-photon laser source (Coherent Inc.) tuned to 910 nm was used for imaging through a 20× microscope objective [Zeiss Inc., Plan-Apochromat (NA, 1.0; working distance, 1.9 mm)]. Images were collected using a non-descanned detector. The micro-injection apparatus attached to a stereotactic manipulator (Drummond Scientific Inc.) was fixed with a glass micropipette (tip diameter ~30 μm), loaded with NP solution, and positioned for injection through the agarose channel into the brain. A blood vessel—free region of cortex was identified, and the micro-pipette was inserted to a depth of 100-200 μm below the pial surface and withdrawn slightly to create a small pocket to receive the injection. The nano-injection device was set to inject 9.2 nL of particle solution at a rate of 23 nL/s.
Multiple particle tracking in rat brain slices
The transport rate of particles was determined by analyzing the trajectories of the particles as described previously [35, 37]. The particle trajectories in brain tissue slices were recorded by a silicon-intensified target camera (VE-1000, Dage-MTI, Michigan, IN) mounted on an inverted epifluorescence microscope equipped with a 100x oil-immersion objective (N.A., 1.3). Rat brain tissue specimens (N = 3) were used for each particle type. The average pore size of the brain ECS and pore size range were estimated based on fitting an obstruction scaling model to the measured particle diffusion rates of PS-PEG nanoparticles using maximum likelihood estimation [38]. The model is valid in cases where there is limited interaction between the particles and the ECS components, and where fluid in the ECS exhibit micro-viscosity similar to that of water.
Histopathological analysis of rat brain slices
The rat brain tissue slices were studied using standard hematoxylin and eosin (H&E) staining to identify any changes in histological architecture and cell morphology introduced by the preparation and incubation process. Representative tissue slices (n = 3) were preserved in formalin immediately following sectioning in the laboratory and after completing data acquisition, approximately 3 hours following removal, preparation, incubation, and particle imaging. The tissue was removed from the formalin after 24 hours and placed in 70% ethanol solution until paraffin embedding, sectioning, and H&E staining. The tissue sections were examined by a board-certified neuropathologist (C.E.) for evidence of tissue changes or damage.
Circulation Studies
All animal experiments were carried out at Johns Hopkins University School of Medicine following National Institutes of Health guidelines and local Institutional Animal Care and Use Committee regulations. Female CF-1 mice (Harlan), 6-8 weeks old, were placed under a heat lamp for several minutes until blood vessels in the tail were dilated. The mice were then placed upright in a mouse tail vein restrainer (Braintree Scientific), by pulling the mouse by the tail through the slotted tube. The mouse is then restrained by a plug and the tail was swabbed with a 100% ethanol swab. 100 μl of near-infrared particle suspension in PBS were injected into the tail vein using a 0.5 ml insulin syringe. Mice were imaged at 6 hour, 12 hour, 16 hour, 24 hour, and every day up to one week using the Xenogen IVIS Spectrum optical imaging device and Living Image software (both from Caliperls, Hopkinton, MA). The same imaging parameters were used at all timepoints for all images, with a 5 second exposure and 8 binning.
Microbubble Fabrication and Characterization
The albumin MBs used in this study are similar to Optison (GE Healthcare). MBs were produced by sonicating (20 KHz, 30 s) a 1% solution of serum albumin in normal saline with an ultrasound disintegrator (XL2020, Misonix, Farmingdale, NY) equipped with an extended ½” titanium probe. The headspace in the flask containing the solution was filled with octafluoropropane gas. MBs were sized and counted using a Coulter Counter (Multisizer 3, Beckman Coulter, Fullerton, CA) with an orifice size of 50 μm and a lower measurement limit of 1 μm.
MRgFUS-mediated NP delivery
All FUS-related animal experiments were carried out at the University of Virginia following National Institutes of Health guidelines and local Institutional Animal Care and Use Committee regulations. On the day of treatment, Sprague-Dawley rats (180-220 g) were anesthetized with an intraperitoneal injection of Ketamine (40 mg/kg, Fort Dodge) and Dexdomitor (0.2 mg/kg, Pfizer) in sterilized water. A tail vein catheter was inserted to allow intravenous (i.v.) delivery of microbbubles, nanoparticles and contrast agent. Animal skulls were depilated and positioned in a degassed water bath coupled to the FUS system. Rats received an i.v. co-injection of nanoparticles (15 μg/g body weight) and MBs (3.5E5 MBs/g body weight). Sonication was initiated immediately following the clearing of the dead space in the catheter, 10-15 seconds after MB and NP delivery.
All sonications were performed using a 1.14 MHz single element focused transducer (FUS Instruments, Toronto, CA) operating at a 0.5% duty cycle for 2 minutes. Peak negative pressure was either 0.4 MPa or 0.6 MPa for NP delivery experiments. Prior to placing the animal on the MRI table, the FUS system was passively aligned with a 3T MRI system (Trio, Siemens) using an anechoic Zerdine phantom (CIRS, Inc, Norfolk, VA). After the animal was coupled to the FUS system, high resolution T1-weighted pre-scans were performed and utilized to plan sonication focal points with high accuracy. Four locations were sonicated in each animal, spaced 3 mm apart coronally, 2 mm to either the left or right of the interhemispheric fissure, and 5 mm from the top of the skull. Care was taken to remain within the cerebral hemispheres, avoiding the cerebellum and ventricles. All four locations were sonicated within one 2 minute sonication period using interleaved sonication mode. Immediately following sonication, MRI contrast agent (0.5 μl/g body weight, Magnevist, Bayer Health Care, PA) was delivered intravenously and T1-weighted contrast enhanced images were captured to verify BBB disruption. Animals were then removed from the MRI table and placed on a heating pad at 37°C for one hour to allow increased nanoparticle uptake and diffusion within the brain parenchyma. 2% heparinized saline (0.5 mL) was delivered intravenously 30 minutes post sonication and again (1.0 mL) one hour post sonication. Animals were euthanized following the last saline injection with pentobarbital (0.5 μl/g body weight).
MR Thermometry
MRI thermometry was performed in two rats not receiving NP injections, as the movement of the transducer necessary to perform interleaved sonication interfered with image capture. Each rat was sonicated eight times, four locations at 0.6 MPa in the left hemisphere and four locations at 0.4 MPa in the right hemisphere. Sonications were performed individually using the protocol previously described. MBs were reinjected immediately prior to each sonication and six minutes elapsed between each sonication to ensure that bubbles from the previous sonication had been fully cleared. Thermometry scans were performed every 5 seconds beginning 10 seconds before sonication and ending 20 seconds after completion of the sonication. Rats received MRI contrast agent (0.5 μl/g body weight, Magnevist®, Bayer Health Care, PA) after all eight sonications had been completed. High resolution T1-weighted scans were captured before initiating sonication and immediately following Magnevist® injection.
MR T2* Imaging
T2* images were captured from twelve rats not receiving NP injections. For all animals, high-resolution T1- and T2*-weighted images were captured before and after sonication. Up to eight locations were sonicated in each animal, no more than four in each hemisphere as described for the NP delivery group. Two separate sonications were performed, one per hemisphere, using interleaved sonication mode. Pressures ranged from 2.0 to 0.4 MPa. Sonications were spaced six minutes apart to allow clearance of the previous dose of MBs. MRI contrast agent (0.5 μl/g body weight, Magnevist®, Bayer Health Care, PA) was delivered intravenously after sonication and T2*-weighted imaging, followed by high resolution T1-weighted scans to verify BBB disruption.
MRI Image Processing
T1-weighted contrast enhanced images
T1-weighted post-sonication images were analyzed in MATLAB (Mathworks, Natick, MA) using a code developed in our lab. Contrast enhanced regions were identified using a threshold defined as 45% of the maximum contrast in the image. Control ROIs in the non-sonicated hemisphere were subtracted from the enhanced ROIs to determine the FUS-induced intensity enhancement. ROI size and average intensity were recorded.
Thermometry
MRI thermometry data were analyzed in MATLAB using a code developed by Dr. Miller (Radiology, UVA, Charlottesville, VA). A baseline phase image was reconstructed from an average of 3 pre-sonication scans. All phase images captured during sonication were averaged and the baseline phase image was subtracted. This average phase change image was converted to temperature change and overlaid on high resolution T1-weighted contrast enhanced post-sonication images.
Processing and imaging of sonicated brain tissue
Following euthanasia, animals’ left and right carotid arteries were cannulated. Each artery was perfused with 22 mL 2% heparinized saline prior to brain excision. Brains were dessicated in a 30% sucrose solution at 4°C for 24 hours or until brains sunk. Dessicated brains were placed in O.C.T. compound (Sakura Finetek, Torrance, CA) for one hour at 21°C before freezing at −80°C. Transverse 8 μm cryosections were mounted, stained with a 1:200 Lectin 488 (Invitrogen, Grand Island, NY) solution for 1.5 hours at 21°C and sealed with Prolong Gold (Invitrogen, Grand Island, NY) for imaging. Rat brain sections were imaged on a Nikon TE300 confocal microscope equipped with a 20x oil objective. An Optronics QuantiFIREXI camera was used to capture the images for analysis.
Confocal images were analyzed in MATLAB using a code developed in our lab. The nanoparticle (far red channel) and endothelial (green channel) signals were separated for processing. Greyscale intensity images were morphologically opened and converted to black and white to remove background signal. The original grayscale image was masked using this black and white image, followed by local Otsu thresholding to eliminate overexposure. Finally, morphological closing was used to fill out object borders. The processed nanoparticle and endothelial cell images were subtracted to separate nanoparticle signal originating within blood vessels from interstitial nanoparticle signal. Nanoparticle “cloud” area, defined as thresholded NP objects outside of blood vessels, was calculated from this subtracted image as well. In addition, the percentage of vessels containing NPs or in close proximity to a NP cloud (“NP+ Vessels”) was counted from the processed confocal images.
RESULTS
Transport of BPN in normal rat brain ECS
To ensure large, therapeutically relevant nanoparticles could penetrate within the rodent brain, we first determined the effect of particle size and surface chemistry on transport rates of modified particles in rat brain tissue. The hydrodynamic diameters of the particles are listed in Table 1. The 100-nm and 200-nm COOH-modified particles displayed low transport rates in freshly excised viable rat brain slices, as measured by arithmetic ensemble mean squared displacements (<MSD>) (Figure 1A). At a time scale of 1s, 50-nm, 100-nm, and 200-nm PSCOOH particles were 20,000-80,000-fold slower in an unobstructed physiological relevant medium, artificial cerebral spinal fluid (ACSF), than the equivalent PS-COOH particles.
Table 1. Physicochemical properties of polystyrene nanoparticles and their diffusivity in normal rat brain tissue compared to in ACSF.
Effective diffusivity of NPs in normal brain tissue (Db) was calculated at a time scale of 1 s. NP diffusivity in ACSF (DACSF) was calculated with Stokes-Einstein equation and mean particle diameter. Size was provided by the manufacturer, and actual diameter in ACSF at pH 7.0 was measured with dynamic light scattering. ζ-potential and PDI were measured in ACSF at pH 7.0. Size, ζ-potential, and PDI were all measured after 24-hour incubation in ACSF.
| Commercially Supplied Size (nm) |
Surface Modification |
Mean Diameter ± SEM (nm) |
ζ-potential ± SEM (mV) |
DACSF/Db |
|---|---|---|---|---|
| 40 | COOH | 54 ± 0.4 | −36 ± 2 | 76,000 |
| 40 | PEG5k | 61 ± 6 | −0.7 ± 3 | 9* |
| 100 | COOH | 95 ± 2 | −42 ± 2 | 16,000 |
| 100 | PEG5k | 108 ± 3 | −2.9 ± 1 | 60* |
| 200 | COOH | 205 ± 1 | −40 ± 2 | 48,000 |
| 200 | PEG5k | 242 ± 6 | −5.4 ± 1 | 2,600 |
p <0.05
Figure 1. Transport rates of various sized nanoparticles in normal rat brain neocortical slices.

(A) Ensemble-averaged geometric mean square displacements (<MSD>) as a function of time scale for 50 nm, 100 nm, and 200 nm PS-PEG and PS-COOH. Data represent the ensemble average of at least three independent experiments, with n ≥ 100 particles for each experiment. For each experiment, the transport rates of all three particle sizes with two different surface properties were measured in the same brain tissue. Dotted lines indicate theoretical MSD values for the same size PS particles in ACSF. (B) Representative trajectories for 60 nm, 110 nm, and 240 nm PS-PEG in brain tissue exhibiting an MSD equal to the ensemble average at a time scale of 1 s. (C) In vivo spread of 50 nm PS COOH and 60 nm PS PEG5k in normal rodent brain.
We have previously demonstrated we can achieve a dense coating of PEG, 0.9 PEG per nm2, on 50-, 100-, and 200-nm PS particles [35]. In this study, the extent of PEG attachment was comparable for all particle sizes as shown by their near-neutral surface charges (Table 1), comparable to our previously reported findings [35]. PEGylation greatly increased particle transport rates for 60- and 110-nm particles (PS-PEG). 60-nm and 110-nm PS-PEG particles showed only 9-fold and 60-fold slower diffusion (τ = 1 s) in brain tissue, respectively, compared with corresponding particles of the same size in ACSF (Figure 1A, B). The 240-nm PS-PEG particles showed a smaller increase in particle transport compared to uncoated particles of the same size, likely due to significant steric obstruction within the brain ECS, supported by representative particle trajectories (Figure 1A).
To further evaluate the extent of impediment to particle transport, the τ-dependent, mean-squared displacement <MSD> was fitted to the equation <MSD>= 4Doτα, where Do is the τ-dependent diffusivity and α is the anomalous diffusion exponent that reflects the extent of impediment. An α = 1 represents unobstructed Brownian diffusion, such as particles in ACSF; α becomes smaller as obstruction to particle diffusion increases. The α value for 240-nm PS-PEG particles was 0.48, compared to an α value of 0.78 for 110 nm PS-PEG particles. The α value for COOH-modified particles for both 100- and 200-nm PS particles were 0.20 and 0.22, respectively. As expected from the high transport rates of 60-nm PS-PEG particles, the α value was 0.92 compared to an α value of 0.18 for 50 nm PS-COOH particles, further confirming unhindered diffusion of 60-nm PEG-coated particles in brain ECS, slightly hindered diffusion of 110 nm well coated particles, and hindered diffusion of 240-nm PEG-coated particles.
Using live-animal imaging, we directly observed 60-nm NP penetration in vivo in mouse brains to confirm findings obtained using ex vivo tissue slices (Figure 1C). Red-fluorescent, COOH-coated NPs and PEG-coated NPs were injected 200 μm deep into the mouse cerebral cortex in two regions free of blood vessels, and imaged over a 30 minute time frame. Real-time video microscopy showed that the COOH-coated NPs were immobilized within the tissue, whereas PEG-coated NPs penetrated up to 150 μm into the tissue within 30 minutes.
Ex vivo tissue integrity during multiple particle tracking
As confirmed with previous ex vivo brain slice models [35], representative hematoxylin and eosin (H&E)-stained sections indicated no differences between immediate tissue removal (30 minutes) and 3 hours after tissue removal, processing, particle administration, and imaging (Figure S1). The lack of cellular swelling, pyknotic nuclei, and ischemia suggests minimal tissue damage was introduced by tissue processing and particle tracking, confirming that the tissue maintains intact cytoarchitecture and functioning tissue physiology within the experimental time frame.
Characterization of effective pore sizes in the brain ECS
To ensure that the observed rapid transport of PEGylated nanoparticles was not biased by a small fraction of fast moving outlier particles, we evaluated the heterogeneity in particle transport rates by examining the distribution of individual particle diffusivities at 1 s (Figure 2A). The fastest 75 percent of 60-nm and fastest 65 percent of 110-nm PS-PEG particles exhibited uniformly rapid transport, compared to the fastest 15 percent of 240-nm PS-PEG particles. Fast moving outlier nanoparticles are a subpopulation of interest, as they are more likely to penetrate brain tissue and reach greater distances from the site of entry into the brain. 60-nm PS-PEG particles showed homogenous distribution, with less than an order of magnitude difference between the fastest and slowest group of particles. The fastest 10th percent of 110-nm and 240-nm PS-PEG particles showed 5 and 3 orders of magnitude difference, respectively, from the slowest particles, suggesting that some of the spacing in the ECS could be larger than 100 nm. However, for all other subgroups (i.e. the slowest 90% of particles) 240-nm PS-PEG particles displayed 2 orders of magnitude lower Deff compared to the same subgroups of 60- and 110- nm PS-PEG particles, leading to an average Deff representative of hindered particle transport.
Figure 2. Prediction of normal brain extracellular spacings based on nanoparticle diffusion.

(A) Distribution of the logarithmic Deff of individual nanoparticles (■ PS-PEG5k and □ PS-COOH) at τ = 1 s. Data represents 4 independent experiments, with an average of n > 100 nanoparticles per experiment. (B) Normalized ensemble-averaged diffusivities (<Deff>/DW) for different sized PEG-coated PS particles (60 nm (■), 110 nm (•), and 240 nm (▲)) at τ = 1 s, where DW is the theoretical diffusivities of neutral particles in PBS. The solid and dashed lines represent the range of theoretical <Deff>/DW ratios for various sized 60-, 110-, and 240-nm particles predicted by the obstruction scaling model. This leads to an estimated mesh spacing range in normal rat brain tissue of 20- 230 nm obtained by maximum likelihood estimation fitting to experimental diffusivity ratios. <Deff>/DW from Thorne et al [34] are provided (3 nm (■), 14 nm (▲), and 35 nm(•)) for reference to previously estimated values. (C) Percent pores larger than 100- and 200-nm. Data represents the ensemble average of four independent experiments with n > 100 particles tracked for each experiment.
An effective pore size of the brain ECS could be determined by fitting the measured diffusion rates of 60-, 110-, and 240- nm PS-PEG particles with an obstruction scaling model [35]. Based on the determination that transport was limited due to steric obstruction for larger particles and not due to particle interaction with brain ECS components, diffusion rates for 240-nm PEG-PS particles were incorporated into this model. Using maximum likelihood estimation, the average pore size of normal rat brain ECS was estimated to be between 60-120 nm (Figure 2B). More specifically, we calculated the pore size distribution to range from 20 nm to 230 nm. The largest 20% of pore sizes experienced by particles were > 100 nm and 14% of pore sizes experienced by particles were > 200 nm (Figure 2C). Overall approximately 60% of the pores sampled by probe particles were larger than 50 nm. The pore size modeling further corroborates the transport rates observed with multiple particle tracking, and correlates well with data previously published in normal human brain tissue [35].
Verifying BBB disruption following FUS treatment
To achieve quasi-real time verification of BBB disruption following FUS treatment, gadolinium (Magnevist©, 0.1mL/200g) was delivered intravenously immediately following sonication. T1-weighted images (Figure 3A) were captured to visualize BBB disruption. Images taken from the coronal (Figure 3A, middle column) and sagittal slices (Figure 3A, rightmost column) indicate approximately 2.35 mm3 of BBB disruption (πx0.5mm2x3mm), which agrees with the beam plots of the transducer provided by the manufacturer. Quantitative analysis of the coronal images demonstrates significant differences between the two FUS pressures used. Higher FUS pressure (0.6 MPa) produced a significant 2.3-fold increase in the total area of the enhanced region (Figure 3B) as well as a more moderate significant increase in grayscale intensity within the contrast enhanced focal regions (Figure 3C) when compared to 0.4 MPa. While variations in both the size and intensity of focal spot enhancement were detected at the same pressure, these variations were not significant and care was taken to minimize spatial differences by selecting focal regions in relatively homogeneous areas of the brain, avoiding ventricles and the cerebellum.
Figure 3. FUS-mediated gadolinium delivery in the rat brain is dependent on ultrasound pressure.

(A) MRgFUS-mediated BBB disruption, measured by gadolinium delivery, is enhanced at 0.6 MPa compared to 0.4 MPa, shown by high resolution T1-weighted MR images. Left column, pre-sonication coronal images. Middle column, post-sonication contrast enhanced coronal images. Right column, post-sonication contrast enhanced sagittal images. (B,C) 0.6 MPa produced significantly larger contrast enhanced focal regions and also increased the average grayscale intensity within the focal regions (C), indicating that both area and degree of BBB disruption was increased at 0.6 MPa (n=8, measurements taken from coronal images). * denotes p< 0.05
Verifying safety thresholds for FUS treatment
We performed two MR-based safety studies on additional animals. T2* weighted MR images, which detect red blood cell leakage across the BBB, were taken 2-5 minutes post-sonication at pressures ranging from 0.4 to 2.0 MPa. Hypointense regions indicating the presence of blood in the tissue appeared at 92% of locations (n=39) sonicated with pressures greater than or equal to 0.8 MPa, while only 16% of locations (n=43) sonicated with 0.6 MPa developed hypointensity (Figure S2A). No erythrocyte leakage was detected at 0.4 MPa (n=3). Of note, hypointense regions produced at 0.6 MPa were much smaller and fainter than those produced at higher pressures, and only occurred when sonications were performed close to the olfactory bulb. Additionally, MR thermometry indicated that no thermal rise occurred at the focal spot during the sonications (Figure S2B).
PEG-coated NP circulation in blood prior to FUS
To accumulate in the brain following systemic administration, PEG-coated NPs must avoid clearance from the bloodstream due to phagocytosis by the RES [39]. PEG is a well-established, hydrophilic polymer shown to provide steric stabilization and confer “stealth” properties to prevent protein absorption and clearance by RES [40, 41]. Densely-coated 60-nm PS-PEG NPs circulate at least 24 hours, showing limited accumulation in the liver and spleen (Figure 4A), while PS-COOH NPs of similar size accumulated within 6 hours in the liver and spleen. As demonstrated in Figure 1 and 2, even if PS-COOH were to reach the brain following systemic circulation, these particles would not penetrate within the brain microenvironment.
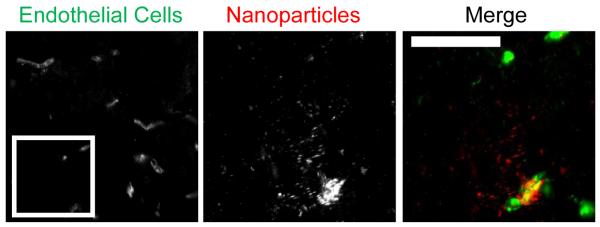
Figure 4. MRgFUS-mediated delivery of 60 nm circulating brain-penetrating nanoparticles is pressure dependent.

(A) Densely PEG-coated 60 nm PS particles (“BPNs”) avoid reticulo-endothelial system clearance and circulate at least 24 hours longer than COOH-coated 40 nm PS particles, which accumulate in the liver. (B) Fluorescent images demonstrate the delivery of fluorescently labeled BPNs to the brain parenchyma at both 0.4 and 0.6 Mpa one hour post-sonication. BPNs were delivered to both the endothelial cells lining the vasculature and the interstitial space surrounding the vessels in sonicated regions. Control regions showed no NP delivery. (C) NP cloud size, defined as the area of thresholded BPN fluorescent intensity outside of the vasculature, is two-fold higher at 0.6 MPa. Any vessel showing BPN delivery (to endothelial cells or the interstitium) is defined as a NP+ vessel. (D) The percentage of NP+ vessels was near 15% for both pressures, but at 0.6 MPa, 50% of the NP+ vessels had delivered BPNs to the brain parenchyma (“NP+ Vessel with Clouds”), compared to only 30% at 0.4 MPa. (E) Higher FUS pressure delivers a significantly larger fraction of BPNs to the interstitial space rather than to the endothelial cells lining the blood vessels. Scale bars, 50 μm. * denotes p<0.05.
NP distribution in the brain following MRgFUS
Analysis of brain sections following FUS treatment indicated that 60 nm PS-PEG demonstrated a FUS pressure dependent delivery trend (Figure 4B). Higher US pressure of 0.6MPa doubled the area of brain parenchyma showing fluorescent enhancement due to NP delivery surrounding a single vessel, defined as a NP “cloud”, compared to NP coverage at 0.4MPa (Figure 4C). A comparison of the percentage of blood vessels in the focal region showing either endothelial cell NP delivery or the production of a NP cloud (collectively termed “NP+ Vessels”) showed no significant difference, while the percentage of these NP+ Vessels that had produced NP clouds was increased (P<0.05) to 50% at the higher US pressure (Figure 4D). The NP clouds were further separated into small and large clouds using a 200 square micron size cutoff based on the average vessel spacing in the brain sections. The higher US pressure produced a significant (P<0.01) 4.6-fold increase in large NP clouds, while also delivering a significantly larger fraction of NPs to the interstitial space (44% compared to 30%, Figure 4E) and tripling NP coverage within the sonicated region.
Biodegradable NP distribution in the brain following MRgFUS
We demonstrate that a clinically relevant, biodegradable polymeric nanoparticle can successfully reach the brain with this approach. We have previously shown that poly(lactic-co-glycolic) acid (PLGA)-PEG NPs (PLGA-PEG) were similar in size and surface charge to PS-PEG NPs and were able to diffuse in normal brain tissue [35]. Following the MRgFUS protocol described above for PS-PEG NPs, we demonstrate delivery of 75-nm PLGA-PEG NPs in the brain in regions where MRgFUS was applied following intravenous administration of PLGA-PEG NPs. NP clouds comparable to those produced by 60nm PS-PEG NPs are clearly visible (Figure 5).
Figure 5. Biodegradable PLGA-PEG NPs distribute in the brain following MRgFUS.
(A) Fluorescent images show delivery of fluorescent biodegradable 75-nm PLGA-PEG particles to both the endothelium and the interstitial space in sonicated regions, as with PS-PEG NPs. FUS pressure was 0.6 MPa. Control regions without MRgFUS showed no NP delivery (not shown). Scale bars, 50 μm.
Correlating NP delivery with gadolinium enhancement
We retrospectively sought to determine whether our high-resolution T1-weighted contrast enhanced coronal MRI images correlate with our fluorescent microscopy NP delivery data. The average grayscale focal spot intensity calculated from the MRI images predicted both the NP clouds per field of view (R2=0.90, Figure 6A) and the percent of vessels with NP clouds (R2=0.79, Figure 6B). Each data point corresponds to a single animal, 4 sonicated at 0.6 MPa and 3 sonicated at 0.4 MPa.
Figure 6. Gadolinium delivery predicts BPN delivery in MRgFUS-mediated BBB disruption.
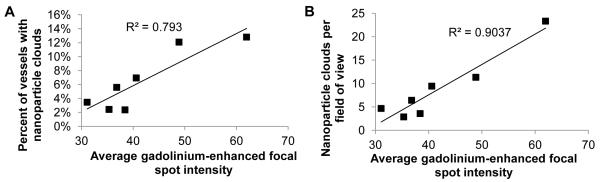
(A, B) Gadolinium delivery, measured by the average grayscale focal spot intensity calculated from coronal contrast-enhanced T1-weighted MR scans, was found to correlate with the average number of BPN clouds per field of view (A) and the percent of vessels that produced BPN clouds (B), measured from fluorescent imaging of sectioned brains. Each point on the plots represents an animal, 4 sonicated at 0.6 MPa and 3 sonicated at 0.4 MPa. Each animal was sonicated in four locations and metrics were averaged across sonications.
DISCUSSION
We report here the first use of MRgFUS and MBs with a biodegradable polymeric nanoparticle platform that can penetrate within the brain microenvironment. MRgFUS can be used to safely deliver 60 nm PS-PEG NPs and 75-nm PLGA-PEG across the BBB in vivo. Densely PEG-coated PS NPs (BPN) circulate and accumulate in the brain in regions where the BBB is disrupted by FUS and MBs. The 60-nm PS-PEG NPs can rapidly diffuse and penetrate within the brain parenchyma 10-fold slower than their effective diffusion in ACSF in both ex vivo and in vivo normal rodent brain. Larger 110-nm PEGylated PS NPs were 60-fold slower in brain tissue than in ACSF, while 240-nm PEGylated PS were 3000-fold slower, indicating size dependent diffusive capabilities within normal rodent brain for these bio-inert particles. Additionally, MRgFUS mediated delivery of the 60-nm PS-PEG showed that higher FUS pressure also shifts the distribution of the BPNs within the brain tissue, producing greater parenchymal coverage and further enhancing the penetration of the PS-PEG NPs. Delivery of an MRI contrast agent correlated with NP delivery, and T2* weighted MRI imaging indicated little to no blood pooling at 0.6MPa, demonstrating the safety of using FUS for BPN delivery in the normal brain. Finally, we were able to show that MRgFUS is also able to deliver 75-nm biodegradable PLGA-PEG NPs across the BBB, bringing this technology one step closer to the clinic. Ultimately, we conclude that MRI guided opening of the BBB using FUS and MBs is a promising strategy for enhancing the delivery of polymeric nanoparticles into the brain. This approach has the potential to become a platform technology for treating a broad spectrum of CNS disorders, offering the targeted delivery of a host of therapeutics, including drugs, genes, siRNAs, and miRNAs.
Strategies to promote nanoparticle transit across the BBB can be divided into two broad areas: surface modification to promote nanoparticle uptake by an intact BBB [31,32] and techniques to disrupt or circumvent the BBB [33], including FUS. Recently, several groups have explored the use of surfactants such as polysorbate 80 (P80), poloxamer 407 (F127), and poloxamer 188 (F68) to coat nanoparticle surfaces and promote crossings of the BBB [42, 43]. Kulkarni and Feng compared the effect of several surfactants on delivery of systemically administered poly(lactic-co-glycolic acid) (PLGA) nanoparticles across the BBB. They reported that while F68, F127, and P80 coatings enhanced crossing of the BBB, F68-coated particles accumulated in the highest concentrations in the brain compared to particles with F127, P80 and other surfactant coatings [43]. Kreuter et al have shown that P80 and F68 coated nanoparticles undergo endocytosis followed by transcytosis, leading to uptake in the BBB endothelial cells. P80-coated nanoparticles were shown to inhibit growth of gliomas in rats due to increased brain uptake compared to uncoated particles [44]. F68 coated particles have also been shown to improve efficacy against intracranial glioblastomas (GBMs) compared to uncoated particles [45, 46]. A recent publication using poly(vinyl alcohol) (PVA) coated paclitaxel loaded PLGA particles administered through CED showed enhanced survival in glioma bearing rats [47]. Although surfactants such as P80, F127, F68, and PVA have been widely used to increase nanoparticle uptake into the brain, the poorly characterized diffusive ability of particles with these surfactants, and demonstration these systems are prone to cell uptake limits their ability to reach distant diseased cells and emphasizes the need for a novel nanoparticle platform and delivery system design that is tailored to the brain.
MRgFUS has been applied with intravenous delivery of doxorubicin (Dox)-loaded liposomal nanoparticles to improve anti-tumor efficacy [32]. While significant improvement in tumor growth delay was obtained, the authors state the enhanced therapeutic effect may be due to release of Dox from disrupted liposomes near the focal site, as opposed to intact liposomes penetrating the brain parenchyma following MRgFUS-mediated delivery. Polymeric nanoparticles have several advantages, including greater stability in the bloodstream, increased drug solubility and drug encapsulated load, and more controlled sustained release of a therapeutic [48], and could therefore provide greater therapeutic efficacy when combined with MRgFUS and the ability to penetrate within the brain parenchyma. More recently, intravenously delivered antibody conjugated biocompatible gold nanoparticles have been shown to accumulate in the brain with MRgFUS, but only in the absence of liver macrophages [49]. In our study, we combine surface-modified nanoparticles that can penetrate in brain parenchyma with a FUS technique to disrupt the BBB, in an attempt to improve the delivery of therapeutically relevant nanoparticles to the CNS. We have previously shown PS-PEG NPs up to 114-nm can diffuse within normal human tissue [35], and in this study confirm similar PS-PEG NP diffusion within normal rat brain tissue. The 60-nm PS-PEG NPs were 4-fold more diffusive in normal rat brain tissue compared to normal human brain tissue, and were able to circulate at least 24 hours, demonstrating the ability of these particles to avoid adhesive interactions that could lead to clearance or poor distribution within blood circulation and within the brain parenchyma. These PS-PEG were also 6-fold more diffusive than 110-nm PS-PEG NPs, and were used to evaluate MRgFUS-mediated delivery to the brain. As we demonstrate, the results obtained with MRgFUS of PS-PEG NPs can be translated to PLGA-PEG NPs, representing a biodegradable, clinically relevant polymer nanoparticle platform.
We showed that MRgFUS can deliver BPNs to both the vessel endothelium and the brain parenchyma without any uptake in non-targeted regions. Higher FUS pressure (0.6 MPa vs 0.4 MPa) increased BPN coverage within the interstitium, as well as the fraction of NPs delivered beyond the vessel endothelium. The percentage of capillaries exhibiting BPN delivery in sonicated regions in our study appeared similar to the results from other studies in which fluorescent dextran delivery across the BBB via MB activation with FUS was observed using multiphoton or 2-photon microscopy techniques [50]. There are many variables that can be altered to enhance NP delivery. In our study, rat brains were removed one hour post-sonication, limiting the time available for BPN accumulation and spread. Longer time points would presumably increase both BPN delivery and coverage within the sonicated regions. Additionally, the characteristics of the MB population may be an important factor influencing heterogeneity in BBB disruption. Many studies, including our own work [51], have shown that MB size [52], concentration [53] and behavior [54] have an impact on vessel permeabilization. The cavitation threshold changes with MB size [55], so the use of a polydisperse MB population can cause variation in the vessel response to sonication, and therefore, NP delivery. More uniform BBB opening could be achieved through the use of size-sorted MBs [56]. Another potential factor contributing to disparate NP delivery is the inherent variation in vessel density in the brain [13]. Future studies could incorporate longer time points and different MB populations to increase the delivered NP dose to within the therapeutic window.
BPN size is also a possible variable that can be optimized for drug delivery to the brain. Due to the ability of 110 nm PS-PEG particles to penetrate and circulate (data not shown), larger particles with a higher payload might increase the drug dose delivered to the brain with FUS and MB. Extravasation across an impaired or disrupted BBB is size dependent, as demonstrated using Evans Blue, various molecular weight FITC-conjugated dextrans, and other small molecular markers [57, 58]. Although particles larger than 100-nm can diffuse in the extracellular matrix in normal brain tissue, the extracellular matrix spacing is significantly decreased in most diseased states [33]. Therefore, we used 60-nm PS-PEG combined with FUS to ensure passage across a disrupted BBB, and to aid in translation to a clinically relevant disease model and biodegradable platform. PLGA-PEG NPs, around 75-nm in size, were also able to accumulate in brain, suggesting that a therapeutically relevant platform can be delivered to the brain with this method. Various size BPNs will need to be tested with multiple FUS pressures and MB diameters to determine the highest percent of BPN uptake and penetration within the brain parenchyma, while minimizing tissue damage and additional side effects.
Depending on frequency, pressure, and MB diameter, endothelial barriers can be opened with or without microvessel damage (i.e. irreversible vs. reversible BBB opening), indicating that different modes of BBB opening are possible [19-22]. Other investigators have presented compelling evidence that reversible BBB opening is associated with a stable MB cavitation mode, while irreversible BBB opening appears to occur above the threshold for inertial cavitation [14, 52, 59]. Cavitation detection was not used here; however, we did use MR-based methods to assess protocol safety. Using T2* weighted MRI, blood pooling was detected in only 16% of the sonications performed at 0.6 MPa. Meanwhile, raising peak-negative pressure to 0.8 MPa resulted in a 92% probability of blood pooling. Together, these results indicate that the transition from stable to inertial cavitation in our system likely occurred somewhere between 0.6 and 0.8 MPa and identifies 0.6 MPa as a safety threshold. This agrees with prior work [15, 52] which indicated that 0.6 MPa-0.7 MPa is the maximum safe pressure for BBB disruption in both rodents and non-human primates. Interestingly, 0.6 MPa sonications that produced blood pooling were always located at the most anterior location of the brain we could access with our system. This observation points to variations in skull thickness and geometry, as well as potential differences in vascular density, as significant determinants of the mode of BBB opening. Cavitation detection devices may be incorporated into FUS systems to account for inhomogeneity of the skull and brain tissue. Ultimately, for some CNS applications, low levels of tissue damage may be acceptable if a therapeutic dose of particles can be delivered without an impact on neurological function. Finally, it is also important to note that, in our studies, MR thermometry showed no detectable change in temperature with this FUS pulsing protocol, so there is little to no concern that this protocol will induce thermal damage. We anticipate that the parameters tested here will translate well to disease models. Other work [28, 29] has demonstrated that MRgFUS is capable of overcoming the blood-tumor barrier, although we believe the strength of MRgFUS lies in its’ ability to deliver NPs to regions of the brain with intact BBB function and infiltrating tumor cells, which should respond to MRgFUS in a manner similar to healthy tissue.
Clinical trials for FUS-mediated thermal tissue ablation in the brain (essential tremors and brain metastases) are underway and may be used as a precedent for translating this work to the clinic. Broadly speaking, this study opens the door for delivery of drug-loaded biodegradable nanoparticles across the BBB for many CNS applications, including Parkinson’s, depression, brain tumors, epilepsy, and compulsive disorders. BPN delivery with FUS and MBs can further improve anti-tumor efficacy by (i) providing deeper brain tissue penetration of drug than is achieved with polymer implants (located only at the periphery in the surgical cavity), (ii) enabling multiple dosing regimens without the need for repeat surgery, (iii) facilitating local delivery for tumors with high surgical risk, and (iv) permitting patient-specific BPN design based on the unique tumor subtype and mutations. MR guidance adds the ability to identify and target specific regions [45], reducing off-target toxicity within the brain.
Supplementary Material
ACKNOWLEDGMENTS
The authors would like to thank NIH RO1 CA164789 for funding support.
Footnotes
Publisher's Disclaimer: This is a PDF file of an unedited manuscript that has been accepted for publication. As a service to our customers we are providing this early version of the manuscript. The manuscript will undergo copyediting, typesetting, and review of the resulting proof before it is published in its final citable form. Please note that during the production process errors may be discovered which could affect the content, and all legal disclaimers that apply to the journal pertain.
REFERENCES
- 1.Li JY, Boado RJ, Pardridge WM. Blood-brain barrier genomics. J Cereb Blood Flow Metab. 2001;21(1):61–8. doi: 10.1097/00004647-200101000-00008. [DOI] [PubMed] [Google Scholar]
- 2.Pardridge WM. Blood-brain barrier drug targeting: the future of brain drug development. Mol Interv. 2003;3(2):90–105. 51. doi: 10.1124/mi.3.2.90. [DOI] [PubMed] [Google Scholar]
- 3.Patel M, et al. Plasma and cerebrospinal fluid pharmacokinetics of intravenous temozolomide in non-human primates. J Neurooncol. 2003;61(3):203–7. doi: 10.1023/a:1022592913323. [DOI] [PubMed] [Google Scholar]
- 4.Rosso L, et al. A new model for prediction of drug distribution in tumor and normal tissues: pharmacokinetics of temozolomide in glioma patients. Cancer Res. 2009;69(1):120–7. doi: 10.1158/0008-5472.CAN-08-2356. [DOI] [PubMed] [Google Scholar]
- 5.Rudek MA, et al. Temozolomide in patients with advanced cancer: phase I and pharmacokinetic study. Pharmacotherapy. 2004;24(1):16–25. doi: 10.1592/phco.24.1.16.34800. [DOI] [PubMed] [Google Scholar]
- 6.Kleihues P, et al. The WHO classification of tumors of the nervous system. J Neuropathol Exp Neurol. 2002;61(3):215–25. doi: 10.1093/jnen/61.3.215. discussion 226-9. [DOI] [PubMed] [Google Scholar]
- 7.Schoknecht K, Shalev H. Blood-brain barrier dysfunction in brain diseases: clinical experience. Epilepsia. 2012;53(Suppl 6):7–13. doi: 10.1111/j.1528-1167.2012.03697.x. [DOI] [PubMed] [Google Scholar]
- 8.Wunder A, et al. Imaging blood-brain barrier dysfunction in animal disease models. Epilepsia. 2012;53(Suppl 6):14–21. doi: 10.1111/j.1528-1167.2012.03698.x. [DOI] [PubMed] [Google Scholar]
- 9.Claes A, Idema AJ, Wesseling P. Diffuse glioma growth: a guerilla war. Acta Neuropathol. 2007;114(5):443–58. doi: 10.1007/s00401-007-0293-7. [DOI] [PMC free article] [PubMed] [Google Scholar]
- 10.Urayama A. [The blood-brain barrier and neurodegenerative lysosomal storage diseases] Brain Nerve. 2013;65(2):153–63. [PubMed] [Google Scholar]
- 11.El-Hage W, et al. Mechanisms of antidepressant resistance. Front Pharmacol. 2013;4:146. doi: 10.3389/fphar.2013.00146. [DOI] [PMC free article] [PubMed] [Google Scholar]
- 12.Edvinsson L, Tfelt-Hansen P. The blood-brain barrier in migraine treatment. Cephalalgia. 2008;28(12):1245–58. doi: 10.1111/j.1468-2982.2008.01675.x. [DOI] [PubMed] [Google Scholar]
- 13.Hynynen K, et al. Noninvasive MR imaging-guided focal opening of the blood-brain barrier in rabbits. Radiology. 2001;220(3):640–6. doi: 10.1148/radiol.2202001804. [DOI] [PubMed] [Google Scholar]
- 14.Hynynen K, et al. Local and reversible blood-brain barrier disruption by noninvasive focused ultrasound at frequencies suitable for trans-skull sonications. Neuroimage. 2005;24(1):12–20. doi: 10.1016/j.neuroimage.2004.06.046. [DOI] [PubMed] [Google Scholar]
- 15.McDannold N, et al. Temporary disruption of the blood-brain barrier by use of ultrasound and microbubbles: safety and efficacy evaluation in rhesus macaques. Cancer Res. 2012;72(14):3652–63. doi: 10.1158/0008-5472.CAN-12-0128. [DOI] [PMC free article] [PubMed] [Google Scholar]
- 16.Abdelmoneim SS, et al. Safety of contrast agent use during stress echocardiography in patients with elevated right ventricular systolic pressure: a cohort study. Circ Cardiovasc Imaging. 2010;3(3):240–8. doi: 10.1161/CIRCIMAGING.109.895029. [DOI] [PubMed] [Google Scholar]
- 17.Kiessling F, et al. Ultrasound microbubbles for molecular diagnosis, therapy, and theranostics. J Nucl Med. 2012;53(3):345–8. doi: 10.2967/jnumed.111.099754. [DOI] [PubMed] [Google Scholar]
- 18.Kang ST, Yeh CK. Ultrasound microbubble contrast agents for diagnostic and therapeutic applications: current status and future design. Chang Gung Med J. 2012;35(2):125–39. doi: 10.4103/2319-4170.106159. [DOI] [PubMed] [Google Scholar]
- 19.Meijering BD, et al. Ultrasound and microbubble-targeted delivery of macromolecules is regulated by induction of endocytosis and pore formation. Circ Res. 2009;104(5):679–87. doi: 10.1161/CIRCRESAHA.108.183806. [DOI] [PubMed] [Google Scholar]
- 20.van Wamel A, et al. Ultrasound microbubble induced endothelial cell permeability. J Control Release. 2006;116(2):e100–2. doi: 10.1016/j.jconrel.2006.09.071. [DOI] [PubMed] [Google Scholar]
- 21.Wu J, Nyborg WL. Ultrasound, cavitation bubbles and their interaction with cells. Adv Drug Deliv Rev. 2008;60(10):1103–16. doi: 10.1016/j.addr.2008.03.009. [DOI] [PubMed] [Google Scholar]
- 22.Qin S, Ferrara KW. Acoustic response of compliable microvessels containing ultrasound contrast agents. Phys Med Biol. 2006;51(20):5065–88. doi: 10.1088/0031-9155/51/20/001. [DOI] [PMC free article] [PubMed] [Google Scholar]
- 23.Juffermans LJ, et al. Ultrasound and microbubble-induced intra- and intercellular bioeffects in primary endothelial cells. Ultrasound Med Biol. 2009;35(11):1917–27. doi: 10.1016/j.ultrasmedbio.2009.06.1091. [DOI] [PubMed] [Google Scholar]
- 24.Hosseinkhah N, Hynynen K. A three-dimensional model of an ultrasound contrast agent gas bubble and its mechanical effects on microvessels. Phys Med Biol. 2012;57(3):785–808. doi: 10.1088/0031-9155/57/3/785. [DOI] [PMC free article] [PubMed] [Google Scholar]
- 25.Sheikov N, et al. Effect of focused ultrasound applied with an ultrasound contrast agent on the tight junctional integrity of the brain microvascular endothelium. Ultrasound Med Biol. 2008;34(7):1093–104. doi: 10.1016/j.ultrasmedbio.2007.12.015. [DOI] [PMC free article] [PubMed] [Google Scholar]
- 26.Sheikov N, et al. Brain arterioles show more active vesicular transport of blood-borne tracer molecules than capillaries and venules after focused ultrasound-evoked opening of the blood-brain barrier. Ultrasound Med Biol. 2006;32(9):1399–409. doi: 10.1016/j.ultrasmedbio.2006.05.015. [DOI] [PubMed] [Google Scholar]
- 27.Shang X, et al. Mechanism of low-frequency ultrasound in opening blood-tumor barrier by tight junction. J Mol Neurosci. 2011;43(3):364–9. doi: 10.1007/s12031-010-9451-9. [DOI] [PubMed] [Google Scholar]
- 28.Yang FY, et al. Pulsed high-intensity focused ultrasound enhances the relative permeability of the blood-tumor barrier in a glioma-bearing rat model. IEEE Trans Ultrason Ferroelectr Freq Control. 2011;58(5):964–70. doi: 10.1109/TUFFC.2011.1897. [DOI] [PubMed] [Google Scholar]
- 29.Liu HL, et al. Blood-brain barrier disruption with focused ultrasound enhances delivery of chemotherapeutic drugs for glioblastoma treatment. Radiology. 2010;255(2):415–25. doi: 10.1148/radiol.10090699. [DOI] [PubMed] [Google Scholar]
- 30.Jordao JF, et al. Antibodies targeted to the brain with image-guided focused ultrasound reduces amyloid-beta plaque load in the TgCRND8 mouse model of Alzheimer’s disease. PLoS One. 2010;5(5):e10549. doi: 10.1371/journal.pone.0010549. [DOI] [PMC free article] [PubMed] [Google Scholar]
- 31.Kinoshita M, et al. Noninvasive localized delivery of Herceptin to the mouse brain by MRI-guided focused ultrasound-induced blood-brain barrier disruption. Proc Natl Acad Sci U S A. 2006;103(31):11719–23. doi: 10.1073/pnas.0604318103. [DOI] [PMC free article] [PubMed] [Google Scholar]
- 32.Treat LH, et al. Improved anti-tumor effect of liposomal doxorubicin after targeted blood-brain barrier disruption by MRI-guided focused ultrasound in rat glioma. Ultrasound Med Biol. 2012;38(10):1716–25. doi: 10.1016/j.ultrasmedbio.2012.04.015. [DOI] [PMC free article] [PubMed] [Google Scholar]
- 33.Sykova E, Nicholson C. Diffusion in brain extracellular space. Physiol Rev. 2008;88(4):1277–340. doi: 10.1152/physrev.00027.2007. [DOI] [PMC free article] [PubMed] [Google Scholar]
- 34.Thorne RG, Nicholson C. In vivo diffusion analysis with quantum dots and dextrans predicts the width of brain extracellular space. Proc Natl Acad Sci U S A. 2006;103(14):5567–72. doi: 10.1073/pnas.0509425103. [DOI] [PMC free article] [PubMed] [Google Scholar]
- 35.Nance EA, et al. A dense poly(ethylene glycol) coating improves penetration of large polymeric nanoparticles within brain tissue. Sci Transl Med. 2012;4(149):149ra119. doi: 10.1126/scitranslmed.3003594. [DOI] [PMC free article] [PubMed] [Google Scholar]
- 36.Yoo HS, et al. Biodegradable nanoparticles containing doxorubicin-PLGA conjugate for sustained release. Pharm Res. 1999;16(7):1114–8. doi: 10.1023/a:1018908421434. [DOI] [PubMed] [Google Scholar]
- 37.Lai SK, et al. Rapid transport of large polymeric nanoparticles in fresh undiluted human mucus. Proc Natl Acad Sci U S A. 2007;104(5):1482–7. doi: 10.1073/pnas.0608611104. [DOI] [PMC free article] [PubMed] [Google Scholar]
- 38.Amsden B. Solute diffusion within hydrogels. Mechanisms and models. Macromolecules. 1998;31(23):8382–8395. [Google Scholar]
- 39.Alexis F, et al. Factors affecting the clearance and biodistribution of polymeric nanoparticles. Mol Pharm. 2008;5(4):505–15. doi: 10.1021/mp800051m. [DOI] [PMC free article] [PubMed] [Google Scholar]
- 40.Avgoustakis K. Pegylated poly(lactide) and poly(lactide-co-glycolide) nanoparticles: preparation, properties and possible applications in drug delivery. Curr Drug Deliv. 2004;1(4):321–33. doi: 10.2174/1567201043334605. [DOI] [PubMed] [Google Scholar]
- 41.Otsuka H, Nagasaki Y, Kataoka K. PEGylated nanoparticles for biological and pharmaceutical applications. Adv Drug Deliv Rev. 2003;55(3):403–19. doi: 10.1016/s0169-409x(02)00226-0. [DOI] [PubMed] [Google Scholar]
- 42.Gulyaev AE, et al. Significant transport of doxorubicin into the brain with polysorbate 80-coated nanoparticles. Pharm Res. 1999;16(10):1564–9. doi: 10.1023/a:1018983904537. [DOI] [PubMed] [Google Scholar]
- 43.Kulkarni SA, Feng SS. Effects of surface modification on delivery efficiency of biodegradable nanoparticles across the blood-brain barrier. Nanomedicine (Lond) 2011;6(2):377–94. doi: 10.2217/nnm.10.131. [DOI] [PubMed] [Google Scholar]
- 44.Wang CX, et al. Antitumor effects of polysorbate-80 coated gemcitabine polybutylcyanoacrylate nanoparticles in vitro and its pharmacodynamics in vivo on C6 glioma cells of a brain tumor model. Brain Res. 2009;1261:91–9. doi: 10.1016/j.brainres.2009.01.011. [DOI] [PubMed] [Google Scholar]
- 45.Ambruosi A, et al. Influence of surfactants, polymer and doxorubicin loading on the anti-tumour effect of poly(butyl cyanoacrylate) nanoparticles in a rat glioma model. J Microencapsul. 2006;23(5):582–92. doi: 10.1080/02652040600788080. [DOI] [PubMed] [Google Scholar]
- 46.Petri B, et al. Chemotherapy of brain tumour using doxorubicin bound to surfactant-coated poly(butyl cyanoacrylate) nanoparticles: revisiting the role of surfactants. J Control Release. 2007;117(1):51–8. doi: 10.1016/j.jconrel.2006.10.015. [DOI] [PubMed] [Google Scholar]
- 47.Zhou J, et al. Highly penetrative, drug-loaded nanocarriers improve treatment of glioblastoma. Proc Natl Acad Sci U S A. 2013;110(29):11751–6. doi: 10.1073/pnas.1304504110. [DOI] [PMC free article] [PubMed] [Google Scholar]
- 48.Alexis F, et al. Nanoparticle technologies for cancer therapy. Handb Exp Pharmacol. 2010;197:55–86. doi: 10.1007/978-3-642-00477-3_2. [DOI] [PubMed] [Google Scholar]
- 49.Diaz RJ, et al. Focused ultrasound delivery of Raman nanoparticles across the blood-brain barrier: Potential for targeting experimental brain tumors. Nanomedicine. 2013 doi: 10.1016/j.nano.2013.12.006. [DOI] [PMC free article] [PubMed] [Google Scholar]
- 50.Nhan T, et al. Drug delivery to the brain by focused ultrasound induced blood-brain barrier disruption: quantitative evaluation of enhanced permeability of cerebral vasculature using two-photon microscopy. J Control Release. 2013;172(1):274–80. doi: 10.1016/j.jconrel.2013.08.029. [DOI] [PMC free article] [PubMed] [Google Scholar]
- 51.Burke CW, et al. Markedly enhanced skeletal muscle transfection achieved by the ultrasound-targeted delivery of non-viral gene nanocarriers with microbubbles. J Control Release. 2012;162(2):414–21. doi: 10.1016/j.jconrel.2012.07.005. [DOI] [PMC free article] [PubMed] [Google Scholar]
- 52.Konofagou EE. Optimization of the ultrasound-induced blood-brain barrier opening. Theranostics. 2012;2(12):1223–37. doi: 10.7150/thno.5576. [DOI] [PMC free article] [PubMed] [Google Scholar]
- 53.Guo X, et al. Investigation on the inertial cavitation threshold and shell properties of commercialized ultrasound contrast agent microbubbles. J Acoust Soc Am. 2013;134(2):1622–31. doi: 10.1121/1.4812887. [DOI] [PubMed] [Google Scholar]
- 54.Fan Z, Chen D, Deng CX. Improving ultrasound gene transfection efficiency by controlling ultrasound excitation of microbubbles. J Control Release. 2013;170(3):401–13. doi: 10.1016/j.jconrel.2013.05.039. [DOI] [PMC free article] [PubMed] [Google Scholar]
- 55.Gauthier M, King D, O’Brien W. Influence of microbubble size on postexcitation collapse thresholds for single ultrasound contrast agents using double passive cavitation detection. IEEE Trans Ultrason Ferroelectr Freq Control. 2013;60(5):877–9. doi: 10.1109/TUFFC.2013.2644. [DOI] [PMC free article] [PubMed] [Google Scholar]
- 56.Feshitan JA, et al. Microbubble size isolation by differential centrifugation. J Colloid Interface Sci. 2009;329(2):316–24. doi: 10.1016/j.jcis.2008.09.066. [DOI] [PubMed] [Google Scholar]
- 57.Choi JJ, et al. Molecules of various pharmacologically-relevant sizes can cross the ultrasound-induced blood-brain barrier opening in vivo. Ultrasound Med Biol. 2010;36(1):58–67. doi: 10.1016/j.ultrasmedbio.2009.08.006. [DOI] [PMC free article] [PubMed] [Google Scholar]
- 58.Hoffmann A, et al. High and Low Molecular Weight Fluorescein Isothiocyanate (FITC)-Dextrans to Assess Blood-Brain Barrier Disruption: Technical Considerations. Transl Stroke Res. 2011;2(1):106–11. doi: 10.1007/s12975-010-0049-x. [DOI] [PMC free article] [PubMed] [Google Scholar]
- 59.McDannold N, et al. MRI investigation of the threshold for thermally induced blood-brain barrier disruption and brain tissue damage in the rabbit brain. Magn Reson Med. 2004;51(5):913–23. doi: 10.1002/mrm.20060. [DOI] [PubMed] [Google Scholar]
Associated Data
This section collects any data citations, data availability statements, or supplementary materials included in this article.