

Abstract
Quality control is increasingly recognized as a crucial aspect of mass spectrometry based proteomics. Several recent papers discuss relevant parameters for quality control and present applications to extract these from the instrumental raw data. What has been missing, however, is a standard data exchange format for reporting these performance metrics. We therefore developed the qcML format, an XML-based standard that follows the design principles of the related mzML, mzIdentML, mzQuantML, and TraML standards from the HUPO-PSI (Proteomics Standards Initiative). In addition to the XML format, we also provide tools for the calculation of a wide range of quality metrics as well as a database format and interconversion tools, so that existing LIMS systems can easily add relational storage of the quality control data to their existing schema. We here describe the qcML specification, along with possible use cases and an illustrative example of the subsequent analysis possibilities. All information about qcML is available at http://code.google.com/p/qcml.
With the increasing importance and growth of mass spectrometry based proteomics as an analytical tool in the life sciences, the interest in the extraction and dissemination of robust quality control metrics has also increased (1) (2). Indeed, efforts to standardize storage and dissemination of mass spectrometric datasets (3), and to share protocols estimating variations of the quality of different proteomics experiments (4) (5) (6) have been supported by the development of data processing tools to automate quality control, both within a single experiment (7) (8) (9) (10) (11) (12), as well as across multiple experiments (10) (13). An excellent and detailed overview of the wide-ranging efforts in proteomics quality control is provided by Tabb, 2013 (14).
The complex interaction between sample origin, the lysis, protein extraction and processing protocols used, the acquisition settings of the instrument, the processing strategy of the spectra, and any variation in these varied procedures can contribute to large variation in the quality of generated datasets. As a result, a multitude of reporting metrics, aspiring to capture all the important parameters ranging from sample acquisition, sample introduction, mass analysis, and data analysis (14) have already been proposed (8) (13) (15). However, it is foreseeable that many more parameters will be added to this core set (11), and that novel methods will require specific new metrics as well.
Quality control metrics provide important information for the researcher or lab that acquires the data, and thus serves an important local role toward the optimization of proteomic experiments. In addition, these metrics also constitute a highly valuable piece of experimental metadata that is crucial for researchers to correctly interpret published results and to assess their utility for further analysis (2) (14). Despite the abovementioned sets of metrics and corresponding software availability, two issues still prevent quality control data to take its central role in the annotation of proteomics results. Firstly, storing and communicating this new type of information is currently not standardized, limiting the dissemination of quality control data along with experimental data. Secondly, it needs to be taken into account that the data can be generated by software tools of different origins, with content and definitions of the performance metrics varying for each tool.
To unify both storage and communication of this quality control information, as well as integration in existing workflows, we propose the qcML format. The qcML format comprises an XML-based data standard and associated controlled vocabularies (CV)1 for storing various types of performance metrics, along with applicable metadata about the experiments. The qcML format is designed to address the above two issues regarding compatibility and variability. The design of qcML follows principles that have been proven successful in tackling similar issues in the closely related Human Proteome Organisation's Proteomics Standards Initiative (HUPO-PSI) data standards mzML (16), mzIdentML (17), TraML (18), and mzQuantML (19). Like qcML, these standards are all based upon the eXtensible Markup Language (XML), allowing for complex hierarchical data structures to be stored while maintaining human readability. All these formats allow the extensible inclusion of extensive metadata by using terms from centrally managed, structured controlled vocabularies (CVs), which can describe both experimental as well as programmatic environmental variables (20).
To test the format, two implementations have already been developed, allowing the qcML format to be exported using OpenMS (21), available at http://www.openms.de and SIMPATIQCO (13) (http://ms.imp.ac.at/?goto=simpatiqco). OpenMS starts from open mass spectrometry data files like mzML, mzXML, mzIdentML, and TraML and extracts instrument-agnostic parameters. SimpatiQCo on the other hand only supports Thermo Scientific instruments, and checks for instrument-specific parameters. It is worth noting that qcML is sufficiently flexible to capture both these types of information. Additionally, we show how aggregating this data over several hundreds to thousands of experiments can prove useful for overall quality analyses.
Finally, it is worth noting that we intend to submit qcML to the HUPO-PSI document process for approval, and to make it part of an appropriate HUPO-PSI working group.
MATERIALS AND METHODS
The format to store quality control data is designed to be flexible, concise, and simple while maintaining the necessary versatility to meet the demands of different experimental data and analysis results obtained in different settings. A key point regarding the aggregation of quality control metrics across experiments is the ability to easily merge files, extract specific values, and define thresholds.
The qcML format thus serves a well-defined purpose: to unify handling of quality control data by analysis or reporting tools, while maintaining a high level of transparency of the data to the user. By using a defined file structure, which can be validated using XML schema, information can be represented in a uniform way. On the other hand, the qcML schema also allows for sufficient leeway in terms of annotation order to remain suitably expressive and extensible. Importantly, semantic validation methods for the annotation of metadata have also been developed and implemented in the context of the abovementioned HUPO-PSI standards (22). A further advantage of an XML-based format is the widely available array of libraries to extract and store data in this format in many popular programming languages. Additionally, although it is not its primary function, the qcML format can also easily serve as quality control report.
A qcML document can contain both data structures containing quality metrics derived and aggregated from mass spectrometry experiments, as well as attachments further specifying these quality metrics, such as accompanying tables or other relevant binary attachments such as images. It is important to note that this incorporation of attached information in the format proper follows the relevant experience from the HUPO-PSI XML-based standards, where the use of external, referenced documents for this purpose was tested but ultimately kept to an absolute minimum because of consistency and collation issues when multiple files need to travel together reliably across different file systems and transfer protocols.
RESULTS
qcML was designed as a data interchange format for quality control data and thus enables the integration of wide range of software libraries and tools. In parallel with the development of the format, we have been developing these tools to ease the integration of qcML into existing workflows. Fig. 1 gives an overview of the workflows and tools. We will discuss both the format, its contents, and the related tools and libraries in more detail below.
Fig. 1.

An overview of the role of qcML. Experimental data are fed into performance analysis tools, that calculate the values of quality metrics. Those tools output qcML files, which in their turn can be converted to a database format for storage, or managed further with quality control tools. The data in qcML can also be converted to an easily viewable quality report.
Format Description
Fig. 2 shows the backbone of the XML schema used to represent the information stored in qcML. Furthermore, see the Supplementary Information for a graphical representation of the detailed structure of the XML schema, as discussed in this section. The qcML format is built around a basic element containing the information about one metric or metadatum, namely the qualityParameter element. This element represents a parameter and includes a name and a reference to a controlled vocabulary in order to describe the content of the parameter. Furthermore, it contains the value of the parameter, along with the unit in which this value is expressed, again with a reference to a controlled vocabulary in which the unit is described. Optionally, a threshold and flag can be supplied to indicate whether the metric has exceeded a specified threshold.
Fig. 2.

The backbone of the XML schema. This schema specifies the encapsulation of data in a qcML file. The full XML schema and ER schema of qcDB are available in the Supplementary Information.
Multiple qualityParameters can be stored in a quality Assessment element. Additionally, besides qualityParameters, a qualityAssessment element can also contain attachments, which refer to the specific qualityParameter for which they provide additional data in either tabular or binary form. A qualityAssessment can contain either single-experiment metrics, or multi-experiment, aggregated metrics. In the former case, the qualityAssessment will be located under a runQuality element in the qcML file. In the latter case, the aggregated metrics, along with the common metadata for all the experiments in a set, are encapsulated in a qualityAssessment that is located in a parent setQuality element.
Relational Database Structure
An equivalent relational structure called qcDB has been developed as a complement to the XML-based file format. This database schema allows qcML data to be stored in a relational database such as MySQL/MariaDB, PostGreSQL, or Oracle. The qcDB schema is designed to handle the contents of multiple qcML files, e.g. for archival purposes or longitudinal analysis. The file format thus serves as the universally readable exchange format, whereas the equivalent database form is intended to serve as a convenient addition to the existing relational back-end of proteomics LIMS software (23), allowing large volumes of data (think hundreds of thousands of runs) to be stored in an efficiently queryable system. The ER (Entity Relationship) schema detailing the qcDB format is available in the Supplementary Information, and can be fully mapped to the qcML schema. Furthermore, as a proof of concept, a Python script has been developed that interconverts between any qcML file and a qcDB SQLite database file. This Python script is made available in the Supplementary Information.
Quality Metrics and Controlled Vocabulary
Although the structure of a qcML document is derived from the XML schema definition, the flexibility and extensibility of the format is derived from the use of controlled vocabularies. This is handled by assigning to each quality control metric a controlled vocabulary term. The qcML format is therefore accompanied by a dedicated controlled vocabulary that collects relevant terms and their organizational structure. This controlled vocabulary for quality control (qcCV) is available online via EBI's ontology lookup service (20) at http://www.ebi.ac.uk/ontology-lookup/browse.do?ontName=qcML. An overview of the current CV can also be found in the Supplementary Information. The controlled vocabulary defines the metrics and metadata by name, identifier and description, along with a set of relationships between the current term and other terms from the same or other included vocabularies, and is defined in the Open Biological and Biomedical Ontologies (OBO) (24) knowledge representation language. The definitions in this vocabulary follow a set of rules, as specified in the recommendation of the HUPO-PSI committee (25). Currently, the controlled vocabulary already contains the specification of several performance metrics, specifically those that can be generated by the OpenMS suite (21). Other controlled vocabularies that are applicable to define terms in the qcML format are the HUPO PSI MS vocabulary (26) to describe various different mass spectrometry-related terms, and the Units ontology (27) to specify the units in which parameters are expressed. Additionally, the qcML format also allows the possibility to include custom controlled vocabularies. These can be included in a cv element, after which they can be referred to from the parameters. Each controlled vocabulary has a unique identifier, a name, a uniform resource identifier, and (optionally) a version number. The qcCV contains over 50 terms at the moment of writing and is fast growing as the number of applied use cases increases. The extension of the format to a certain new use case is accomplished quickly by adding an appropriate CV term (or multiple terms) to the vocabulary. With the new CV term(s) it is subsequently possible to describe new data as well as new experimental designs and coherences. An exemplary term and corresponding runQuality element can be found in Table I. It describes the number of assigned peptide to spectrum matches for a certain run.
Table I. Example of a controlled vocabulary (cv) term and its implementation as a quality parameter in qcML XML. Each cv term has an id, a name and a definition. Additionally it may have relational references to other cv terms if it is hierarchically embedded, e.g. “total number of PSM” has the relation ‘a part of’ to the term “MS identification result details.” (a) An example term in the controlled vocabulary describing the number of assigned peptide to spectrum matches for a certain run. It is defined as both a “spectrum identification detail” and a “MS identification detail” through “is a” relationships. (b) An example use of the cv term from (a) in a quality parameter in a qcML file. Each quality parameter can be assigned a cv term that defines and puts into context its associated data. These associated data can for instance consist of a value attribute, but it can also take the form of an attachment containing a plot or tabular data.
| [Term] | |
|---|---|
| a) | id: QC:0000029 |
| name: total number of PSM | |
| def: “This number indicates the number of spectra that were given peptide annotations.” [PXS:QC] | |
| is_a: MS:1001405 ! spectrum identification result details | |
| is_a: QC:0000025 ! MS identification result details | |
| b) | <qualityParameter name = “total number of PSM” ID = “20100219_SvNa_SA_Ecoli_PP_psms” cvRef = “QC” accession = “QC:0000029” value = “12370”/> |
Software Implementations
A number of software tools are currently available that already support qcML.
The open-source framework OpenMS (21) implements support for handling qcML files in C++. Based on OpenMS, TOPP (28) UTILS contains several tools that can be used to create either a single qcML file for a specific mass spectrometry run, or in more complex workflows to generate a qcML file describing a complete mass spectrometry experiment basing on the incorporated runs and their respective qcML files.
The OpenMS package is available at http://openms.de/downloads. An easy to follow “getting started” guide can be found in the supplementary information. All these tools are also available from within the workflow management and data analytics system KNIME (29) through the OpenMS community nodes (30). Fig. 3 depicts an example of such a QC workflow as implemented in KNIME. The KNIME file for this workflow can be found in the Supplementary Material, along with the resulting qcML file, a pdf report and a second, more detailed QC workflow example and description. Furthermore included in the Supplementary Information is a getting started guide for qcML with OpenMS and KNIME.
Fig. 3.
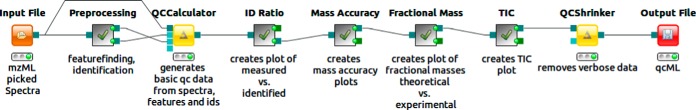
Simple QC workflow as implemented in KNIME. An input mzML file is first preprocessed (feature finding/identification with standard parameters), allowing the QCCalculator to subsequently create a basic qcML file. On top of this, the ID ratio (recorded versus identified MS2 on M/Z over RT), the mass accuracy (ppm error histogram), the fractional mass (experimentally recorded versus theoretically expected on fractional mass over nominal mass), and the TIC are all plotted. Finally, verbose or redundant attachments, as source data for generated plots, are removed for a slim report file. More examples can be found in the supplementary information.
OpenMS also contains several small and useful tools for creating and working with qcML, and these are briefly described next. The QCCalculator utility calculates basic quality parameters from mass spectrometry runs and subsequent analysis data such as identification or feature detection (see Table II for an overview). It also embeds an XSLT stylesheet into the file for direct rendering in a web browser, effectively allowing the qcML to act as a quality control report. See the Supplementary Information for the stylesheet and a screenshot of a standard web browser displaying an example qcML file. The QCEmbedder tool is used to embed tables or pictures generated externally as attachments to existing quality parameters in a run or set. If no quality parameter is present, an empty parameter element will be generated with the name of “default set name”/“default mzML file.” Additional data from external tools in tabular format can be added using the QCImporter tool. It will import the quality parameters contained in a given tabular file (csv) according to the mapping of table headings to the corresponding quality control parameters (CV terms). Conversely, QCExporter will extract several quality parameters from several runs or sets and write these out to a tabular format (csv). The values of the quality parameters in a qcML file will be written as tabular values with headings given by the names of the quality parameters (CV terms) or a given mapping to chosen names. The QCExtractor tool is similar in function, but is intended to generate a tabular file (csv) from a table attachment to a given quality parameter. QCMerger combines two qcML files; if a run or set exists in several files, the quality parameters of these identical runs or sets are merged as well.
Table II. List of the basic quality parameters that the QCCalculator program uses to create a basic qcML. Parameters that are included for completeness but not actually metrics (like filename) are written in italics. For an overview on the exsisting qcML metrics see supplementary material.
| Quality parameter/metric | Description | CV accession |
|---|---|---|
| MzML file | Name of the MS run file | MS:1000577 |
| Instrument model | Vendor and model name | MS:1000031 |
| Completion time | Date and time of MS run | MS:1000747 |
| MS1 spectra count | Number of MS1 spectra | QC:0000006 |
| MS2 spectra count | Number of MS2 spectra | QC:0000007 |
| Chromatogram count | Number of chromatograms | QC:0000008 |
| Total number of missed cleavages | Number of missed cleavages | QC:0000037 |
| Total number of identified proteins | Number of identified proteins | QC:0000032 |
| Total number of uniquely identified proteins | Number of unique proteins | QC:0000033 |
| Total number of PSMs | Number of PSMs | QC:0000029 |
| Total number of identified peptides | Number of identified proteins | QC:0000030 |
| Total number of uniquely identified peptides | Number of identified peptides | QC:0000031 |
| Mean delta ppm | Mean of ppm error | QC:0000040 |
| Median delta ppm | Median of ppm error | QC:0000041 |
| Id ratio | Ratio of recorded vs. identified MS2 plotted on M/Z over RT | QC:0000035 |
| Number of features | Number of detected features | QC:0000046 |
| MZ aquisition ranges | Value range limitations used for aquisition | QC:0000009 |
| RT aquisition ranges | Value range limitations used for aquisition | QC:0000012 |
| Id settings | The settings of the search engine used engine name and further parameters. | QC:0000026 |
QCShrinker is used to remove verbose or unused attachments or quality parameter from a qcML file that are not needed anymore. E.g. the table of all identifications' ppm errors is removed, when it is sufficient to report the ppm error distribution plot and the median ppm error. Which elements are removed can be controlled via the QCShrinkers parameters to obtain a lightweight, yet sufficiently detailed final report.
Up-to-date links to these software packages can be found on the qcML project page (http://code.google.com/p/qcml). Parsers for qcML are currently already available for several major programming languages (C++, as part of OpenMS; Java, via jqcML; and Python, as part of qcDB). These parsers make it straightforward to rapidly implement tools on top of qcML, both for the calculation of custom quality metrics as well as for the mining or analysis of qcML data sets.
Application of qcML to High-throughput Data Sets
Using the automated implementation of qcML generation in OpenMS, we calculated quality control metrics for several thousand MS runs stored in ms_lims (31). A read-out of metrics “median m/z” and “ratio of 2+ charged features” covering experiments acquired on a single Thermo Scientific LTQ Orbitrap Velos instrument over a time period of three consecutive months is given in Fig. 4. To show the ranges for the calculated metrics over this period, we include all analyses that were run during this period, comprising a heterogeneous collection of proteomic samples ranging from full human, yeast, and E. coli lysates over enolase standard samples, to 2DE purified samples. All these mixtures were analyzed in shotgun mode with different LC-MS protocols, including COFRADIC (32), with custom-made LC columns made to the same specifications. In the OpenMS-KNIME workflow used to generate qcML, all the spectra were searched with X!Tandem (33) against the complete SwissProt (34) database (note that the figures shown here only include MS1 features, so no peptide identification information is used). Given that color coding is used to distinguish different experimental protocols, it is clear that tolerance boundaries are best specified separately for different types of experiments for these metrics. As a result, it is straightforward to conclude that the application of global quality control thresholds will be mostly counterproductive. Indeed, different instruments, different samples, and different protocols will yield differences in a variety of metrics. As such, the importance of recording and archiving quality control information over time becomes all the more important, because this allows the derivation of tolerances and constraints on applicable parameters, in turn allowing the automatic flagging of experiments, a concept that has already been implemented in the SIMPATIQCO software (13). See Fig. 5 for example measures of flagging, wherein a simple standard mixture that was run between sets of normal samples has been analyzed. These data span one month of measurements performed on the same Orbitrap Velos instrument. Spectra have been processed with the same OpenMS-KNIME workflow discussed above, with searches performed with X!Tandem against the complete SwissProt database and the false discovery rate set at 1%. The 95% confidence interval and upper inner fence are both indicated as possible measures, the first proving less stringent for flagging outliers.
Fig. 4.

The median m/z value, and ratio of +2 charged features versus all detected features on the MS1 level for a set of 666 experiments performed on a large variety of samples over time (see main text for a summary) using the same Thermo Scientific LTQ Orbitrap Velos instrument. The data points are colored by the type of experimental protocol.
Fig. 5.

Outliers could be identified for the median ppm error metric in a subset of the experimental data set from Fig. 4. The subset contains 57 tryptic digests of enolase, all analyzed using the same experimental conditions with the exception of LC column replacements. The spectra were identified using X!Tandem (33) searches against the whole SwissProt database and were filtered at a 1% false discovery rate.
DISCUSSION
The expressive file format and database structure defined by the qcML specification allows a wide range of possibilities in dealing with quality control data in a standardized way. The qcML format homogenizes various output formats into a single transparent standard, devised according to the successful HUPO-PSI standards and associated guidelines, it allows for easy retrieval of the data, and it defines those data unambiguously using controlled vocabularies. Importantly, the OpenMS suite provides a full-fledged, open source, freely available, and automatable pipeline for qcML generation and consumption, with mzML files as the primary input. The use of this HUPO-PSI standard format for mass spectrometry makes a wide range of different vendor data directly accessible for QC processing as free and user-friendly conversion tools are available for all major vendor proprietary formats.
OpenMS also includes several small tools that provide detailed and specific functionality. This enables the researcher to focus on the analysis of the data instead of having to waste time on secondary tasks, such as file processing. Furthermore, the qcDB relational schema is made available for developers aiming at incorporating qcML reports into an existing LIMS database. Furthermore, qcML and qcDB benefit from a large variety of readily available free and commercial software that can read XML or connect to a relational database, and that can thus allow the data captured in these formats to be queried in detail.
All these factors contribute to a straightforward process to adopt the new standard, because easy adoption has been a key consideration from the start. Indeed, qcML has been developed in the context of the EU FP7 infrastructure project PRIME-XS to allow core facilities or service providers to provide quality control reports together with their analysis results. On a larger scale, wide-spread adoption of such a standard will present the community with opportunities to seamlessly extract, inspect and interact with quality control metrics from various instruments, protocols and software applications. Additionally, an important step will then be taken toward the dissemination of quality control data alongside published data sets, an important step on the way to establishing proteomics as a fully mature analytical approach in the broader life sciences.
Supplementary Material
Acknowledgments
We thank Simon Jupp for integrating qc-cv in EBI's Ontology Lookup Service.
Footnotes
Author contributions: M.W., L.E.P., S. Nasso, S. Nahnsen, P.K., J. Vizcaino, O.K., and L.M. designed research; M.W., L.E.P., S. Nahnsen, P.K., P.P., H.W.v., A.S., J. Vandenbussche, T.T., C.D.K., L.G., B.v., K.L., J. Vizcaino, and L.M. performed research; M.W., L.E.P., S. Nasso, W.B., S. Nahnsen, P.K., P.P., A.S., J. Vandenbussche, M.M., T.T., R.A.S., L.G., S.A., D.V., J. Vizcaino, and L.M. analyzed data; M.W., L.E.P., S. Nasso, W.B., P.K., P.P., H.W.v., K.L., K.S.L., J.V.O., A.J.H., K.M., R.A., K.G., J. Vizcaino, H.H., O.K., and L.M. wrote the paper.
* This work was supported by EU FP7 grant PRIME-XS project, [grant number 262067]. J.A.V. is supported by the Wellcome Trust [grant number WT085949MA], and L.M. and J.A.V. acknowledge the EU FP7 grant ProteomeXchange [grant number 260558]. W.B. P.K., K.L., D.V., and L.M. acknowledge support by SBO grant ‘InSPECtor’ (120025) of the Flemish agency for Innovation by Science and Technology (IWT). S.A. acknowledges funding by the EU FP7 project MARINA [grant number 263215].
 This article contains supplemental material.
Mathias Walzer walzer@informatik.uni-tuebingen.de, Lucia Espona Pernas espona@imsb.biol.ethz.ch, Sara Nasso sara.nasso@imls.uzh.ch, Wout Bittremieux Wout.Bittremieux@ua.ac.be, Sven Nahnsen sven.nahnsen@uni-tuebingen.de, Pieter Kelchtermans pieter.kelchtermans@UGent.be, Peter Pichler peter.pichler@imp.ac.at, Henk W. P. van den Toorn h.w.p.vandentoorn@uu.nl, An Staes an.staes@UGent.be, Jonathan Vandenbussche jonathan.vandenbussche@vib-ugent.be, Michael Mazanek michael.mazanek@imba.oeaw.ac.at, Thomas Taus thomas.taus@imp.ac.at, Richard A. Scheltema scheltem@biochem.mpg.de, Christian D. Kelstrup christian.kelstrup@cpr.ku.dk, Laurent Gatto lg390@cam.ac.uk, Bas van Breukelen b.vanbreukelen@uu.nl, Stephan Aiche Stephan.Aiche@fu-berlin.de, Dirk Valkenborg dirk.valkenborg@vito.be, Kris Laukens kris.laukens@ua.ac.be, Kathryn S. Lilley ksl23@cam.ac.uk, Jesper V. Olsen JesperVelgaard.Olsen@cpr.ku.dk, Albert J. R. Heck A.J.R.Heck@uu.nl, Karl Mechtler Karl.Mechtler@imp.ac.at, Ruedi Aebersold rudolf.aebersold@imsb.biol.ethz.ch, Kris Gevaert kris.gevaert@UGent.be, Juan Antonio Vizcaíno juan@ebi.ac.uk, Henning Hermjakob hhe@ebi.ac.uk, Oliver Kohlbacher oliver.kohlbacher@uni-tuebingen.de, Lennart Martens lennart.martens@vib-ugent.be
1 The abbreviations used are:
- LIMS
- Lab Information Management System
- HUPO
- Human Protein Organization
- PSI
- Protein Standards Initiative
- CV
- Controlled Vocabulary
- XML
- Extensible Markup Language
- QC
- quality control
- ER
- Entity Relation
- OBO
- Open Biomedical Ontologies
- XSLT
- Extensible Stylesheet Language Transformations.
REFERENCES
- 1. Martens L., Vizcaíno J. A., Banks R. (2011) Quality control in proteomics. Proteomics 11, 1015–1016 [DOI] [PubMed] [Google Scholar]
- 2. Martens L. (2013) Bringing proteomics into the clinic: the need for the field to finally take itself seriously. Proteomics 7, 388–391 [DOI] [PubMed] [Google Scholar]
- 3. Orchard S., Binz P.-A., Borchers C., Gilson M. K., Jones A. R., Nicola G., Vizcaino J. A., Deutsch E. W., Hermjakob H. (2012) Ten years of standardizing proteomic data: a report on the HUPO-PSI Spring Workshop: April 12–14th, 2012, San Diego, U.S.A. Proteomics 12, 2767–2772 [DOI] [PMC free article] [PubMed] [Google Scholar]
- 4. Bell A. W., Deutsch E. W., Au C. E., Kearney R. E., Beavis R., Sechi S., Nilsson T., Bergeron J. J. M., and HUPO Test Sample Working Group. (2009) A HUPO test sample study reveals common problems in mass spectrometry-based proteomics. Nat. Methods 6, 423–430 [DOI] [PMC free article] [PubMed] [Google Scholar]
- 5. Foster J. M., Degroeve S., Gatto L., Visser M., Wang R., Griss J., Apweiler R., Martens L. (2011) A posteriori quality control for the curation and reuse of public proteomics data. Proteomics 11, 2182–2194 [DOI] [PubMed] [Google Scholar]
- 6. Ivanov A. R., Colangelo C. M., Dufresne C. P., Friedman D. B., Lilley K. S., Mechtler K., Phinney B. S., Rose K. L., Rudnick P. A., Searle B. C., Shaffer S. A., Weintraub S. T. (2013) Interlaboratory studies and initiatives developing standards for proteomics. Proteomics 13, 904-909 [DOI] [PMC free article] [PubMed] [Google Scholar]
- 7. Flikka K., Martens L., Vandekerckhove J., Gevaert K., Eidhammer I. (2006) Improving the reliability and throughput of mass spectrometry-based proteomics by spectrum quality filtering. Proteomics 6, 2086-2094 [DOI] [PubMed] [Google Scholar]
- 8. Rudnick P. A., Clauser K. R., Kilpatrick L. E., Tchekhovskoi D. V., Neta P., Blonder N., Billheimer D. D., Blackman R. K., Bunk D. M., Cardasis H. L., Ham A.-J. L., Jaffe J. D., Kinsinger C. R., Mesri M., Neubert T. A., Schilling B., Tabb D. L., Tegeler T. J., Vega-Montoto L., Variyath A. M., Wang M., Wang P., Whiteaker J. R., Zimmerman L. J., Carr S. A., Fisher S. J., Gibson B. W., Paulovich A. G., Regnier F. E., Rodriguez H., Spiegelman C., Tempst P., Liebler D. C., Stein S. E. (2010) Performance metrics for liquid chromatography-tandem mass spectrometry systems in proteomics analyses. Mol. Cell. Proteomics 9, 225–241 [DOI] [PMC free article] [PubMed] [Google Scholar]
- 9. Ma Z.-Q., Polzin K. O., Dasari S., Chambers M. C., Schilling B., Gibson B. W., Tran B. Q., Vega-Montoto L., Liebler D. C., Tabb D. L. (2012) QuaMeter: multivendor performance metrics for LC-MS/MS proteomics instrumentation. Anal. Chem. 84, 5845–5850 [DOI] [PMC free article] [PubMed] [Google Scholar]
- 10. Taylor R. M., Dance J., Taylor R. J., Prince J. T. (2013) Metriculator: quality assessment for mass spectrometry-based proteomics. Bioinformatics, 29, 2948–2949 [DOI] [PubMed] [Google Scholar]
- 11. Teleman J., Waldemarson S., Malmström J., Levander F. (2013) Automated quality control system for LC-SRM setups. J. Proteomics, 10.1016/j.jprot.2013.03.029 [DOI] [PubMed] [Google Scholar]
- 12. Sandin M., Teleman J., Malmström J., Levander F. (2013) Data processing methods and quality control strategies for label-free LC-MS protein quantification. Biochim. Biophys. Acta, 10.1016/j.bbapap.2013.03.026 [DOI] [PubMed] [Google Scholar]
- 13. Pichler P., Mazanek M., Dusberger F., Weilnböck L., Huber C. G., Stingl C., Luider T. M., Straube W. L., Köcher T., Mechtler K. (2012) SIMPATIQCO: a server-based software suite which facilitates monitoring the time course of LC-MS performance metrics on orbitrap instruments. J. Proteome Res. 11, 5540–5547 [DOI] [PMC free article] [PubMed] [Google Scholar]
- 14. Tabb D. L. (2013) Quality assessment for clinical proteomics. Clin. Biochem. 46, 411–420 [DOI] [PMC free article] [PubMed] [Google Scholar]
- 15. Sutton J., Richmond T., Shi X., Athanas M., Ptak C., Gerszten R., Bonilla L. (2008) Performance characteristics of an FT MS-based workflow for label-free differential MS analysis of human plasma: standards, reproducibility, targeted feature investigation, and application to a model of controlled myocardial infarction. Proteomics - Clin. Appl. 2, 862–881 [DOI] [PubMed] [Google Scholar]
- 16. Martens L., Chambers M., Sturm M., Kessner D., Levander F., Shofstahl J., Tang W. H., Römpp A., Neumann S., Pizarro A. D., Montecchi-Palazzi L., Tasman N., Coleman M., Reisinger F., Souda P., Hermjakob H., Binz P.-A., Deutsch E. W. (2011) mzML–a community standard for mass spectrometry data. Mol. Cell. Proteomics 10, R110.000133. [DOI] [PMC free article] [PubMed] [Google Scholar]
- 17. Jones A. R., Eisenacher M., Mayer G., Kohlbacher O., Siepen J., Hubbard S. J., Selley J. N., Searle B. C., Shofstahl J., Seymour S. L., Julian R., Binz P.-A., Deutsch E. W., Hermjakob H., Reisinger F., Griss J., Vizcaino J. A., Chambers M., Pizarro A., Creasy D. (2012) The mzIdentML data standard for mass spectrometry-based proteomics results. Mol. Cell. Proteomics 11, 10.1074/mcp.M111.014381 [DOI] [PMC free article] [PubMed] [Google Scholar]
- 18. Deutsch E. W., Chambers M., Neumann S., Levander F., Binz P.-A., Shofstahl J., Campbell D. S., Mendoza L., Ovelleiro D., Helsens K., Martens L., Aebersold R., Moritz R. L., Brusniak M.-Y. (2012) TraML- a standard format for exchange of selected reaction monitoring transition lists. Mol. Cell. Proteomics 11, 10.1074/mcp.R111.015040 [DOI] [PMC free article] [PubMed] [Google Scholar]
- 19. Walzer M., Qi D., Mayer G., Uszkoreit J., Eisenacher M., Sachsenberg T., Gonzalez-Galarza F. F., Fan J., Bessant C., Deutsch E. W., Reisinger F., Vizcaino J. A., Medina-Aunon J. A., Albar J. P., Kohlbacher O., Jones A. R. (2013) The mzQuantML data standard for mass spectrometry-based quantitative studies in proteomics. Mol. Cell. Proteomics, mcp.O113.028506 [DOI] [PMC free article] [PubMed] [Google Scholar]
- 20. Côté R., Reisinger F., Martens L., Barsnes H., Vizcaino J. A., Hermjakob H. (2010) The ontology lookup service: bigger and better. Nucleic Acids Res. 38, W155–W160 [DOI] [PMC free article] [PubMed] [Google Scholar]
- 21. Sturm M., Bertsch A., Gröpl C., Hildebrandt A., Hussong R., Lange E., Pfeifer N., Schulz-Trieglaff O., Zerck A., Reinert K., Kohlbacher O. (2008) OpenMS - an open-source software framework for mass spectrometry. BMC Bioinformatics 9, 163. [DOI] [PMC free article] [PubMed] [Google Scholar]
- 22. Montecchi-Palazzi L., Kerrien S., Reisinger F., Aranda B., Jones A. R., Martens L., Hermjakob H. (2009) The PSI semantic validator: a framework to check MIAPE compliance of proteomics data. Proteomics 9, 5112–5119 [DOI] [PubMed] [Google Scholar]
- 23. Stephan C., Kohl M., Turewicz M., Podwojski K., Meyer H. E., Eisenacher M. (2010) Using laboratory information management systems as central part of a proteomics data workflow. Proteomics 10, 1230–1249 [DOI] [PubMed] [Google Scholar]
- 24. Smith B., Ashburner M., Rosse C., Bard J., Bug W., Ceusters W., Goldberg L. J., Eilbeck K., Ireland A., Mungall C. J., Leontis N., Rocca-Serra P., Ruttenberg A., Sansone S.-A., Scheuermann R. H., Shah N., Whetzel P. L., Lewis S. (2007) The OBO Foundry: coordinated evolution of ontologies to support biomedical data integration. Nat. Biotechnol. 25, 1251–1255 [DOI] [PMC free article] [PubMed] [Google Scholar]
- 25. Mayer G., Jones A. R., Binz P.-A., Deutsch E. W., Orchard S., Montecchi-Palazzi L., Vizcaíno J. A., Hermjakob H., Oveillero D., Julian R., Stephan C., Meyer H. E., Eisenacher M. Controlled vocabularies and ontologies in proteomics: overview, principles and practice. Biochim. Biophys. Acta 1844, 98–107 [DOI] [PMC free article] [PubMed] [Google Scholar]
- 26. Mayer G., Montecchi-Palazzi L., Ovelleiro D., Jones A. R., Binz P.-A., Deutsch E. W., Chambers M., Kallhardt M., Levander F., Shofstahl J., Orchard S., Antonio Vizcaino J., Hermjakob H., Stephan C., Meyer H. E., Eisenacher M. (2013) The HUPO proteomics standards initiative- mass spectrometry controlled vocabulary. Database J. Biol. Databases Curation 2013, 10.1093/database/bat009 [DOI] [PMC free article] [PubMed] [Google Scholar]
- 27. Gkoutos G. V., Schofield P. N., Hoehndorf R. (2012) The units ontology: a tool for integrating units of measurement in science. Database 2012, bas033–bas033 [DOI] [PMC free article] [PubMed] [Google Scholar]
- 28. Kohlbacher O., Reinert K., Gröpl C., Lange E., Pfeifer N., Schulz-Trieglaff O., Sturm M. (2007) TOPP–the OpenMS proteomics pipeline. Bioinformatics 23, e191–e197 [DOI] [PubMed] [Google Scholar]
- 29. Berthold M. R., Cebron N., Dill F., Gabriel T. R., Kötter T., Meinl T., Ohl P., Sieb C., Thiel K., Wiswedel B. (2007) KNIME: the konstanz information miner. In Studies in classification, data analysis, and knowledge organization. (GfKL 2007). Springer, 2007 [Google Scholar]
- 30. De la Garza L., Krüger J., Schärfe C., Röttig M., Aiche S., Reinert K., Kohlbacher O. (2013) From the desktop to the grid: conversion of KNIME Workflows to gUSE. Proc. 5th Int. Work. Sci. Gateways 993, 9 [Google Scholar]
- 31. Helsens K., Colaert N., Barsnes H., Muth T., Flikka K., Staes A., Timmerman E., Wortelkamp S., Sickmann A., Vandekerckhove J., Gevaert K., Martens L. (2010) ms_lims, a simple yet powerful open source laboratory information management system for MS-driven proteomics. Proteomics 10, 1261–1264 [DOI] [PubMed] [Google Scholar]
- 32. Staes A., Van Damme P., Helsens K., Demol H., Vandekerckhove J., Gevaert K. (2008) Improved recovery of proteome-informative, protein N-terminal peptides by combined fractional diagonal chromatography (COFRADIC). Proteomics, 8, 1362–1370 [DOI] [PubMed] [Google Scholar]
- 33. Craig R., Beavis R. C. (2004) TANDEM: matching proteins with tandem mass spectra. Bioinformatics, 20, 1466–1467 [DOI] [PubMed] [Google Scholar]
- 34. Boutet E., Lieberherr D., Tognolli M., Schneider M., Bairoch A. (2007) Uniprotkb/swiss-prot. In Plant bioinformatics (pp. 89–112). Humana Press [Google Scholar]
Associated Data
This section collects any data citations, data availability statements, or supplementary materials included in this article.