

Abstract
The cyclic nucleotide cyclic guanosine monophosphate (cGMP) plays an important role in learning and memory, but its signaling mechanisms in the mammalian brain are not fully understood. Using mass-spectrometry-based proteomics, we evaluated how the cerebellum adapts its (phospho)proteome in a knockout mouse model of cGMP-dependent protein kinase type I (cGKI). Our data reveal that a small subset of proteins in the cerebellum (∼3% of the quantified proteins) became substantially differentially expressed in the absence of cGKI. More changes were observed at the phosphoproteome level, with hundreds of sites being differentially phosphorylated between wild-type and knockout cerebellum. Most of these phosphorylated sites do not represent known cGKI substrates. An integrative computational network analysis of the data indicated that the differentially expressed proteins and proteins harboring differentially phosphorylated sites largely belong to a tight network in the Purkinje cells of the cerebellum involving important cGMP/cAMP signaling nodes (e.g. PDE5 and PKARIIβ) and Ca2+ signaling (e.g. SERCA3). In this way, removal of cGKI could be linked to impaired cerebellar long-term depression at Purkinje cell synapses. In addition, we were able to identify a set of novel putative (phospho)proteins to be considered in this network. Overall, our data improve our understanding of cerebellar cGKI signaling and suggest novel players in cGKI-regulated synaptic plasticity.
Knockout (KO)1 mouse models represent powerful methods for studying the physiological relevance of a protein. However, to elucidate the effects of KO-induced perturbations on the entire system, systems-wide molecular characterization is needed, as, for instance, provided by (phospho)proteomics. Recent technological and methodological advancements now allow the mapping of protein expression, at least in cell cultures, close to completion (1–3). More challenging, proteomics is also increasingly used to attempt systems-wide proteome characterizations in tissue. This has led to semi-quantitative (4–6) and quantitative (7) reasonably comprehensive proteome data on selected tissues, in both humans and animal models. More recently, proteomics has also been applied for the in-depth profiling of perturbations in the proteome occurring in KO models. For instance, de Graaf et al. (8) used an in-depth proteomic approach to identify the proteins changed by DNA-damage-induced premature aging, using a KO mouse model lacking the excision repair cross-complementing group 1 gene. Another recent study used a mouse model lacking apolipoprotein E in order to identify biomarker candidates for coronary artery disease (9).
Adaptation and/or perturbations in the proteome caused by a KO can lead to changes in protein expression, but, at least equally likely, also to rewiring of signaling networks, through changes in post-translational modifications, such as protein phosphorylation. The application of (phospho)proteomics technology on KO or knock-in models is therefore also extremely relevant, albeit even more challenging. Hilger et al. (10) combined proteomics and phosphoproteomics on a cell line in which a phosphatase had been knocked out. To perform such experiments in a more (disease) relevant context, we should invest in functional, tissue-based phosphoproteomics approaches. A few examples of such approaches have very recently been reported. Lundby et al. (11) globally assessed phosphorylation events downstream of systemic adrenergic stimulation in mouse cardiac tissue. We recently reported on the use of a cardiac delimited CaMKII inhibited knock-in mouse to probe for substrates using a focused kinase-inhibition directed approach (12). Moreover, a mouse model lacking nitric oxide synthase (13), as a system of interest for Alzheimer disease, was recently studied via (phospho)proteomics.
Here we explored how mature state-of-the-art (phospho)proteomics technology could be used to monitor the adaptation at the proteome level of the mouse cerebellum in a mouse line deficient for cGMP-dependent protein kinase type I (cGKI, also known as PKG-I), a kinase that plays an important role in synaptic plasticity, motor learning, and other brain functions (14). The cGMP-dependent protein kinases are serine/threonine kinases that act as key mediators of nitric oxide (NO) signaling, as well as of the natriuretic peptide pathway (15). In mammals, cGKs are encoded by two different genes: prkg1 coding for cGKI, and prkg2 coding for cGKII (16). The prkg1 gene encodes two cGKI isoforms, cGKIα and cGKIβ (17), which differ in their N-terminal leucine zipper and auto-inhibitory domains. cGKI regulates cardiovascular functions such as smooth muscle and cardiac contractility (16); in the nervous system it modulates synaptic plasticity in the hippocampus (18) and cerebellum (19).
In the mammalian brain, more than 250 protein kinases are expressed, but only a few of these kinases are currently known to contribute to learning and memory. In particular, cGKIα is highly expressed in cerebellar Purkinje cells (PCs) (20, 21). Long-term depression (LTD) is an activity-dependent reduction in the efficacy of synaptic transmission and occurs at the PC synapses. Both a pharmacological approach using enzyme inhibitors (22) and a conditional PC-specific cGKI-KO (23) showed that cGKI plays a role in cerebellar LTD. Several proteins have been identified in past years as cGKI substrates in vitro or in cultured cells (15), but only a small portion of these have been confirmed as cGKI substrates in vivo. Therefore, the understanding of cGKI signaling and function depends strongly on the identification of novel in vivo substrates and signaling partners. In this perspective, the currently described approach allows us to discover potentially novel cGKI signaling routes and substrates directly in relevant cerebellar tissue. Our study revealed that cGKI-KO led to differential expression in the cerebellum of a specific group of proteins, of which many were closely connected to cGMP-cGKI signaling. More changes were observed at the phosphoproteome level, with the regulation of phosphorylation of a few hundred proteins. In particular, we hypothesize that some of the down-regulated phosphoproteins, but certainly not all, may be putative substrates of cGKI.
EXPERIMENTAL PROCEDURES
Mouse Model
cGKI-KO mice carrying a null mutation of the prkg1 gene, also termed cGKIL-/L- mice, were generated as described previously (24). Six-week-old female wild-type (WT) and cGKI-KO mice on a 129/Sv background were sacrificed, and cerebella were dissected, snap-frozen with liquid nitrogen, and stored at −80 °C until use.
Sample Preparation
Frozen cerebella were lysed by sonication in lysis buffer consisting of 10 ml of 8 m urea in 50 mm ammonium bicarbonate, one tablet of protease inhibitors (Complete Mini EDTA-free mixture, Roche Applied Science), and one tablet of phosphatase inhibitor mixture (PhosSTOP, Roche Applied Science).
After centrifugation (20,000 × g for 10 min at 4 °C), the protein concentration of the supernatant was measured using the Bradford assay, and ∼1 mg of proteins for each condition was subjected to digestion. Protein reduction and alkylation were performed using final concentrations of 2 mm dithiothreitol and 4 mm iodoacetamide, respectively. Proteins were first digested for 4 h at 37 °C with Lys-C (enzyme/substrate ratio = 1:100). The second digestion was performed overnight at 37 °C with trypsin (enzyme/substrate ratio = 1:100) in 2 m urea. The resulting peptides were chemically labeled using stable isotope dimethyl labeling as described elsewhere (25).
Strong Cation Exchange
Three biological replicates were performed. One WT littermate was used as an internal standard (IS) in all the biological replicates and was labeled with the “light” (L) label, and the cGKI-KO mice and the other WT littermates were labeled, respectively, with “intermediate” (I) and “heavy” (H) labels. The labeling efficiency was measured for all the samples and was greater than 95%. The three different labeled samples were reconstituted in 10% formic acid (FA) and mixed in a 1:1:1 ratio prior to fractionation using strong cation exchange (SCX) as described previously (26).
Briefly, the SCX was performed using a Zorbax BioSCX-Series II column (0.8-mm inner diameter, 50-mm length, 3.5 μm). SCX solvent A consisted of 0.05% FA in 20% acetonitrile (ACN), and solvent B of 0.05% FA, 0.5 m NaCl in 20% ACN. The SCX gradient was as follows: 0–0.01 min (0% to 2% B); 0.001–8.01 min (2% to 3% B); 8.01–18.01 min (3% to 8% B); 18.01–28 min (8% to 20% B); 28–38 min (20% to 40% B); 38–44 min (40% to 100% B); 44–48 min (100% B); and 48–50 min (100% to 0% B), at a flow rate of ∼40 μl/min. A total of 45 fractions were collected after the injection of ∼300 μg of labeled peptides and dried down in a vacuum centrifuge prior to LC-MS/MS analysis.
Ti4+-IMAC Enrichment
After protein digestion, the cGKI-KO mice cerebella were labeled as heavy and the WT littermates were labeled as intermediate. The labeling efficiency was measured, and then the samples were mixed in a 1:1:1 ratio using the same WT light-labeled IS in all three biological replicates. ∼300 μg of the peptide mixtures were subjected to phosphopeptide enrichment using Ti4+-IMAC material as described previously (27). Briefly, the mixtures of labeled samples were dried to completion and reconstituted in 80% ACN, 6% trifluoroacetic acid (TFA) and loaded onto the Ti4+-IMAC columns. After being washed with 50% ACN, 0.5% TFA, 200 mm NaCl and 50% ACN, 0.1% TFA consecutively, the phosphopeptides were eluted first with 10% ammonia and then with 80% ACN, 2% FA and were dried to completion in a vacuum centrifuge.
Liquid Chromatography and Mass Spectrometry (SCX and Ti4+-IMAC)
After reconstitution in 10% FA, 5% dimethyl sulfoxide, the SCX fractions containing doubly charged peptides were analyzed using nanoflow reverse phase liquid chromatography on a Proxeon Easy-nLC 1000 (Thermo Scientific) coupled to a Q-Exactive mass spectrometer (Thermo, San Jose, CA). The SCX fractions containing triply charged peptides were analyzed on an LTQ-Orbitrap Velos or an Orbitrap Elite (Thermo). Depending on the SCX UV trace, 0.5% to 10% of each fraction was injected. Densely populated 2+ and 3+ fractions were injected twice to minimize undersampling of the mass spectrometer.
Peptides were separated at a constant temperature of 40 °C on an in-house-made 50-cm column (75-μm inner diameter) packed with 1.8-μm C18 resin (Zorbax SB-C18, Agilent, Amstelveen, The Netherlands) and connected to an Orbitrap mass spectrometer (Thermo Scientific) through a nanoelectrospray ion source. The injected peptides were first trapped with a double-fritted trapping column (Reprosil C18, 3 μm, 2 cm × 100 μm, Dr Maisch, GmbH, Ammerbuch, Germany) at a pressure of 800 bar with 100% solvent A (0.1% FA in water) before being chromatographically separated by a linear gradient of buffer B (0.1% FA in ACN) from 7% up to 30% in 150 min at a flow rate of 150 nl/min.
The enriched phosphopeptides were chromatographically separated with 150-min gradient as described previously and analyzed on an LTQ-Orbitrap Elite.
Nanospray was achieved with an in-house pulled and gold-coated fused silica capillary (360-μm outer diameter, 20-μm inner diameter, 10-μm tip inner diameter) and an applied voltage of 1.7 kV. Full-scan MS spectra (from m/z 350 to 1500) were acquired in the Orbitrap with a resolution of 35,000 for the Q-Exactive and 30,000 for the Orbitrap Velos and Elite. Up to 10 most intense ions above the threshold of 500 counts were selected for fragmentation. Higher-energy C-trap dissociation (HCD) fragmentation was performed when using the Q-Exactive in a data-dependent mode, as previously described (27). For fragmentation using the Velos or Elite instrument, a decision tree method was used as described previously (28).
Data Analysis: SCX
For each raw data file recorded by the mass spectrometer, peak lists were generated using Proteome Discoverer (version 1.3, Thermo Scientific, Bremen, Germany) using a standardized workflow. Peak lists, generated in Proteome Discoverer, were searched using Mascot (version 2.3.02, Matrix Science, London, UK) against a Swiss-Prot database (version 2.3.02, taxonomy Mus musculus, 32,402 protein entries) supplemented with frequently observed contaminants. The database search was performed using the following parameters: a mass tolerance of 50 ppm for the precursor masses and ±0.6 Da for collision induced dissociation (CID)/electron transfer dissociation (ETD) fragment ions and ±0.05 Da for HCD fragments. Enzyme specificity was set to trypsin with two missed cleavages allowed. Carbarmidomethylation of cysteines was set as a fixed modification; oxidation of methionine and dimethyl labeling (L, I, H) of lysine residues and N termini were used as variable modifications. Percolator was used to filter the peptide-spectrum matches (PSMs) for <1% false discovery rate. Triplex dimethyl labeling was used as the quantification method (29), with a mass precision of 2 ppm for consecutive precursor mass scans. A retention time tolerance of 0.5 min was used to account for the potential retention time shifts due to deuterium. To further filter for high-quality data, we used the following parameters: high-confidence peptide spectrum matches, minimal Mascot score of 20, minimal peptide length of six, and only unique rank 1 peptides. For the identification and quantitation of the proteins, only unique peptides were considered. To estimate whether the proteins were significantly regulated, t test–based statistics were applied only to the proteins quantified in all the biological replicates with at least one quantified unique peptide passing the above-mentioned filtering criteria. Multiple testing correction was applied by using a permutation-based false discovery rate method in Perseus (30) (number of randomizations = 250, false discovery rate = 0.1, s0 = 0.3), and only the proteins with a ratio of cGKI-KO/IS/WT/IS (cGKI-KO/WT) ≥ 1.7-fold were considered regulated.
Data Analysis: Ti4+-IMAC
For the phosphopeptide analysis after Ti4+-IMAC enrichment, the same parameters as for the SCX analysis were used, and phosphorylation (S, T, Y) was used as a variable modification. Percolator was used to filter the PSMs for <1% false discovery rate. Phosphorylation sites were localized by applying phosphoRS (v2.0) (31). Triplex dimethyl labeling was used as the quantification method, with a mass precision for 2 ppm for consecutive precursor mass scans. A retention time tolerance of 0.5 min was used to account for the effect of deuterium on retention time. To further filter for high-quality data, we used the following parameters: high-confidence peptide spectrum matches, minimal Mascot score of 20, minimal peptide length of six, only unique rank 1 peptide, and search rank 1 peptide.
Only the ratios of the peptides with the same amino acid sequence, the same number of phosphorylation sites, and identical phosphosite localization in the three biological replicates were averaged. Normalization of the protein ratios obtained in the corresponding biological replicate was used. The cGKI-KO/WT ratios were then subjected to a Significance B test. The phosphopeptides that showed an on/off situation in the cGKI-KO or in the WT were manually quantified with an arbitrary value of 100 or 0.01 for extreme up- or down-regulation, which corresponded to the maximum allowed fold change in the Proteome Discoverer settings used. The significantly changed phosphopeptides were subjected to network analysis using STRING (32). Two different queries were performed for the up- and down-regulated phosphopeptides, with the following parameters for the active prediction methods: experiments, databases and neighborhood, required confidence (score): high. The obtained networks were implemented with the kinases using the network analysis environment Cytoscape v.2.8.2 (33) using the PhosphoSitePlus plugin. The phosphosites that showed a connection with one or more kinases were manually matched against the database repository PhosphoSitePlus (34).
The mass spectrometry proteomics data have been deposited to the ProteomeXchange Consortium (http://proteomecentral.proteomexchange.org) via the PRIDE partner repository (35) with the dataset identifier PXD000502.
Western Blot Analysis
After separation via SDS-PAGE, the proteins were transferred onto PVDF membrane. Blots were incubated with rabbit anti-cGKI (36) (1:5000), mouse anti-Huntingtin associated protein 1 (HAP1) (Novus Biological, Littleton, CO, 1:5000), rabbit anti-sarcoplasmic/endoplasmic reticulum calcium ATPase 3 (SERCA3) (Thermo Fisher, 1:2000), goat anti-cAMP-dependent protein kinase type II-β regulatory subunit (PKARIIβ) (Santa Cruz, Santa Cruz Biotechnology, Heidelberg Germany, 1:500), rabbit anti-cGMP-specific 3′,5′-cyclic phosphodiesterase (PDE5) (Cell Signaling, Danvers, MA, 1:1000), or mouse anti-glyceraldehyde-3-phosphate dehydrogenase (GAPDH) (GeneTex, Irvine, CA, 1:2000). After several washes, the blots were incubated with appropriate horseradish-peroxidase-labeled secondary antibodies and developed with ECL reagent (GE Healthcare). Proteins were quantified using the program ImageQuantTL 1D v. 7.0 (GE Healthcare).
Immunohistochemistry on Paraffin Sections
Cerebella were fixed overnight at 4 °C using 2% formaldehyde and 0.2% glutaraldehyde in PBS. Subsequently the tissues were dehydrated with an ethanol gradient and embedded in paraffin. 10-μm sections were cut, dried overnight, deparaffinized, and rehydrated. Endogenous peroxidase was blocked using peroxidase blocking solution (300 μl of 30% H2O2 and 130 μl of 10% CH3OH/PBS in a final volume of 1 ml of PBS) for 20 min at room temperature. Then antigen retrieval using the heating method was performed, and the sections were incubated overnight at 4 °C with primary antibodies: rabbit anti-cGKI (1:500) (36) or rabbit anti-SERCA3 (Thermo Fisher, 1:100). Then the sections were incubated with biotinylated secondary antibody (1:200) for 1 h followed by ABC complex (Vectastain ABC Kit, Vector Laboratories, Burlingame, CA) for 30 to 40 min at room temperature, and color was developed using diaminobenzidine peroxidase substrate. Sections were mounted with Shandon Immu-Mount (Thermo Fisher Scientific), and images were obtained under ×20 magnification using an Axioskop (Zeiss, Jena, Germany).
Immunofluorescence Staining of Frozen Sections
Cerebella were perfusion-fixed using 4% paraformaldehyde in PBS. After dissection, the tissues were incubated in the same fixative at 4 °C overnight. The cerebella were washed twice with PBS, passed through a sucrose gradient (10%, 20%, and 30%), and embedded in O.C.T. compound (VWR International GmbH, Amsterdam, The Netherlands). 10-μm sections were cut at −20 °C and dried. Sections were incubated at 4 °C overnight with rabbit anti-PDE5 (1:500) (37). Then sections were incubated with secondary antibody (Alexa 488, goat anti-rabbit, 1:200) for 1 h at room temperature and mounted with Shandon Immu-Mount (Thermo Fisher Scientific). Images were obtained under ×16 magnification using an Axiovert 200 (Zeiss).
RESULTS
Alterations in the Cerebellar Proteome of cGKI-KO Mice
We first performed an in-depth quantitative proteomics screen on the cerebella of cGKI-KO mice and compared these in a biological triplicate experiment with those of their WT littermates of identical genetic background. After dissection, the cerebellar tissues were processed as schematically described in Fig. 1A and in “Experimental Procedures.” One of the WT mice was used as an IS and multiplexed with three biological replicate comparisons (WT versus cGKI-KO). We used triplex dimethyl stable isotope labeling as described previously to enable us to quantitatively profile the proteome in three samples simultaneously (25). After trypsin digestion, the IS was tagged with the light dimethyl label. In all the biological replicates, the cGKI-KO mice were labeled as medium and the WT mice were labeled as heavy. These three peptide mixtures were fractionated using SCX and consecutively analyzed via reverse phase high-resolution LC-MS/MS using an Orbitrap employing methods essentially as described before (28). We identified a total of 6981 cerebellar proteins (supplemental Fig. S1A), of which 6210 (89%) could be quantified (Fig. 1B, supplemental Fig. S1B, supplemental Table S1A). Among these proteins, more than 95% were quantified with more than one unique peptide (supplemental Fig. S1C).
Fig. 1.

A, proteomics workflow. After dissection, the cerebella from WT and cGKI-KO mice were lysed in 8 m urea and digested with Lys-C and trypsin. Internal standard, KO, and WT peptides were labeled using stable isotope dimethyl labeling and mixed in a 1:1:1 ratio. To enhance proteome coverage, sample complexity was reduced by fractionating the resulting peptide mixtures using strong cation exchange (SCX). The same samples were used for phosphoproteome analysis, using phosphopeptide enrichment by Ti4+-IMAC. All the (phospho)peptide mixtures were analyzed via ultra-high-performance LC-MS/MS. After protein and phosphopeptide quantitation, the data were subjected to network analysis. B, MA plot of proteins quantified in all three biological replicates (the proteins that showed significant changes after statistical analysis are reported in red). C, MA plot of the quantified phosphopeptides in all the biological replicates after Ti4+-IMAC enrichment (the phosphopeptides that showed significant regulation using Significance B testing are reported in blue). D, density curves of observed peptide ratios used for the protein quantitation (blue) and for the phosphopeptides quantified after Ti4+-IMAC enrichment (red). The peptides and the phosphopeptides show a tight distribution with more extreme differentials observed at the phosphopeptide level.
To strengthen the statistics and reliability, we considered only the proteins for which we obtained both an intermediate/light (cGKI-KO/IS) and a heavy/light (WT/IS) ratio in all three replicates (3755) (supplemental Table S1B). To compare the protein expression levels, we applied a t test to the logarithmic ratios of the cGKI-KO and the WT mice using the Perseus software package (30). After the application of multiple testing corrections, only the significantly regulated proteins with a minimum ratio of cGKI-KO/WT of at least 1.7-fold were considered as differential. Out of 3755 proteins robustly quantified, 86 proteins showed up-regulation and 30 proteins were significantly down-regulated (Table I). As expected, the knocked-out cGKI was the top down-regulated protein.
Table I. Proteins differentially expressed in mouse cerebellum upon cGKI knockout.
| Accession | Gene name | Description | cGKI-KO/WT | S.D. | Number of unique peptides |
|---|---|---|---|---|---|
| Q60590 | Orm1 | α-1-acid glycoprotein 1 | 23.45 | 1.46 | 5 |
| Q91X72 | Hpx | Hemopexin | 9.27 | 2.46 | 22 |
| Q8K0E8 | Fgb | Fibrinogen β chain | 6.21 | 0.90 | 22 |
| Q8VCM7 | Fgg | Fibrinogen γ chain | 5.75 | 1.57 | 20 |
| Q8CGV2 | Tph2 | Tryptophan 5-hydroxylase 2 | 6.08 | 3.81 | 11 |
| Q3UHL1 | Camkv | CaM kinase-like vesicle-associated protein | 4.67 | 1.00 | 11 |
| P06909 | Cfh | Complement factor H | 4.24 | 1.08 | 18 |
| Q5DTY9 | Kctd16 | BTB/POZ domain-containing protein KCTD16 | 4.54 | 1.30 | 5 |
| Q9R111 | Gda | Guanine deaminase | 3.46 | 0.71 | 10 |
| O35668 | Hap1 | Huntingtin-associated protein 1 | 3.52 | 0.20 | 7 |
| O08677 | Kng1 | Kininogen-1 | 3.50 | 0.75 | 13 |
| Q9QUG9 | Rasgrp2 | RAS guanyl-releasing protein 2 | 3.46 | 0.85 | 6 |
| P01029 | C4b | Complement C4-B | 3.16 | 1.11 | 8 |
| Q8K3E5 | Ahi1 | Jouberin | 3.05 | 0.43 | 25 |
| P97467 | Pam | Peptidyl-glycine α-amidating monooxygenase | 3.15 | 0.91 | 12 |
| P50153 | Gng4 | Guanine nucleotide-binding protein G(I)/G(S)/G(O) subunit γ-4 | 3.09 | 0.84 | 1 |
| P20918 | Plg | Plasminogen | 3.04 | 0.93 | 15 |
| Q61704 | Itih3 | Inter-α-trypsin inhibitor heavy chain H3 | 2.90 | 0.56 | 11 |
| Q61147 | CERU | Ceruloplasmin | 3.00 | 0.87 | 22 |
| Q91ZP9 | Necab2 | N-terminal EF-hand calcium-binding protein 2 | 3.19 | 1.17 | 5 |
| Q91XV3 | Basp1 | Brain acid soluble protein 1 | 3.02 | 0.67 | 14 |
| P11276 | Fn1 | Fibronectin | 2.79 | 0.65 | 30 |
| P01027 | C3 | Complement C3 | 2.92 | 0.99 | 54 |
| Q921I1 | TRFE | Serotransferrin | 2.84 | 0.81 | 38 |
| Q9DB26 | Phyhd1 | Phytanoyl-CoA dioxygenase domain-containing protein 1 | 2.84 | 0.81 | 2 |
| Q91WP6 | Serpina3n | Serine protease inhibitor A3N | 2.85 | 0.65 | 3 |
| Q8BHH2 | Rab9b | Ras-related protein Rab-9B | 2.91 | 1.21 | 4 |
| Q8CHT1 | Ngef | Ephexin-1 | 2.65 | 0.59 | 3 |
| Q61423 | Kcna4 | Potassium voltage-gated channel subfamily A member 4 | 2.71 | 0.89 | 1 |
| Q03517 | Scg2 | Secretogranin-2 | 2.73 | 0.48 | 19 |
| O35526 | Stx1a | Syntaxin-1A | 2.62 | 0.44 | 11 |
| Q9CZS1 | Aldh1b1 | Aldehyde dehydrogenase X, mitochondrial | 2.64 | 0.42 | 7 |
| D3YVF0 | Akap5 | A-kinase anchor protein 5 | 2.52 | 0.42 | 7 |
| Q60673 | Ptprn | Receptor-type tyrosine-protein phosphatase-like N | 2.75 | 0.83 | 6 |
| Q9WTR5 | Cdh13 | Cadherin-13 | 2.54 | 0.52 | 9 |
| Q9WUC3 | Ly6h | Lymphocyte antigen 6H | 2.52 | 0.06 | 4 |
| Q01097 | Grin2b | Glutamate [NMDA] receptor subunit ϵ-2 | 2.41 | 0.50 | 5 |
| Q9QXV0 | Pcsk1n | ProSAAS | 2.59 | 0.53 | 9 |
| Q68ED2 | Grm7 | Metabotropic glutamate receptor 7 | 2.37 | 1.01 | 4 |
| P06728 | Apoa4 | Apolipoprotein A-IV | 2.37 | 0.87 | 14 |
| Q3TW96 | Uap1l1 | UDP-N-acetylhexosamine pyrophosphorylase-like protein 1 | 2.45 | 0.87 | 8 |
| P16460 | Ass1 | Argininosuccinate synthase | 2.32 | 0.18 | 8 |
| P31324 | Prkar2b | cAMP-dependent protein kinase type II-β regulatory subunit | 2.27 | 0.32 | 13 |
| Q68FM6 | Elfn2 | Protein phosphatase 1 regulatory subunit 29 | 2.25 | 0.26 | 5 |
| P19221 | THRB | Prothrombin | 2.34 | 0.88 | 7 |
| O54901 | Cd200 | OX-2 membrane glycoprotein | 2.32 | 0.50 | 3 |
| Q61838 | A2m | α-2-macroglobulin | 2.19 | 0.62 | 39 |
| P48320 | Gad2 | Glutamate decarboxylase 2 | 2.20 | 0.37 | 14 |
| Q921X9 | Pdia5 | Protein disulfide-isomerase A5 | 2.32 | 0.96 | 3 |
| P80560 | Ptprn2 | Receptor-type tyrosine-protein phosphatase N2 | 2.09 | 0.27 | 16 |
| P29699 | Ahsg | α-2-HS-glycoprotein | 2.31 | 1.23 | 4 |
| Q61247 | Serpinf2 | α-2-antiplasmin | 2.06 | 0.68 | 5 |
| Q01065 | Pde1b | Calcium/calmodulin-dependent 3′,5′-cyclic nucleotide phosphodiesterase 1B | 2.09 | 0.58 | 12 |
| Q8BLR2 | Cpne4 | Copine-4 | 2.08 | 0.53 | 5 |
| P31650 | Slc6a11 | Sodium- and chloride-dependent GABA transporter 3 | 1.97 | 0.28 | 11 |
| Q60771 | Cldn11 | Claudin-11 | 2.04 | 0.66 | 3 |
| Q8R5A6 | Tbc1d22a | TBC1 domain family member 22A | 2.01 | 0.67 | 7 |
| Q62188 | Dpysl3 | Dihydropyrimidinase-related protein 3 | 1.90 | 0.08 | 17 |
| P49025 | Cit | Citron Rho-interacting kinase | 1.94 | 0.45 | 15 |
| O54990 | Prom1 | Prominin-1 | 1.91 | 0.46 | 4 |
| Q2M3X8 | Phactr1 | Phosphatase and actin regulator 1 | 1.85 | 0.41 | 5 |
| Q9R226 | Khdrbs3 | KH domain-containing, RNA-binding, signal transduction-associated protein 3 | 1.98 | 0.79 | 3 |
| O35495 | Cdk14 | Cyclin-dependent kinase 14 | 1.96 | 0.63 | 2 |
| P84075 | Hpca | Neuron-specific calcium-binding protein hippocalcin | 1.86 | 0.49 | 5 |
| Q8R5M8 | Cadm1 | Cell adhesion molecule 1 | 1.83 | 0.19 | 7 |
| P70392 | Rasgrf2 | Ras-specific guanine nucleotide-releasing factor 2 | 1.90 | 0.56 | 7 |
| Q5XG69 | Fam169a | Protein FAM169A | 1.80 | 0.13 | 9 |
| P70699 | Gaa | Lysosomal α-glucosidase | 1.79 | 0.37 | 14 |
| Q61553 | Fscn1 | Fascin | 1.75 | 0.12 | 15 |
| P07356 | Anxa2 | Annexin A2 | 1.78 | 0.21 | 15 |
| Q80TL4 | Kiaa1045 | Protein KIAA1045 | 1.77 | 0.39 | 13 |
| O89026 | Robo1 | Roundabout homolog 1 | 1.76 | 0.13 | 5 |
| O08532 | Cacna2d1 | Voltage-dependent calcium channel subunit α-2/δ-1 | 1.80 | 0.42 | 21 |
| Q5RJG7 | Ispd | 2-C-methyl-d-erythritol 4-phosphate cytidylyltransferase-like protein | 1.73 | 0.03 | 4 |
| O35633 | Slc32a1 | Vesicular inhibitory amino acid transporter | 1.73 | 0.16 | 10 |
| Q8BLE7 | Slc17a6 | Vesicular glutamate transporter 2 | 1.73 | 0.37 | 7 |
| Q9EQF6 | Dpysl5 | Dihydropyrimidinase-related protein 5 | 1.73 | 0.11 | 26 |
| A2ALU4 | Shroom2 | Protein Shroom2 | 1.73 | 0.18 | 15 |
| O55091 | Impact | Protein IMPACT | 1.82 | 0.54 | 13 |
| Q61599 | Arhgdib | Rho GDP-dissociation inhibitor 2 | 1.74 | 0.35 | 6 |
| P36552 | Cpox | Coproporphyrinogen-III oxidase, mitochondrial | 1.70 | 0.22 | 8 |
| Q3UUG6 | Tbc1d24 | TBC1 domain family member 24 | 1.70 | 0.02 | 9 |
| Q66L44 | Dos | Protein Dos | 1.69 | 0.10 | 3 |
| Q922J6 | Tspan2 | Tetraspanin-2 | 1.69 | 0.14 | 3 |
| Q8BR92 | Palm2 | Paralemmin-2 | 1.69 | 0.13 | 9 |
| Q9CX80 | Cygb | Cytoglobin | 1.68 | 0.19 | 10 |
| Q8BYJ6 | Tbc1d4 | TBC1 domain family member 4 | 0.63 | 0.05 | 16 |
| Q99JP6 | Homer3 | Homer protein homolog 3 | 0.61 | 0.11 | 21 |
| Q69ZX8 | Ablim3 | Actin-binding LIM protein 3 | 0.60 | 0.04 | 12 |
| Q8BYR5 | Cadps2 | Calcium-dependent secretion activator 2 | 0.60 | 0.08 | 34 |
| P08414 | Camk4 | Calcium/calmodulin-dependent protein kinase type IV | 0.61 | 0.09 | 21 |
| Q8R071 | Itpka | Inositol-trisphosphate 3-kinase A | 0.58 | 0.07 | 20 |
| Q6NSW3 | Sphkap | A-kinase anchor protein SPHKAP | 0.60 | 0.09 | 26 |
| Q91ZH7 | Abhd3 | Abhydrolase domain-containing protein 3 | 0.58 | 0.10 | 6 |
| Q9QUR8 | Sema7a | Semaphorin-7A | 0.58 | 0.07 | 12 |
| Q0VEJ0 | Cep76 | Centrosomal protein of 76 kDa | 0.59 | 0.13 | 19 |
| Q9JJZ2 | Tuba8 | Tubulin α-8 chain | 0.57 | 0.07 | 7 |
| P25911 | Lyn | Tyrosine-protein kinase Lyn | 0.56 | 0.11 | 7 |
| Q3UH99 | Shisa6 | Protein shisa-6 homolog | 0.56 | 0.11 | 11 |
| P18653 | Rps6ka1 | Ribosomal protein S6 kinase α-1 | 0.58 | 0.12 | 17 |
| Q6WQJ1 | Dagla | Sn1-specific diacylglycerol lipase α | 0.54 | 0.10 | 14 |
| Q64338 | Pde1c | Calcium/calmodulin-dependent 3′,5′-cyclic nucleotide phosphodiesterase 1C | 0.53 | 0.10 | 5 |
| Q5F226 | Fat2 | Protocadherin Fat 2 | 0.56 | 0.19 | 37 |
| Q8QZT2 | CA096 | Uncharacterized protein C1orf96 homolog | 0.53 | 0.11 | 7 |
| Q80YX1 | Tnc | Tenascin | 0.50 | 0.03 | 45 |
| P55088 | Aqp4 | Aquaporin-4 | 0.51 | 0.25 | 2 |
| Q64518 | Atp2a3 | Sarcoplasmic/endoplasmic reticulum calcium ATPase 3 | 0.52 | 0.20 | 23 |
| Q8CG03 | Pde5a | cGMP-specific 3′,5′-cyclic phosphodiesterase | 0.54 | 0.16 | 9 |
| Q9ERY9 | ORF11 | Probable ergosterol biosynthetic protein 28 | 0.53 | 0.20 | 3 |
| Q9EQK7 | Icmt | Protein-S-isoprenylcysteine O-methyltransferase | 0.54 | 0.24 | 3 |
| Q9ERQ8 | Ca7 | Carbonic anhydrase 7 | 0.49 | 0.11 | 4 |
| Q64444 | Ca4 | Carbonic anhydrase 4 | 0.52 | 0.19 | 8 |
| P06537 | Nr3c1 | Glucocorticoid receptor | 0.49 | 0.21 | 6 |
| P68433 | Hist1h3a | Histone H3.1 | 0.40 | 0.03 | 5 |
| P62806 | Hist1h4a | Histone H4 | 0.35 | 0.01 | 9 |
| P0C605 | Prkg1 | cGMP-dependent protein kinase 1 | 0.01 | 0.00 | 11 |
To put these 116 proteins in functional perspective, we manually scrutinized the literature to better understand the role of these regulated proteins in the cerebellum and their putative role in LTD. Notably, we found that many of the regulated proteins were linked to either cGMP or cAMP signaling. This group contained the cyclic nucleotide degrading phosphodiesterases PDE5 (cGKI-KO/WT = 0.5), PDE1B (cGKI-KO/WT = 2.0), and PDE1C (cGKI-KO/WT = 0.5); the cAMP-dependent protein kinase type II-β regulatory subunit PKARIIβ (cGKI-KO/WT = 2.3); and anchoring scaffolds AKAP5 (cGKI-KO/WT = 2.6) and SPHKAP (cGKI-KO/WT = 0.6). In addition, we observed regulation of several neurotransmitter receptors (i.e. GRIN2B, mGluR7, and VGluT2), ion channels/transporters (i.e. SERCA3, CA2D1, and KCNA4), and signal transduction enzymes (i.e. the already mentioned cyclic nucleotide kinases, but also IP3KA, CaMKIV, CaMKV, LYN, and CDK14). In summary, the adaptation to cGKI-KO at the global proteome level is not enormous, as only 3% of the quantified proteins appeared substantially differentially expressed. However, many of the differentially expressed proteins are involved in cyclic nucleotide signaling and/or play a role in synaptic transmission.
Validation of the Proteomics Results by Western Blot Analysis and Immunostaining of Tissue Sections
We decided to verify some of these results via Western blot analysis, when good antibodies were available (Fig. 2A). Three cerebellar tissues for each condition (i.e. KO versus WT) were analyzed, and the protein levels were quantified from the blots (Fig. 2B). These data confirmed the absence of cGKI in cGKI-KO cerebellum and indicated reduced expression of cGMP-specific PDE5 and the calcium pump SERCA3 in cGKI-deficient cerebellum, whereas PKARIIβ and the HAP1 showed increased expression in the KO cerebellum. All these results are consistent with our proteomics results. However, with MS-based proteomics and Western blot analysis it is hardly possible to say whether the down-regulation of a protein is related to a global change or to an event localized to a particular cell type or region within the cerebellum. Therefore, we next performed immunohistochemistry and immunofluorescence staining of cerebellar sections for cGKI, SERCA3, and PDE5 (Fig. 3). These images clearly indicate that cGKI, SERCA3, and PDE5 were co-expressed in the PCs of WT mice, whereas SERCA3 and PDE5 expression levels were diminished in the cGKI-KO PCs. Thus, the Western blot results, combined with the immunostaining of cerebellar sections, confirmed the data obtained from our MS-based proteomics approach for these selected proteins. These findings also provide confidence in the remainder of reported differentially expressed proteins.
Fig. 2.
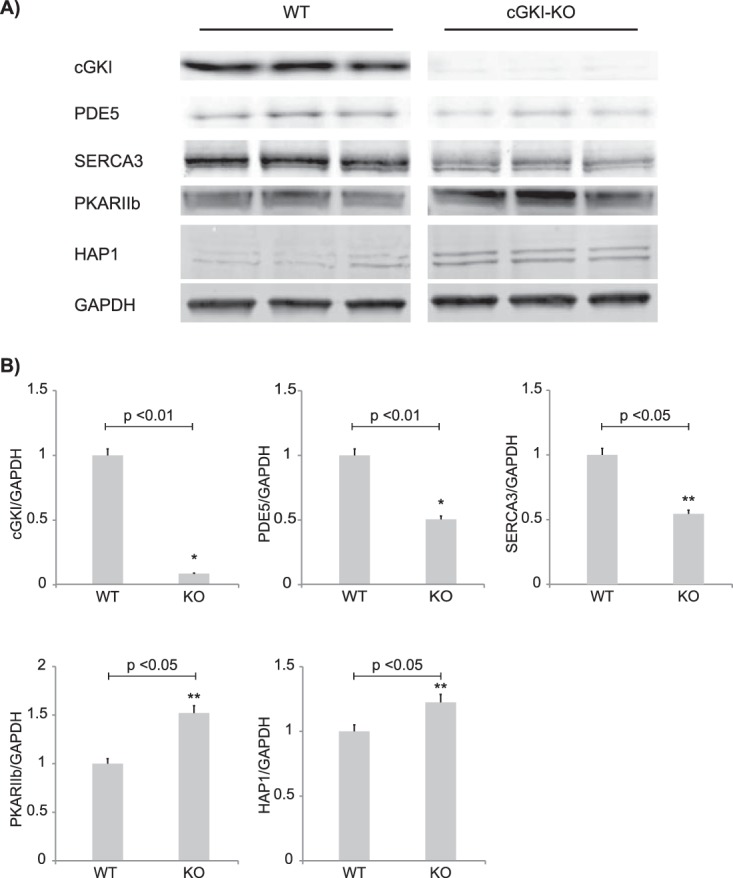
Confirmation of regulated proteins. Western blot analysis of selected significantly regulated proteins (A) and their relative quantification (B). Data values were normalized using GAPDH (30 μg of lysate). The data are given as the mean ± S.E. (n = 3 per condition). Significant changes are indicated: *p < 0.01 and **p < 0.05.
Fig. 3.

Cellular localization of cGKI-KO induced regulated proteins. Immunohistochemical (top and middle panels) and immunofluorescence (bottom panel) stainings showing the localization of cGKI, SERCA3, and PDE5 in the cerebella of WT and cGKI-KO mice (scale bar, 50 μm). cGKI (top panel) was highly expressed in the PCs of WT mice, in which SERCA3 and PDE5 were also co-expressed. Relative to WT mice, SERCA3 (middle panel) and PDE5 (bottom panel) were down-regulated in PCs of cGKI-KO mice. MCL, PCL, and GCL denote molecular, Purkinje, and granular cell layers, respectively.
Alterations in the Cerebellar Phosphoproteome of cGKI-KO Mice
Because cGKI is a protein kinase, we next globally profiled altered phosphorylation patterns as a consequence of the proteome rewiring induced by the cGKI deletion. cGKI, like its closest relative PKA, targets serine or threonine phosphorylation sites in its substrates within a basic consensus motif [R/K2–3]X[K][S/T] (38). Therefore, we used an adapted Ti4+-IMAC-based phosphopeptide enrichment strategy shown to be suited for basic kinase motifs (27). For the phosphopeptide enrichment, the same cerebella were used as for the proteome analysis (Fig. 1A). A total of 3690 unique phosphopeptides were identified after we ran the enriched phosphopeptide fractions, of which 3271 could be quantified. 2859 of these quantified phosphopeptides were identified with reasonably definite site localization (phosphoRS ≥ 75%) (31) (supplemental Table S2A). Among the localized phosphopeptides, 1696 could be quantified in at least two out of three replicates, whereas 1163 were quantified in just one replicate (supplemental Figs. S2A and S2B). The average of the quantified phosphopeptides (cGKI-KO/WT) from the three biological replicates was subjected to Significance B using the Perseus package in order to define the cutoff for significant regulation. Because the animal model that we used lacks cGKI, we had to consider that several phosphorylation sites could show an on/off regulation. We manually scrutinized the MS spectra of the peptides that showed intensity in only one of the two conditions before giving them an arbitrary value of 100 or 0.01, corresponding to the maximum allowed fold-change in the software settings. Using these parameters, we determined that a total of 345 and 113 phosphopeptides, originating from 296 phosphoproteins, could be considered up- or down-regulated, respectively (Fig. 1C).
Global evaluation of the quantitative data showed more changes at the phosphopeptide level than at the protein level; nevertheless, when the phosphopeptides were compared with the peptides used for the protein quantitation, overall they showed a similar and very tight distribution (Fig. 1D).
To visualize how the signaling network in the cerebellum adapted to the cGKI-KO, we evaluated all 296 phosphoproteins against protein and interactome databases such as STRING (32). The proteins showing increased phosphorylation were found to be enriched in Ca2+ transporters and receptors (i.e. GRID2, CCG7, and SLC32A1), enzyme modulators (i.e. PP14A and MYPT1), G-protein modulators (i.e. SRGAP3 and RIMS1), and cytoskeletal proteins (i.e. CTNNA2, NCAM, and VCL). For proteins showing decreased phosphorylation in the cGKI-KO cerebellum, we identified various proteins such as kinases (i.e. GSK3β), enzyme modulators (i.e. AMPKb1), and structural proteins (i.e. NEFH and NEM). To further complete the picture of the changes observed in the phosphopeptides that did not show any connection in the networks, we implemented the networks with the possible upstream kinases, identified in our proteomics dataset, and assigned, when possible, the right putative kinases to each regulated phosphosite.
The up-regulated network (Fig. 4A) clearly showed a set of phosphosites that were not directly linked to the KO kinase cGKI but which are thought to be phosphorylated by different kinases, such as PKA, casein kinase 2, and CaMKII. Notably, we identified one of the sites that mediates protein kinase C β (PKCβ) activity (Thr-642) as up-regulated in the cGKI-KO mice. PKCβ activity is regulated through three distinct phosphorylation events that occur at Thr500, at Thr-642 through autophosphorylation, and at the carboxy-terminal site at Ser-660 (39). The up-regulation of the phosphorylated site in the cGKI-KO mice could imply increased activity of PKCβ in the absence of cGKI, potentially to compensate for its lack.
Fig. 4.

Interaction network of cGKI-KO affected phosphoproteins. Interaction network for the observed differential phosphorylated proteins. A, phosphosites that were higher in the cGKI-KO mice are given in red, and B, those lower are in green. Evidence of protein–protein interactions (blue lines) was retrieved from the STRING database. The networks were implemented with kinases (yellow diamonds) using the PhosphoSitePlus plugin in Cytoscape. Each phosphorylation was manually checked in the PhosphoSitePlus database and connected with its (known) kinase (arrows). C, alignment of the putative cGKI phosphorylation sites for BRSK2 and Gabra6 in different species implicates a putative role of their phosphorylation in cerebellum.
Interestingly, several proteins involved in the regulation of cell survival showed regulated phosphorylations on specific sites reported to be critical for apoptosis. For example, the up-regulation of the phosphorylated Ser-1040 of MAP3K5 suppresses its pro-apoptotic function (40). On the other side, the down-regulation of the phosphorylation at Ser-116 of PEA-15, a downstream effector of PKC, AKT, and CaMKII (Fig. 4B), blocks ERK's translocation to the nuclei and therefore cell proliferation (41). Also, GSK3β showed a down-regulation of phosphorylation at Ser-389. Thornton et al. (42) showed that phosphorylation of GSK3β by p38 MAPK on Ser-389 deactivates the kinase in brain, and that it is potentially linked to cell survival.
We hypothesized that we could potentially observe cGKI substrates as being “completely” down-regulated in the cGKI-KO mice. Therefore, we screened within the down-regulated phosphopeptides for peptides harboring a cGKI-linked basic consensus motif. We observed only two, one on the serine/threonine-protein kinase BRSK2, and the other on Gabra6, both of which are involved in neural polarization. The phosphorylated sequences in these two proteins showed an elevated amount of lysine/arginine residues N-terminal to the phosphorylation site, implying that they might be cGKI substrates. Moreover, multiple alignments of both BRSK2 and Gabra6 from different species show that the putative cGKI phosphorylation sites, as well as the preceding basic residues, are well conserved, implying a possible functional role of the two proteins when phosphorylated (Fig. 4C).
Combined Proteome and Phosphoproteome Data Provide a Link to LTD
In a recent review, Collingridge et al. (43) proposed an overview of the intricate protein signaling networks involved in the regulation of LTD, in both hippocampus and cerebellum. Using the knowledge retained from the BioGRID and STRING protein–protein interaction databases (44), we observed that we could clearly put our data in the context of LTD. We were able to identify several connections between observed regulated proteins and phosphoproteins involved in cGMP–cGKI signaling and playing a role in cerebellar plasticity (Fig. 5A). We identified, for instance, in our cGKI-KO (phospho)proteome dataset a highly interconnected network among cGKI, inositol 1,4,5-trisphosphate receptor type 1 (Itpr1), Huntingtin, HAP1, and its direct interactor Jouberin (AHI1). HAP1 was recently found to form a complex with Huntingtin and Itpr1 to regulate the concentration of cytoplasmic Ca2+ (45). Furthermore, Itpr1 might be a substrate of cGKI, and activation of cGKI regulates cytoplasmic Ca2+ through the Itpr-associated cGMP kinase substrate (IRAG) in smooth muscle (46). This could imply that the Ca2+ regulation operates through a similar mechanism in cerebellum. Based on these findings we could link our data clearly to the network described as highly involved in LTD (Fig. 5B).
Fig. 5.

Integrative computational network analysis reveals implication of altered proteins in LTD. A, protein–protein interaction network of the combined proteomics and phosphoproteomics datasets. B, signaling network modulating LTD in the cerebellum, superimposed with the current quantitative proteomics and phosphoproteomics data and additional data from more recent literature. The figure is adapted from Ref. 43. Red denotes up-regulation and green down-regulation in cGKI-KO cerebellum.
DISCUSSION
In past years many studies have been carried out at the molecular biology and physiological levels in an attempt to understand the exact role of cGMP and cGKI in PCs for the regulation of LTD and cerebellar learning.
In this study we started to add much more molecular detail to this interesting field by investigating the changes that occur at the proteome and phosphoproteome levels of the cerebellum in a cGKI-deficient mouse model. Using this approach we identified a specific subset of proteins that were significantly changed in expression in cGKI-KO relative to WT littermates.
Within the down-regulated proteins, PDE5 drew our attention, because it plays an important role in the cGMP pathway. The down-regulation of PDE5 in PCs may be explained as a compensatory mechanism for the lack of cGKI action. Attempting to increase the levels of cGMP is a logical response, and the down-regulation of the cGMP-degrading enzyme PDE5 (Fig. 3) (15) is a logical way to achieve this. In line with this observation, several studies revealed that tissues lacking cGKI show an elevated concentration of cGMP (47, 48). The absence of cGKI and an increase of the cGMP level could lead to the activation of other kinases, such as PKA (47) or PKC (49). PKCIIβ, indeed, in our dataset, showed high regulation at the phosphorylation level of the activation loop site (Fig. 4B).
Moreover, other proteins that could be involved in LTD in the cerebellum show increased protein expression in the absence of cGKI, such as the protein phosphatase 1 regulatory subunit (PPP1R29). PPP1R29 functions to inhibit the activity of protein phosphatases 1 and 2A. Together with PPP1R29, a protein termed G-substrate also blocks the activity of PP1 after it has been phosphorylated by cGKI (50).
Although we were not able to identify the activation phosphosites of G-substrate at Thr72 and Thr123, we observed that the expression of G-substrate in our biological replicates did show a decreasing trend in the cGKI-KO cerebella (cGKI-KO/WT = 0.58, supplemental Table S1).
This fact could explain the greater amount of the phosphatase regulatory subunit; in fact, in accordance with the general accepted view, the inhibition of PP1 enhances the phosphorylation of the AMPA receptor and its subsequent internalization, with induction of LTD. In view of these results, it is tempting to hypothesize that, in the absence of an adequate level of G-substrate, PPP1R29 is highly expressed, to ensure the occurrence of at least a low level of LTD in the cGKI-KO cerebellum.
Ca2+ regulation is fundamental in the nervous system, and we were able to quantify significant changes at the protein level of the Ca2+ pump SERCA3 (Fig. 3) and of HAP1, which regulates the cytosolic Ca2+ concentration in a complex with Itpr1 and Huntingtin (Fig. 2). The altered expression of Ca2+ signaling proteins in cGKI-KO cerebellum is in line with the known function of cGKI in the regulation of the intracellular Ca2+ level in cardiovascular cells (46). These results warrant a more detailed analysis of potential cross-talk between cGKI and Ca2+ signaling in cerebellar PCs.
The combination of proteomics and immunostaining of brain sections gave more information on the localization of the proteins in the cerebellum. It is in fact necessary to understand whether the proteins that change in expression are expressed in PCs and/or in other areas of the cerebellum.
We hypothesize that many of the peptides that showed regulation might be phosphorylated by other kinases that are more active in cGKI-KO or that are direct substrates of cGKI. Furthermore, we were able to identify two potential cGKI phosphorylation substrates (BRKS2 and Gabra6) that showed a down-regulated ratio in the cGKI-KO mice (Fig. 4C).
Overall, we were able to identify significant changes of the cerebellar (phospho)proteome upon genetic ablation of cGKI. As a first validation, we found perturbations on proteins that are involved in synaptic plasticity, such as ion transporters, signal transduction enzymes, and neurotransmitter receptors.
The combination of the protein–protein interaction results with the current literature on cerebellar LTD allowed us to highlight the signaling mechanisms that could modulate synaptic plasticity and cerebellar learning. Moreover, we were able to identify new putative cGKI substrates that can shed more light on the cGMP–cGKI signaling pathways in the cerebellum.
Supplementary Material
Acknowledgments
Shabaz Mohammed, Teck Yew Low, and Harm Post are acknowledged for technical assistance. We thank Dr. Sergei Rybalkin and Dr. Joe Beavo for providing the anti-PDE5 antibody used for immunofluorescence staining of frozen sections.
Footnotes
Author contributions: R.F., A.J.H., and A.S. designed research; E.C., R.V., and L.M.R. performed research; E.C. and A.S. analyzed data; E.C., A.J.H., and A.S. wrote the paper; S.F. provided the mouse model.
* This work was in part supported by the PRIME-XS project (Grant No. 262067), funded by the European Union Seventh Framework Program. The Netherlands Proteomics Centre, embedded in The Netherlands Genomics Initiative, is acknowledged for funding.
 This article contains supplemental material.
1 The abbreviations used are:
- KO
- knockout
- cGMP
- cyclic guanosine monophosphate
- cAMP
- cyclic adenosine monophosphate
- cGK
- cGMP-dependent protein kinase
- PKA
- cAMP-dependent protein kinase
- WT
- wild type
- PC
- Purkinje cell
- LTD
- long-term depression
- SCX
- strong cation exchange
- Ti4+-IMAC
- immobilized titanium (IV) ion affinity chromatography
- IS
- internal standard
- FA
- formic acid
- ACN
- acetonitrile
- HAP1
- Huntingtin associated protein 1
- SERCA3
- sarcoplasmic/endoplasmic reticulum calcium ATPase 3
- PDE
- phosphodiesterase
- PKC
- protein kinase C
- Itpr
- inositol 1,4,5-trisphosphate receptor.
REFERENCES
- 1. Geiger T., Wehner A., Schaab C., Cox J., Mann M. (2012) Comparative proteomic analysis of eleven common cell lines reveals ubiquitous but varying expression of most proteins. Mol. Cell. Proteomics 11, M111.014050. [DOI] [PMC free article] [PubMed] [Google Scholar]
- 2. Munoz J., Low T. Y., Kok Y. J., Chin A., Frese C. K., Ding V., Choo A., Heck A. J. (2011) The quantitative proteomes of human-induced pluripotent stem cells and embryonic stem cells. Mol. Syst. Biol. 7, 550. [DOI] [PMC free article] [PubMed] [Google Scholar]
- 3. Nagaraj N., Kulak N. A., Cox J., Neuhauser N., Mayr K., Hoerning O., Vorm O., Mann M. (2012) System-wide perturbation analysis with nearly complete coverage of the yeast proteome by single-shot ultra HPLC runs on a bench top Orbitrap. Mol. Cell. Proteomics 11, M111.013722. [DOI] [PMC free article] [PubMed] [Google Scholar]
- 4. Kislinger T., Cox B., Kannan A., Chung C., Hu P., Ignatchenko A., Scott M. S., Gramolini A. O., Morris Q., Hallett M. T., Rossant J., Hughes T. R., Frey B., Emili A. (2006) Global survey of organ and organelle protein expression in mouse: combined proteomic and transcriptomic profiling. Cell 125, 173–186 [DOI] [PubMed] [Google Scholar]
- 5. Huttlin E. L., Jedrychowski M. P., Elias J. E., Goswami T., Rad R., Beausoleil S. A., Villen J., Haas W., Sowa M. E., Gygi S. P. (2010) A tissue-specific atlas of mouse protein phosphorylation and expression. Cell 143, 1174–1189 [DOI] [PMC free article] [PubMed] [Google Scholar]
- 6. Aye T. T., Scholten A., Taouatas N., Varro A., Van Veen T. A., Vos M. A., Heck A. J. (2010) Proteome-wide protein concentrations in the human heart. Mol. Biosyst. 6, 1917–1927 [DOI] [PubMed] [Google Scholar]
- 7. Geiger T., Velic A., Macek B., Lundberg E., Kampf C., Nagaraj N., Uhlen M., Cox J., Mann M. (2013) Initial quantitative proteomic map of 28 mouse tissues using the SILAC mouse. Mol. Cell. Proteomics 12, 1709–1722 [DOI] [PMC free article] [PubMed] [Google Scholar]
- 8. de Graaf E. L., Vermeij W. P., de Waard M. C., Rijksen Y., van der Pluijm I., Hoogenraad C. C., Hoeijmakers J. H., Altelaar A. F., Heck A. J. (2013) Spatio-temporal analysis of molecular determinants of neuronal degeneration in the aging mouse cerebellum. Mol. Cell. Proteomics 12, 1350–1362 [DOI] [PMC free article] [PubMed] [Google Scholar]
- 9. Jing L., Parker C. E., Seo D., Hines M. W., Dicheva N., Yu Y., Schwinn D., Ginsburg G. S., Chen X. (2011) Discovery of biomarker candidates for coronary artery disease from an APOE-knock out mouse model using iTRAQ-based multiplex quantitative proteomics. Proteomics 11, 2763–2776 [DOI] [PMC free article] [PubMed] [Google Scholar]
- 10. Hilger M., Bonaldi T., Gnad F., Mann M. (2009) Systems-wide analysis of a phosphatase knock-down by quantitative proteomics and phosphoproteomics. Mol. Cell. Proteomics 8, 1908–1920 [DOI] [PMC free article] [PubMed] [Google Scholar]
- 11. Lundby A., Andersen M. N., Steffensen A. B., Horn H., Kelstrup C. D., Francavilla C., Jensen L. J., Schmitt N., Thomsen M. B., Olsen J. V. (2013) In vivo phosphoproteomics analysis reveals the cardiac targets of beta-adrenergic receptor signaling. Sci. Signal. 6, rs11. [DOI] [PubMed] [Google Scholar]
- 12. Scholten A., Preisinger C., Corradini E., Bourgonje V. J., Hennrich M. L., van Veen T. A., Swaminathan P. D., Joiner M. L., Vos M. A., Anderson M. E., Heck A. J. (2013) Phosphoproteomics study based on in vivo inhibition reveals sites of calmodulin-dependent protein kinase II regulation in the heart. J. Am. Heart Assoc. 2, e000318. [DOI] [PMC free article] [PubMed] [Google Scholar]
- 13. Hoos M. D., Richardson B. M., Foster M. W., Everhart A., Thompson J. W., Moseley M. A., Colton C. (2013) Longitudinal study of differential protein expression in an Alzheimer's mouse model lacking inducible nitric oxide synthase. J. Proteome Res. 12, pp 4462–4477 [DOI] [PMC free article] [PubMed] [Google Scholar]
- 14. Kleppisch T., Feil R. (2009) cGMP signalling in the mammalian brain: role in synaptic plasticity and behaviour. Handb. Exp. Pharmacol. 191, 549–579 [DOI] [PubMed] [Google Scholar]
- 15. Francis S. H., Busch J. L., Corbin J. D., Sibley D. (2010) cGMP-dependent protein kinases and cGMP phosphodiesterases in nitric oxide and cGMP action. Pharmacol. Rev. 62, 525–563 [DOI] [PMC free article] [PubMed] [Google Scholar]
- 16. Lohmann S. M., Vaandrager A. B., Smolenski A., Walter U., De Jonge H. R. (1997) Distinct and specific functions of cGMP-dependent protein kinases. Trends Biochem. Sci. 22, 307–312 [DOI] [PubMed] [Google Scholar]
- 17. Wernet W., Flockerzi V., Hofmann F. (1989) The cDNA of the two isoforms of bovine cGMP-dependent protein kinase. FEBS Lett. 251, 191–196 [DOI] [PubMed] [Google Scholar]
- 18. Kleppisch T., Wolfsgruber W., Feil S., Allmann R., Wotjak C. T., Goebbels S., Nave K. A., Hofmann F., Feil R. (2003) Hippocampal cGMP-dependent protein kinase I supports an age- and protein synthesis-dependent component of long-term potentiation but is not essential for spatial reference and contextual memory. J. Neurosci. 23, 6005–6012 [DOI] [PMC free article] [PubMed] [Google Scholar]
- 19. Ito M. (2001) Cerebellar long-term depression: characterization, signal transduction, and functional roles. Physiol. Rev. 81, 1143–1195 [DOI] [PubMed] [Google Scholar]
- 20. Hofmann F., Sold G. (1972) A protein kinase activity from rat cerebellum stimulated by guanosine-3′:5′-monophosphate. Biochem. Biophys. Res. Commun. 49, 1100–1107 [DOI] [PubMed] [Google Scholar]
- 21. Lohmann S. M., Walter U., Miller P. E., Greengard P., De Camilli P. (1981) Immunohistochemical localization of cyclic GMP-dependent protein kinase in mammalian brain. Proc. Natl. Acad. Sci. U.S.A. 78, 653–657 [DOI] [PMC free article] [PubMed] [Google Scholar]
- 22. Hartell N. A. (1994) cGMP acts within cerebellar Purkinje cells to produce long term depression via mechanisms involving PKC and PKG. Neuroreport 5, 833–836 [DOI] [PubMed] [Google Scholar]
- 23. Feil R., Hartmann J., Luo C., Wolfsgruber W., Schilling K., Feil S., Barski J. J., Meyer M., Konnerth A., De Zeeuw C. I., Hofmann F. (2003) Impairment of LTD and cerebellar learning by Purkinje cell-specific ablation of cGMP-dependent protein kinase I. J. Cell Biol. 163, 295–302 [DOI] [PMC free article] [PubMed] [Google Scholar]
- 24. Wegener J. W., Nawrath H., Wolfsgruber W., Kuhbandner S., Werner C., Hofmann F., Feil R. (2002) cGMP-dependent protein kinase I mediates the negative inotropic effect of cGMP in the murine myocardium. Circ. Res. 90, 18–20 [DOI] [PubMed] [Google Scholar]
- 25. Boersema P. J., Raijmakers R., Lemeer S., Mohammed S., Heck A. J. (2009) Multiplex peptide stable isotope dimethyl labeling for quantitative proteomics. Nat. Protoc. 4, 484–494 [DOI] [PubMed] [Google Scholar]
- 26. Gauci S., Helbig A. O., Slijper M., Krijgsveld J., Heck A. J., Mohammed S. (2009) Lys-N and trypsin cover complementary parts of the phosphoproteome in a refined SCX-based approach. Anal. Chem. 81, 4493–4501 [DOI] [PubMed] [Google Scholar]
- 27. Zhou H., Ye M., Dong J., Corradini E., Cristobal A., Heck A. J., Zou H., Mohammed S. (2013) Robust phosphoproteome enrichment using monodisperse microsphere-based immobilized titanium (IV) ion affinity chromatography. Nat. Protoc. 8, 461–480 [DOI] [PubMed] [Google Scholar]
- 28. Frese C. K., Altelaar A. F., Hennrich M. L., Nolting D., Zeller M., Griep-Raming J., Heck A. J., Mohammed S. (2011) Improved peptide identification by targeted fragmentation using CID, HCD and ETD on an LTQ-Orbitrap Velos. J. Proteome Res. 10, 2377–2388 [DOI] [PubMed] [Google Scholar]
- 29. Kovanich D., Cappadona S., Raijmakers R., Mohammed S., Scholten A., Heck A. J. (2012) Applications of stable isotope dimethyl labeling in quantitative proteomics. Anal. Bioanal. Chem. 404, 991–1009 [DOI] [PubMed] [Google Scholar]
- 30. Cox J., Mann M. (2008) MaxQuant enables high peptide identification rates, individualized p.p.b.-range mass accuracies and proteome-wide protein quantification. Nat. Biotechnol. 26, 1367–1372 [DOI] [PubMed] [Google Scholar]
- 31. Taus T., Kocher T., Pichler P., Paschke C., Schmidt A., Henrich C., Mechtler K. (2011) Universal and confident phosphorylation site localization using phosphoRS. J. Proteome Res. 10, 5354–5362 [DOI] [PubMed] [Google Scholar]
- 32. Szklarczyk D., Franceschini A., Kuhn M., Simonovic M., Roth A., Minguez P., Doerks T., Stark M., Muller J., Bork P., Jensen L. J., von Mering C. (2011) The STRING database in 2011: functional interaction networks of proteins, globally integrated and scored. Nucleic Acids Res. 39, D561–D568 [DOI] [PMC free article] [PubMed] [Google Scholar]
- 33. Cline M. S., Smoot M., Cerami E., Kuchinsky A., Landys N., Workman C., Christmas R., Avila-Campilo I., Creech M., Gross B., Hanspers K., Isserlin R., Kelley R., Killcoyne S., Lotia S., Maere S., Morris J., Ono K., Pavlovic V., Pico A. R., Vailaya A., Wang P. L., Adler A., Conklin B. R., Hood L., Kuiper M., Sander C., Schmulevich I., Schwikowski B., Warner G. J., Ideker T., Bader G. D. (2007) Integration of biological networks and gene expression data using Cytoscape. Nat. Protoc. 2, 2366–2382 [DOI] [PMC free article] [PubMed] [Google Scholar]
- 34. Hornbeck P. V., Kornhauser J. M., Tkachev S., Zhang B., Skrzypek E., Murray B., Latham V., Sullivan M. (2012) PhosphoSitePlus: a comprehensive resource for investigating the structure and function of experimentally determined post-translational modifications in man and mouse. Nucleic Acids Res. 40, D261–D270 [DOI] [PMC free article] [PubMed] [Google Scholar]
- 35. Vizcaino J. A., Cote R. G., Csordas A., Dianes J. A., Fabregat A., Foster J. M., Griss J., Alpi E., Birim M., Contell J., O'Kelly G., Schoenegger A., Ovelleiro D., Perez-Riverol Y., Reisinger F., Rios D., Wang R., Hermjakob H. (2013) The PRoteomics IDEntifications (PRIDE) database and associated tools: status in 2013. Nucleic Acids Res. 41, D1063–D1069 [DOI] [PMC free article] [PubMed] [Google Scholar]
- 36. Valtcheva N., Nestorov P., Beck A., Russwurm M., Hillenbrand M., Weinmeister P., Feil R. (2009) The commonly used cGMP-dependent protein kinase type I (cGKI) inhibitor Rp-8-Br-PET-cGMPS can activate cGKI in vitro and in intact cells. J. Biol. Chem. 284, 556–562 [DOI] [PubMed] [Google Scholar]
- 37. Shimizu-Albergine M., Rybalkin S. D., Rybalkina I. G., Feil R., Wolfsgruber W., Hofmann F., Beavo J. A. (2003) Individual cerebellar Purkinje cells express different cGMP phosphodiesterases (PDEs): in vivo phosphorylation of cGMP-specific PDE (PDE5) as an indicator of cGMP-dependent protein kinase (PKG) activation. J. Neurosci. 23, 6452–6459 [DOI] [PMC free article] [PubMed] [Google Scholar]
- 38. Dostmann W. R., Nickl C., Thiel S., Tsigelny I., Frank R., Tegge W. J. (1999) Delineation of selective cyclic GMP-dependent protein kinase Ialpha substrate and inhibitor peptides based on combinatorial peptide libraries on paper. Pharmacol. Ther. 82, 373–387 [DOI] [PubMed] [Google Scholar]
- 39. Keranen L. M., Dutil E. M., Newton A. C. (1995) Protein kinase C is regulated in vivo by three functionally distinct phosphorylations. Curr. Biol. 5, 1394–1403 [DOI] [PubMed] [Google Scholar]
- 40. Fujii K., Goldman E. H., Park H. R., Zhang L., Chen J., Fu H. (2004) Negative control of apoptosis signal-regulating kinase 1 through phosphorylation of Ser-1034. Oncogene 23, 5099–5104 [DOI] [PubMed] [Google Scholar]
- 41. Krueger J., Chou F. L., Glading A., Schaefer E., Ginsberg M. H. (2005) Phosphorylation of phosphoprotein enriched in astrocytes (PEA-15) regulates extracellular signal-regulated kinase-dependent transcription and cell proliferation. Mol. Biol. Cell 16, 3552–3561 [DOI] [PMC free article] [PubMed] [Google Scholar]
- 42. Thornton T. M., Pedraza-Alva G., Deng B., Wood C. D., Aronshtam A., Clements J. L., Sabio G., Davis R. J., Matthews D. E., Doble B., Rincon M. (2008) Phosphorylation by p38 MAPK as an alternative pathway for GSK3beta inactivation. Science 320, 667–670 [DOI] [PMC free article] [PubMed] [Google Scholar]
- 43. Collingridge G. L., Peineau S., Howland J. G., Wang Y. T. (2010) Long-term depression in the CNS. Nat. Rev. Neurosci. 11, 459–473 [DOI] [PubMed] [Google Scholar]
- 44. Stark C., Breitkreutz B. J., Reguly T., Boucher L., Breitkreutz A., Tyers M. (2006) BioGRID: a general repository for interaction datasets. Nucleic Acids Res. 34, D535–D539 [DOI] [PMC free article] [PubMed] [Google Scholar]
- 45. Tang T. S., Tu H., Chan E. Y., Maximov A., Wang Z., Wellington C. L., Hayden M. R., Bezprozvanny I. (2003) Huntingtin and huntingtin-associated protein 1 influence neuronal calcium signaling mediated by inositol-(1,4,5) triphosphate receptor type 1. Neuron 39, 227–239 [DOI] [PMC free article] [PubMed] [Google Scholar]
- 46. Hofmann F., Feil R., Kleppisch T., Schlossmann J. (2006) Function of cGMP-dependent protein kinases as revealed by gene deletion. Physiol. Rev. 86, 1–23 [DOI] [PubMed] [Google Scholar]
- 47. Sausbier M., Schubert R., Voigt V., Hirneiss C., Pfeifer A., Korth M., Kleppisch T., Ruth P., Hofmann F. (2000) Mechanisms of NO/cGMP-dependent vasorelaxation. Circ. Res. 87, 825–830 [DOI] [PubMed] [Google Scholar]
- 48. Massberg S., Sausbier M., Klatt P., Bauer M., Pfeifer A., Siess W., Fassler R., Ruth P., Krombach F., Hofmann F. (1999) Increased adhesion and aggregation of platelets lacking cyclic guanosine 3′,5′-monophosphate kinase I. J. Exp. Med. 189, 1255–1264 [DOI] [PMC free article] [PubMed] [Google Scholar]
- 49. Kumazoe M., Sugihara K., Tsukamoto S., Huang Y., Tsurudome Y., Suzuki T., Suemasu Y., Ueda N., Yamashita S., Kim Y., Yamada K., Tachibana H. (2013) 67-kDa laminin receptor increases cGMP to induce cancer-selective apoptosis. J. Clin. Invest. 123, 787–799 [DOI] [PMC free article] [PubMed] [Google Scholar]
- 50. Aitken A., Bilham T., Cohen P., Aswad D., Greengard P. (1981) A specific substrate from rabbit cerebellum for guanosine-3′:5′-monophosphate-dependent protein kinase. III. Amino acid sequences at the two phosphorylation sites. J. Biol. Chem. 256, 3501–3506 [PubMed] [Google Scholar]
Associated Data
This section collects any data citations, data availability statements, or supplementary materials included in this article.