

Abstract
Several genes encoding for proteins involved in proliferation, invasion, and apoptosis are known to be direct miR-34a targets. Here, we used proteomics to screen for targets of miR-34a in neuroblastoma (NBL), a childhood cancer that originates from precursor cells of the sympathetic nervous system. We examined the effect of miR-34a overexpression using a tetracycline inducible system in two NBL cell lines (SHEP and SH-SY5Y) at early time points of expression (6, 12, and 24 h). Proteome analysis using post-metabolic labeling led to the identification of 2,082 proteins, and among these 186 were regulated (112 proteins down-regulated and 74 up-regulated). Prediction of miR-34a targets via bioinformatics showed that 32 transcripts held miR-34a seed sequences in their 3′-UTR. By combining the proteomics data with Kaplan Meier gene-expression studies, we identified seven new gene products (ALG13, TIMM13, TGM2, ABCF2, CTCF, Ki67, and LYAR) that were correlated with worse clinical outcomes. These were further validated in vitro by 3′-UTR seed sequence regulation. In addition, Michigan Molecular Interactions searches indicated that together these proteins affect signaling pathways that regulate cell cycle and proliferation, focal adhesions, and other cellular properties that overall enhance tumor progression (including signaling pathways such as TGF-β, WNT, MAPK, and FAK). In conclusion, proteome analysis has here identified early targets of miR-34a with relevance to NBL tumorigenesis. Along with the results of previous studies, our data strongly suggest miR-34a as a useful tool for improving the chance of therapeutic success with NBL.
Pediatric neuroblastoma (NBL)1 is the most common extracranial solid childhood tumor. It is responsible for ∼15% of all childhood cancer mortality, with an incidence of 1 to 5 per million children per year. NBLs originate from immature sympathetic nervous system cells, and almost all NBLs (90%) are diagnosed in patients younger than 5 years, with the median age of occurrence being around 22 months (1). The vast majority of NBLs arise sporadically, although some familial cases are described. Most of the tumors are found in the abdomen (65%), often in the adrenal medulla, or elsewhere in the body where sympathetic nervous system components are present (2). NBLs are divided into different stages according to the localization and extension of the primary tumor and the absence or presence of distant metastases, taking into account the extent of disease at diagnosis and risk factors including stages that are defined through imaging (see the International Neuroblastoma Risk Grouping Staging System (3, 4)). The clinically heterogeneous nature of NBL partly arises from its biological and genetic heterogeneity. Moreover, genetic and molecular findings are now routinely considered in therapeutic decision making (5–9). Amplification of the MYCN gene and a complex set of chromosomal aberrations are characteristic of poor NBL prognosis, including 1p36 deletion, 11q deletion, and 17q gain (10–12).
MiRNAs are non-coding, single-stranded RNAs of approximately 22 nucleotides, and they constitute a novel class of gene regulators in both plants and animals. They negatively regulate their targets in one of two ways, depending on the degree of complementarity between the miRNA and the target. MiRNAs exert their regulatory effects through binding with canonical 8-mer complementary sites, called “seeds,” within the 3′ untranslated regions (UTRs) of their mRNA targets. Ebner and Selbach reported additional evidence of seed recognition sites. Studying miR-34a and miR-34c that shared the same seed sequence, they were able to identify a distinct subset of targets (13). These findings enhance the complexity of the miRNA/target regulation.
Other reports have defined different post-transcriptional repression mechanisms in which miRNAs use their central region to pair to their targets or in which miRNAs can simultaneously bind 5′-UTR and 3′-UTR motifs through their 3′- and 5′-end sequences, respectively, to drive mRNA cleavage (14, 15). In general, the translational control mechanism used by miRNAs to reduce the protein levels of their target genes implies that the mRNA levels of these genes might be affected (16, 17).
MiR-34a was reported in prostate carcinomas and in primary melanomas, as well as in several tumor cell lines (18), and its loss has been linked to chemoresistance of cancers. Several studies have reported that the three miR-34 family members that have been identified are direct targets of p53, and their ectopic expression can reproduce p53-mediated effects, including cell-cycle arrest and induction of apoptosis and senescence-like phenotypes, whereas inhibition of miR-34a functions impairs p53-induced apoptosis upon DNA damage induction (19). Ji and colleagues (20) have shown another potential role for miR-34 in cancer initiation and progression in human pancreatic cancer cells, linked to its function to counteract the maintenance of tumor-initiating cells. Another study demonstrated that in CD44-positive prostate cancer cell populations (compared with CD44-negative cells), miR-34a (1p36.22) was prominently underexpressed, whereas the other two miR-34 family members studied, miR-34b and miR-34c (11q23.1) (21), did not show consistent differences between both types of cells. Finally, Guessous and colleagues (22) have shown that miR-34a expression reduces glioma stemness and induces cell differentiation into astrocytes, neurons, and oligodendrocytes. Emerging evidence suggests a role for aberrant miRNA regulation in NBLs. Expression profiling of miRNAs identified miR-34a at 1p36 and miR-125b at 11q24 as frequently deleted tumor suppressors in NBL. To date, several miR-34a targets have been experimentally validated, including CDK4/6, cyclin E2, cyclin D1, E2F5, MET, Bcl2, MYCN, and SIRT1 (23–25).
Although extensive studies have been performed to explore the role of miR-34a in several cellular frameworks, little is known about the relationships between the expression of miR-34a and the down-regulation of its targets at the early stages of its expression. Here we present a global analysis of the early effects of miR-34a on protein expression. Using quantitative bottom-up proteome analysis, we identified several new miR-34a targets. This study defined the complex protein network that is regulated by miR-34a in NBL and the effects that result from its perturbation in a cellular model system. Interestingly, integrated analysis of new identified targets, together with their expression levels in NBL patients, revealed their importance for correlation with unfavorable outcomes, thus suggesting the importance of the early action of miR-34a to control these gene targets and impair NBL progression. We demonstrate that miR-34a can simultaneously target the components of several signaling cascades involved in NBL tumorigenesis and thus the magnitude of miR-34a effects on protein expression changes that occur at early time points in NBL cells.
MATERIALS AND METHODS
Cell Culture
Neuroblastoma cell lines SHEP and SH-SY5Y were grown in RPMI medium containing 10% fetal bovine serum, 2 mm l-glutamine, and 1% penicillin/streptomycin. Cells were transfected with the pcDNA™6/TR plasmid, which encodes the Tet repressor, using Lipofectamine2000 (Invitrogen, Carlsbad, CA). Cellular clones were generated via selection with blasticidin (5 μg/ml) for 10 days to stabilize the Tet repressor. Positive clones were further transfected and stabilized with the pT-REx-DEST empty vector, pT-REx-DEST encoding miR-34a, and pT-REx-DEST encoding sequence-unrelated control (UNR).
Cellular inducible clones for miR-34a empty vector and UNR were generated via selection with neomycin (500 μg/ml). Tr6/pT-REx-DEST miR-34a, Tr6/pT-REx-DEST empty vector, and Tr6/pT-REx-DEST UNR clones were grown in RPMI medium supplemented with blasticidin (5 μg/ml) and neomycin (500 μg/ml).
Tr6/pT-REx-DEST miR-34a and Tr6/pT-REx-DEST UNR positive cell clones were evaluated by Real Time 12 h after the addition of tetracycline to a final concentration of 2 μg/ml. Further details are provided in the supplemental material.
RNA Extraction and Quantitative Real-time PCR
Total RNA was extracted from cells using Trizol (Invitrogen) according to the manufacturer's instructions, and this extract was treated with RNase-free DNase (Promega, Madison, WI). Total RNA (1 μg) was reverse transcribed using the iScriptTM cDNA Synthesis Kit (Bio-Rad, Laboratories, Inc. 2000, Hercules, CA). The reverse transcription products (cDNA) were amplified via real-time quantitative PCR using a 7900 Real-Time PCR System (Applied Biosystems, Carlsbad, CA) with Power SYBR green Master Mix.
For SYBR green PCR, Ct values were normalized to U6. Relative expressions of target genes were determined via the 2–ΔΔCt method. Data are presented as means ± S.E. of two to three replicate experiments.
Western Blotting
The cells were washed in cold phosphate-buffered saline and lysed in protein lysis buffer (20 mm sodium phosphate, pH 7.4, 150 mm NaCl, 10% glycerol, 1% Na-deoxycholate, and 1% Triton X-100) supplemented with protease inhibitors (Roche, Diagnostics, Mannheim, Germany). Cell lysates (50 μg) were separated on 10% SDS-PAGE gels and transferred onto PVDF membranes (Millipore, Corporation, Billerica, MA). After 1 h of blocking with 5% dry milk fat in phosphate-buffered saline containing 0.02% Tween-20, the membranes were incubated with the primary antibody overnight at 4 °C, and then with the secondary antibody for 1 h at room temperature. The bands were visualized with a chemiluminescence detection system (Pierce, Rockford, lL) according to the manufacturer's instructions. Information on the antibody used and a description of the experimental procedure are presented in the supplemental material.
Proteome Analysis
To analyze the effect of miR-34a on protein levels, we used post-metabolic peptide labeling with NHS esters of either 12C3 (empty vector, control cells) or 13C3 (miR-34a expressing cells) propionate (26). In brief, samples derived from three independent doxycycline (DOX) treatments of the same clone were lysed as previously described (27) and pooled together. Then, we desalted each sample by loading 1 ml of sample on a NAPTM-5 column (GE Healthcare), induced digestion by adding trypsin in a trypsin/protein ratio of 1/500, and incubated the samples overnight at 37 °C. The peptides were labeled post-metabolically using 20 mm N-hydroxysuccinimide propionate esters (26). Equal amounts of peptide sample were mixed and fractionated via RP-HPLC as described previously (27). Following peptide fractionation, peptide fractions eluting 20 min apart were pooled to reduce the number of high-performance LC-MS/MS runs (20 per analysis). Peptides were then analyzed on an LTQ-Orbitrap Velos mass spectrometer.
The obtained peptide mixtures were introduced into an LC-MS/MS system, an Ultimate 3000 RSLC nano (Dionex, Amsterdam, The Netherlands) in-line connected to an LTQ Orbitrap Velos (Thermo Fisher Scientific, Bremen, Germany), for analysis. Peptides were loaded on a trapping column (made in-house; 100 μm inner diameter × 20 mm, 5-μm beads, C18 Reprosil-HD, Dr. Maisch). After being back-flushed from the trapping column, the sample was loaded on a reverse-phase column (made in-house; 75 μm inner diameter × 150 mm, 3-μm beads, C18 Reprosil-HD, Dr. Maisch, Ammerbuch-Entringen, Germany). Peptides were loaded with solvent A (0.1% trifluoroacetic acid, 2% acetonitrile) and were separated with a linear gradient from 2% solvent A′ (0.1% formic acid) to 55% solvent B′ (0.1% formic acid, 80% acetonitrile) at a flow rate of 300 nl/min, followed by a wash reaching 100% solvent B′.
The mass spectrometer was operated in data-dependent mode, automatically switching between MS and MS/MS acquisition for the 10 most abundant peaks in a given MS spectrum. In the LTQ-Orbitrap Velos, full-scan MS spectra were acquired in the Orbitrap at a target value of 1E6 with a resolution of 60,000. The 10 most intense ions were then isolated for fragmentation in the linear ion trap, with a dynamic exclusion of 30 s. Peptides were fragmented after filling the ion trap at a target value of 1E4 ion counts. From the MS/MS data in each LC run, Mascot Generic Files were created using Distiller software (version 2.4.3.3, Matrix Science, Inc, Boston, MA). In the generation of these peak lists, grouping of spectra was allowed in Distiller with a maximum intermediate retention time of 30 s, and a maximum intermediate scan count of 5 was used where possible. Grouping was done with a 0.005-Da precursor tolerance. A peak list was only generated when the MS/MS spectrum contained more than 10 peaks. There was no deisotoping, and the relative signal-to-noise limit was set at 2. These peak lists were then searched with the Mascot search engine (28) using the Mascot Daemon interface (version 2.4, Matrix Science). Spectra were searched against the Swiss-Prot database (version 20111214, sequence number 533657). Variable modifications allowed were pyro-glutamate formation of N-terminal glutamine and acetylation of the N terminus. Methionine oxidation was set as a fixed modification. The mass tolerance on precursor ions was 10 ppm (with Mascot's C13 option set to 1), and that on fragment ions was 0.5 Da. The peptide charge was set at 1+, 2+, 3+, and the instrument setting was electrospray ionization–TRAP. The enzyme was set to endoproteinase Lys-C, allowing one missed cleavage; also, cleavage was allowed when lysine was followed by proline. Only peptides that were ranked 1 and scored above the threshold score, set at 99% confidence, were withheld. The false discovery rate was calculated for every search and was always found to be lower than 1.5% (see supplemental Table S1).
Identified peptides were quantified using Mascot Distiller Toolbox version 2.4.0 (Matrix Science) in the precursor mode. All data management was done by ms lims (29). The results of analyses are shown as the peptide ratio of the light (L)-labeled (empty vector, 12C3) versus the heavy (H)-labeled sample (miR-34a, 13C3). Data analysis was performed using R embedded in Knime. The data were filtered by removing all peptides smaller than eight amino acids, and only the proteins containing at least two peptides were taken into account for data analysis. The data are available in the PRIDE database (30). The data were converted using PRIDE Converter (31).
MiR-34a Target Prediction
MiR-34a targets were predicted based on examinations of predicted targets from TargetScan, miRanda, and Probability of Interaction by Target Accessibility (PITA). Each database relies on different algorithms of target prediction and uses different read-out scales. Potential gene targets were chosen based on their presence in at least two of the databases of all of the predicted algorithms used in the analysis.
Cloning of 3′-UTRs
The 3′-UTRs of selected mRNAs containing putative miR-34a binding sites were PCR-amplified from human genomic DNA with the Kapa HiFi HotStart system (Kapa Biosystem, Woburn, MA). These 3′-UTRs were cloned into pRL-TK vector (Promega) and verified by sequencing. A detailed list of 3′-UTRs, their sequences, and primers used for cloning is provided in the supplemental material.
Luciferase Assays
HEK293 cells were seeded in 12-well format and transfected after 24 h with 100 ng of the indicated Renilla luciferase reporter plasmid, 20 ng of Firefly reporter plasmid as a normalization control, and 50 ng of miR-34a or a negative control oligonucleotide. Luciferase assays were carried out 24 h after transfection using the Dual Luciferase Reporter assay system (Promega) according to the manufacturer's instructions. Fluorescence intensities were measured with a luminometer (Stratec, Birkenfeld, Germany).
Protein Stability Assay
SHEP and SH-SY5Y cells grown in RPMI 1640 medium supplemented with 10% fetal calf serum were seeded on six-well plates and treated with 20 μg/ml cycloheximide in dimethyl sulfoxide or dimethyl sulfoxide alone for various times. Cellular extracts were prepared in lysis buffer consisting of 20 mm sodium phosphate, pH 7.4, 150 mm NaCl, 10% glycerol, 1% Na-deoxycholate, and 1% Triton X-100 supplemented with protease inhibitors (Roche). Then 25 μg of the protein extract was resolved on SDS-PAGE, and immmunoblotting was carried out using standard protocols with anti-ABCF2, anti-TGM2, anti-LYAR, anti-ALG13, anti-TIMM13 (Abcam, Cambridge, UK), α-tubulin (Sigma-Aldrich, Buchs, SG, Switzerland), and anti-mouse IgG-HRP (Zymed Laboratories Inc., S San Francisco, CA). Quantification of the bands was done using ImageJ.
Adhesion Assay
The SHEP and SH-SY5Y cells were washed with 1 mg/ml BSA in RPMI and blocked for 1 h with 5 mg/ml BSA in RPMI at 37 °C. Then the cells (5 × 10⁴ cells) were added to 96-well plates previously coated (16 h at 4 °C) with 10 μg/ml fibronectin (BD Biosciences), 10 μg/ml mouse collagen IV (BD Biosciences), or 1 μg/ml BSA. The cells were allowed to adhere for 1 h after treatment with 2 μg/ml doxycycline for 3 h to induce endogenous miR-34a expression. The cells were washed carefully, fixed, stained with crystal violet, dried overnight, and lysed in 2% SDS. Cell numbers were estimated with a SpectraMax microplate reader (Molecular Devices, Sunnyvale, CA) at 550 nm. The background absorbance from a BSA-coated well was subtracted. Statistical significance was determined using Student's t tests.
Statistical Analyses
All biochemical experiments were performed in triplicate unless otherwise stated. The two-tailed Student's t test was used to test for significance. Survival curves were constructed via the Kaplan and Meier method, with differences between curves tested for statistical significance using the log-rank test.
RESULTS
Conditional miR-34a Expression in Neuroblastoma Cell Lines
Seed sequence analyses and whole-genome mRNA sequences stored in public databases predict that miR-34a might have many more targets than those already identified (32–34). In order to identify miR-34a targets, we generated several cellular stable clones containing tetracycline-inducible precursor miR-34a in two different NBL cell lines, SHEP and SH-SY5Y. We chose these two cellular models because although they originate from the same parental cell line (SK-N-SH), they show different biological features, being epithelial and neuroblast-like cells, respectively (35). The system used here minimized the variability of microRNA expression upon transient transfection and, during microRNA processing, reduced the side effects on RNA-induced silencing complex obstruction, a phenomenon that occurs if a miRNA is constitutively expressed. Ectopic expression of pre-miR-34a and mature miR-34a in each generated clone was verified via RT-PCR (supplemental Figs. S1A and S1B). Here, we detected in some clones a significant (p < 0.05) fold increase of mature miR-34a levels in tetracycline-treated cells 6 h after induction relative to untreated control cells (supplemental Figs. S1A and S1B). From among the clones analyzed, we chose SHEP-D and SH-SY5Y-4 for further experiments, as both clones showed low levels of endogenous miR-34a and comparable levels of miR-34a expression upon DOX stimulation.
To further evaluate the responsiveness to DOX as a function of time, we evaluated miR-34a expression in a time-dependent manner in SH-SY5Y-4 cells. DOX promoted a rapid increase in pre-miR-34a expression (supplemental Fig. S1C), with about 10-fold higher levels of pre-miR-34a after 1 h of DOX treatment, and pre-miR-34a expression increased further after 4 h of DOX treatment (approximately 15-fold). As expected, the expression of mature miR-34a followed similar kinetics as pre-miR-34, showing higher levels after 1 h of induction, thus suggesting that pre-miR-34a processing happens quickly (supplemental Figs. S1C and S1D). Further, we evaluated miR-34a levels at later time points (supplemental Figs. S1E and S1F) and verified the protein levels of previously studied miR-34a targets (Survivin, Cyclin D3, and C-MYC; see Ref. 32), thus confirming their specific decreased levels following 48 h of induction of miR-34a expression (supplemental Figs. S1G and S1H). Having validated miR-34a expression and its effects on known late targets, we employed these cells for differential proteome analysis (Fig. 1).
Fig. 1.
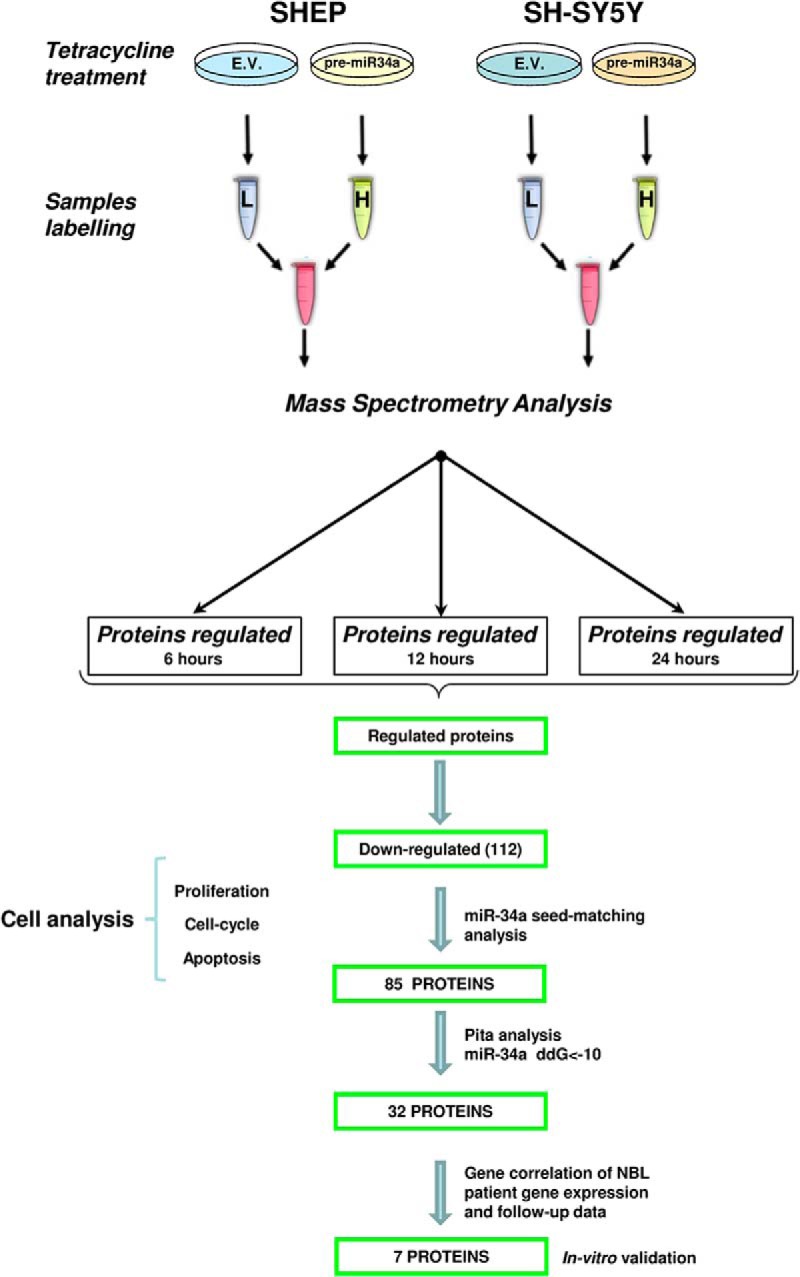
Schematic outline of post-metabolic labeling with NHS-propionylate (C12 and C13) on lysine (K) and arginine (R) residues coupled with mass spectrometry analysis. SHEP and SH-SY5Y inducible clones were stimulated with doxycycline to activate pre-miR-34a expression and harvested at three different time points (6, 12, and 24 h). After labeling, samples were mixed together in a 1:1 ratio and fractionated via RP-HPLC. Bottom, representative workflow showing the path followed in this study.
Early Time Point miR-34a-induced Proteome Changes
SHEP-D and SH-SY5Y-4 clones and their respective controls (empty vector inducible clones) were stimulated with DOX, and cells were harvested 6, 12, or 24 h after induction. Subsequently, protein samples were prepared and subjected to mass spectrometric analysis (performed in biological duplicate). In total, over 3,500 proteins were identified by at least two different peptides (supplemental Fig. S2A). To identify early miR-34a targets, we focused on differentially expressed proteins 6 h after DOX induction in both NBL cell lines (protein ratio distributions are shown in supplemental Fig. S2B). Each time point of proteomic analyses was the result of a pool (in equal molar ratio) of three independent DOX induction experiments for each clone in the analysis. Given that the proteomic fluxes introduced by miRNAs are often subtle, unlike many other studies that report, for instance, the top quartile of regulated proteins, we decided to use a statistical approach that, within each individual experiment, identified those proteins with significantly altered protein levels (p ≤ 0.01). In this way, in SHEP-D and SH-SY5Y-4 cells, 12 and 21 proteins, respectively, were found to be up-regulated, whereas 20 down-regulated proteins were found in SHEP-D cells, and 56 in SH-SY5Y-4 cells (Fig. 2A). Of note, only five proteins (COL1A1, PLEC, PTRF, VIME, and RRMJ3) were common among the down-regulated proteins in both cell lines, and when this analysis was repeated for samples after 12 h of miR-34a induction, only one common protein was identified (COL1A1) (Fig. 2B). This suggests that the repertoire of miR-34a-affected proteins might be different in the two NBL cellular models studied.
Fig. 2.

Venn diagrams of down-regulated proteins identified in SHEP and SH-SY5Y cells 6 h (A) and 12 h (B) after miR-34a induction. Tables show the list of the overlapping proteins in SHEP and SH-SY5Y cells and the log2 ratio (peptide ratio of the light (L)-labeled (empty vector, 12C3) versus the heavy (H)-labeled sample (miR-34a, 13C3) of each protein at each time point. C, 186 proteins were found to be regulated by miR-34a in SHEP and SH-SY5Y cells. Among them, 74 were up-regulated and 112 were down-regulated. D, schematic representation of proteins regulated between different time points in the same cell line. Green indicates increased protein amount, black represents no change, and red denotes down-regulated proteins (normalized Log2 values).
Great attention is given today to miRNA targets that contain a perfect match to the miRNA seed region in their 3′-UTR. We speculated that genes encoding for the five common proteins down-regulated upon miR-34a expression had a high probability of being direct miR-34a targets. To determine whether these proteins were direct targets of miR-34a, we searched the seed sequences for the match with miR-34a in the 3′-UTR of these transcripts. Using Probability of Interaction by Target Accessibility, a bioinformatics microRNA target prediction tool, we found that miR-34a can potentially target plectin (a protein involved in cytoskeleton structure and remodeling), polymerase I and transcript release factor (a protein that enables the dissociation of paused ternary polymerase I transcription complexes from the 3′-end of pre-rRNA transcripts and is required for dissociation of the ternary transcription complex), rRNA methyltransferase 3, and vimentin (a protein involved in epithelial mesenchymal transition).
This analysis was negative for the CO1A1 gene, and any seed sequence match for miR-34a on the CO1A1 3′-UTR sequence was found. To this end, other efforts were made to search these sequences within the 5′-UTR region and in the whole coding sequence of CO1A1. These analyses were negative for the 5′-UTR, but several putative seed sites for coding sequence were identified (ΔΔG>-10; of note, the value was above the constrained criterion used in the skim presented in Fig. 1) (supplemental Fig. S3A). Then, to confirm further the proteomic data, Western blot analyses were performed on miR-34a clones and their respective controls upon DOX treatment. The results presented in supplemental Fig. S3B show that COL1A1 protein was down-regulated in those clones expressing miR-34a, whereas its levels did not change in empty vector and UNR clones, thus further suggesting that miR-34a might regulate COL1A1 protein expression by targeting seed sequences within its coding sequence. At this time we cannot exclude the action of other, indirect mechanisms that might regulate COL1A1 expression.
We then tested whether regulation by miR-34a was a direct effect of miR-34a on seed recognition in the 3′-UTR of each transcript. For this the full-length 3′-UTR of each gene was cloned downstream of a luciferase reporter plasmid. The resulting reporter vectors were transfected into HEK293 cells together with miR-34a or an UNR, and a dual luciferase reporter assay was performed. As shown in supplemental Fig. S3C, miR-34a repressed the 3′-UTR of polymerase I and transcript release factor and vimentin, whereas it had no effect on plectin and rRNA methyltransferase 3′-UTR luciferase activities. Taken together, these data show that miR-34a was able to directly target the 3′-UTRs of polymerase I and transcript release factor and vimentin. This appears to have led to early down-regulation of the encoded proteins in both of these NBL models, the SHEP-#D and SH-SY5Y-#4 clones, which thus shows signaling and functionality of miR-34a within epithelial mesenchymal transition and RNA transcriptional regulation. However, plectin and rRNA methyltransferase 3 showed no 3′-UTR-mediated down-regulation following the miR-34a expression, leading us to speculate that there are probably other mechanisms of silencing that are not yet known but which need to be considered and which could be revealed by mass spectrometry analysis.
We then investigated the effects of pre-miR-34a expression on the proteome at later time points (i.e. 12 h after the induction of pre-miR-34a expression). As shown in Fig. 2B, there were 26 and 23 significantly down-regulated proteins in the SHEP-D and SH-SY5Y-4 clones, respectively. Among these, only one was common to both the SHEP-D and SH-SY5Y-4 clones: COL1A1, which was already found to be down-regulated upon 6 h of miR-34a expression.
Global gene ontology analyses showed that although the two cell lines had different characteristics, the repertoire of miR-34a-affected proteins had similar biological functions (see supplemental Table S5) and were implicated in metabolic processes, cellular component assembly, cytoskeleton reorganization, biological regulation, and apoptosis, among other functions. Furthermore, we saw that the down-regulated proteins identified in both cellular models were involved in several common pathways (supplemental Figs. S4A and S4B).
Although it is known that mRNAs are down-regulated by miRNAs, little is known about any potential up-regulation processes involving those mRNAs. Tsai and colleagues (36) showed that miR-346 can up-regulate the expression of its targets. This is investigated in Fig. 2C, which illustrates all of the protein expression changes (up- and down-regulation) arising from the induction of pre-miR-34a expression at 6 h, 12 h, and 24 h. The highlights illustrated in the magnified insets in Fig. 2D show the proteins for which the down-regulation was constant at each time point and the proteins whose amounts fluctuated over the 24 h of induction of miR-34a expression.
Having established that several proteins were found to be regulated at early time points, we investigated when and how these effects occurred.
In Fig. 3, we present the relationship between miR34a-induced fold changes in protein expression at two different time points (6 h versus 12 h, 6 h versus 24 h, or 12 h versus 24 h). The results show that the correlation (Pearson's coefficient values) between protein fold changes decreased when we plotted 6 h versus 12 h and 6 h versus 24 h in both cell lines analyzed, indicating that the majority of the miR34-a effect occurs at early time points.
Fig. 3.

Scatter plots correlating changes in protein expression at two different time points as measured via shotgun analysis. A, normalized log2 ratio at 6 h versus normalized log2 ratio at 12 h. B, normalized log2 ratio at 6 h versus normalized log2 ratio at 24 h. C, normalized log 2 ratio at 12 h versus normalized log2 ratio at 24 h in SHEP cells. D, normalized log2 ratio at 6 h versus normalized log2 ratio at 12 h. E, normalized log2 ratio at 6 h versus normalized log2 ratio at 24 h. F, normalized log2 ratio at 12 h versus normalized log2 ratio at 24 h in SH-SY5Y cells.
The approach presented here is different from previously used models (21–23) reported in the literature in which proteome variations were measured 24 h or more after miRNA expression.
Biological Analysis of miR-34a Target Down-regulation and Functional Impact in Neuroblastoma Cells
Several studies have shown that in many cell lines, miR-34a suppresses cell growth by targeting genes involved in G1/S transition through the induction of a caspase-dependent apoptotic pathway (17–24, 37–41). For a more detailed analysis, we further evaluated cell proliferation in real time using the xCELLigence system and observed that upon miR-34a induction, cell proliferation of both SHEP-D and SH-SY5Y-4 cells decreased after only 3 h of miR-34a induction (Fig. 4A). To further validate our results, we additionally generated tetracycline-inducible clones of the two NBL cell lines that expressed a non-silencing RNA (the UNR) (see supplemental Figs. S4C and S4D). This sequence retained a backbone based on the pre-miR30 stem and loop (see supplemental material). As shown in Fig. 4A, upon DOX induction of these UNR-expressing clones, we did not observe cell proliferation impairment similar to the results presented for the empty vector clones. These generated clones served as controls and confirmed that the inhibition of proliferation observed upon induction of miR34a was not due to a nonspecific response to cellular stress.
Fig. 4.

A, normalized cell index as a measure of proliferation of SHEP (left, SHEP-D, green line; SHEP-UNR#A, red line; SHEP-UNR#D, blue line; SHEP-empty vector (E.V.), magenta line) and SH-SY5Y (right, SH-SY5Y-UNR#1, red line; SH-SY5Y-UNR#5, blue line; SH-SY5Y-4, green line; SH-SY5Y-E.V., magenta line) cells treated with doxycycline (DOX). Data are means ± S.D. B, C, propidium-iodide-based FACS analysis showing that the miR-34a expression 6 h (B) and 12 h (C) after DOX stimulation induced a decrease of SHEP and SH-SY5Y cells in S phase relative to the control cells. Each resulting histogram consists of three populations: G1 population (to the left, in red), S-phase population (blue stripe), and G2 population (to the right, in red). D, representative histograms presenting analysis of SHEP and SH-SY5Y inducible clones (12 h after DOX stimulation) stained with annexin V-FITC and propidium iodide (PI). Each dot plot shows four cell populations: heavy damage and dead cells (square 1) stained very weakly with annexin V-FITC and strongly with PI; secondary necrotic cells (square 2) strongly stained with PI and annexin V-FITC; viable cells (square 3) weakly stained with PI and annexin V-FITC; and apoptotic cells (square 4) stained strongly with annexin V-FITC but weakly with PI. All data presented were obtained in triplicate assays and repeated twice.
To further corroborate these findings, we screened for potential cell cycle alterations in the NBL generated clones via FACS analysis. We treated asynchronous SHEP and SH-SY5Y cells with DOX and determined the number of cells in S-phase, G1-phase, and G2-phase and found a decrease of cells in the S-phase (57.64% to 34.25% and 52.83% to 35.15%, respectively) and an enhancement of cells in both G1 (40.89% to 53.55% and 46.12% to 55.12%) and G2 phases (1.47% to 12.20% and 1.06% to 9.73%) relative to the empty vector clones upon 6 h of miR-34a induction (Fig. 4B). The UNR clones showed similar results (data not shown).
We additionally found a decrease of cells in the S-phase and an increase of cells in G1 and G2 phases in miR-34a overexpressing cells relative to empty vector cells; those results were similarly observed after 12 h (Fig. 4C) and 24 h (see supplemental Fig. S4E) of DOX treatment.
Next, we asked whether miR-34a at this early time point of expression increased the fraction of apoptotic cells by analyzing for annexin V and propidium iodide staining, but we found no substantial variation in the fraction of apoptotic cells in miR-34a-expressing clones, either SHEP or SH-5YSY cells, relative to control clones. The fraction of annexin V–positive SHEP cells varied from 2.8% to 3.3%, and that for SH-5YSY cells varied from 0.6% to 0.3% (Fig. 4D). These results suggest that apoptotic events do not occur substantially in the early phases of miR-34a expression, but cells undergoing apoptosis will presumably be present, albeit at the later stages, after 12 h of miR34a expression.
Selection of Candidate Proteins with Relevance to NBL
Considering that the genes directly regulated by miRNA might vary among cell types, we combined proteomics results generated at 6 and 12 h following miR-34a induction in both cell lines. In this way, we obtained a set of 112 proteins down-regulated by miR-34a and thus potentially involved in NBL. After we sorted this protein set for the presence of miR-34a seed-matching sequences in the 3′-UTRs of their transcripts, it was predicted that miR-34a could regulate 85/112 proteins (75.9%). These analyses were performed according to a previously described method (42) to define the importance of the evaluation of the energy-based scores for miRNA-target interactions that are equal to the differences between the free energy gained by the binding of the miRNA to the target (the ΔG duplex) and the free energy lost by the unpairing of the target-site nucleotides (the ΔG open). Considering then only prediction sites with ΔΔG values < 10 (42), we found 32 genes enriched for an miR-34a seed sequence (Table I). We then screened these genes/proteins for possible correlation of their expression levels with clinical outcomes in a public gene-expression database (R2; GEO I.D.: GSE16476). The aim here was to improve our target prediction functionality in NBL and, finally, to explore the potential of those selected genes as independent predictors of the survival of patients with NBL (see also Fig. 1). Using this flowchart, we found that among the genes analyzed, even after using Bonferroni statistical corrections, of 32 potential miR-34a early targets, only 7 genes significantly correlated with lower overall survival when they were overexpressed at the mRNA level in NBL tumor cohorts (n = 88 cases for mRNAs in this analysis) (see Fig. 5A and associated table of overall survival). Of note, these genes were further predicted to retain seed sequences for miR-34a by two other target-prediction algorithms: TargetScan and miRanda. These genes are involved in differentiation (LYAR, CTCF), apoptosis, proliferation (KI67), molecular transport (TIMM13, ABCF2), and activation of several metabolic pathways (TGM2, ALG13).
Table I. List of 33 genes enriched for miR-34a seed sequence in their 3′-UTR.
| Accession | Protein name | Gene name | Sites | Score | Cell | Median of the ratio | Median of the ratio (log2) |
|---|---|---|---|---|---|---|---|
| P19367 | HXK1 | HK1 | 6 | −21.07 | SHSY 6H | 1.65 | 0.96 |
| O15231 | ZN185 | ZNF185 | 5 | −16.74 | SHEP 6H | 3.05 | 1.45 |
| Q9UG63 | ABCF2 | ABCF2 | 7 | −15.73 | SHEP 12H | 1.79 | 0.83 |
| P15586 | GNS | GNS | 5 | −15.39 | SHSY 6H | 2.66 | 1.65 |
| P40261 | NNMT | NNMT | 4 | −15.31 | SHSY 12H | 1.99 | 1.07 |
| Q15746 | MYLK | MYLK | 10 | −15.13 | SHEP 6H | 3.29 | 1.56 |
| P07858 | CATB | CTSB | 9 | −14.68 | SHSY 12H | 1.64 | 0.78 |
| P30419 | NMT1 | NMT1 | 12 | −14.57 | SHEP 12H | 1.93 | 0.94 |
| P46013 | KI67 | MKI67 | 8 | −14.46 | SHSY 12H | 1.79 | 0.92 |
| Q9UHB6 | LIMA1 | LIMA1 | 2 | −13.68 | SHEP 6H | 2.55 | 1.20 |
| Q9UHB6 | LIMA1 | LIMA1 | 2 | −13.68 | SHEP 12H | 2.34 | 1.22 |
| P13928 | ANXA8 | ANXA8 | 3 | −13.51 | SHSY 12H | 2.47 | 1.38 |
| Q9H307 | PININ | PNN | 2 | −13.51 | SHSY 6H | 1.49 | 0.82 |
| Q9NP73 | ALG13 | ALG13 | 1 | −13.07 | SHSY 12H | 2.55 | 1.13 |
| O95340 | PAPS2 | PAPSS2 | 6 | −12.85 | SHEP 12H | 1.74 | 0.79 |
| Q8WX93 | PALLD | PALLD | 9 | −12.72 | SHEP 12H | 1.96 | 0.96 |
| P06396 | GELS | GSN | 3 | −12.71 | SHSY 12H | 2.55 | 1.43 |
| P13796 | PLSL | LCP1 | 3 | −12.71 | SHSY 12H | 4.10 | 1.71 |
| P21980 | TGM2 | TGM2 | 6 | −12.43 | SHEP 12H | 2.23 | 1.15 |
| Q9Y4K1 | AIM1 | AIM1 | 5 | −12.31 | SHSY 6H | 1.79 | 1.07 |
| Q13510 | ASAH1 | ASAH1 | 2 | −12.1 | SHSY 12H | 1.69 | 0.83 |
| Q96MU7 | YTDC1 | YTHDC1 | 5 | −11.97 | SHSY 6H | 1.82 | 0.88 |
| P35659 | DEK | DEK | 2 | −11.95 | SHEP 12H | 1.71 | 0.77 |
| Q6P1J9 | CDC73 | CDC73 | 3 | −11.46 | SHSY 12H | 181.04 | 3.95 |
| Q7Z6K5 | CO038 | C15orf38 | 6 | −11.46 | SHEP 6H | 59.93 | 3.11 |
| P07339 | CATD | CTSD | 3 | −11.33 | SHSY 12H | 2.08 | 1.14 |
| P09486 | SPRC | SPARC | 5 | −11.3 | SHSY 12H | 1.78 | 0.91 |
| Q9UPN9 | TRI33 | TRIM33 | 7 | −10.97 | SHEP 6H | 2166.96 | 6.00 |
| Q9NX58 | LYAR | LYAR | 1 | −10.66 | SHSY 6H | 2.32 | 1.45 |
| P49711 | CTCF | CTCF | 2 | −10.56 | SHSY 6H | 1.76 | 1.05 |
| Q6WKZ4 | RFIP1 | RAB11FIP1 | 8 | −10.39 | SHEP 12H | 1.72 | 0.78 |
| Q8WU90 | ZC3HF | ZC3H15 | 2 | −10.28 | SHEP 12H | 65.84 | 3.60 |
| Q9Y5L4 | TIM13 | TIMM13 | 4 | −10 | SHSY 12H | 7.74 | 2.11 |
Fig. 5.

A, Kaplan–Meier plots for overall survival based on expression levels of LYAR, CTCF, TGM2, Ki67, TIMM13, ALG13, and ABCF2 in NBL, with a group separation based on the most significant p value. From among the multiple probe sets corresponding to the same genes, we chose the probe sets with the highest average present signal (APS, average signal of all samples considered to express a selected gene) using the program default setting. Next to the Kaplan plot is a small subplot that is a graphical representation of the p value plotted against the mRNA expression level values. Additional information is reported in the table. B, total proteins prepared from SHEP-UNR, SHEP–empty vector (E.V.), and SHEP-D treated with DOX for different times (0 h, 6 h, and 12 h) were subjected to Western blotting with anti-TGM2 and ABCF2 antibodies. α-Tubulin was used as the loading control. C, expression levels of LYAR, CTCF, ALG13, and TIMM13 decreased upon DOX treatment in SH-SY5Y-4 relative to SH-SY5Y-E.V. and SH-SY5Y-UNR. α-Tubulin was used as the loading control.
Given that the most important feature in assessing the validity of our results was a protein half-life shorter than our experimental sampling point, we analyzed protein half-lives in our cellular models. As expected, all proteins evaluated here had a half-life of less than 3 h (supplemental Figs. S5A and S5B), well below our earliest proteome sampling time of 6 h of miR-34a expression. To further validate the mass spectrometry results, we performed Western blotting and observed down-regulation of TGM2 and ABCF2 in SHEP-D cells upon 12 h of DOX stimulation (Fig. 5B) and down-regulation of LYAR, CTCF, TIMM13, and ALG13 in SH-SY5Y-4 cells (Fig. 5C).
Taken together, our data demonstrate that miR-34a, when ectopically expressed in NBL cells, negatively regulates additional genes/proteins that are correlated with poor prognosis when overexpressed in NBL.
MiR-34a Regulates a Complex Network of Genes That Are Involved in Signal Transduction
We next analyzed the signaling pathways that are possibly affected by miR-34a. Protein network interactions among the proteins identified above were evaluated using Cytoscape (43). The construction of a potential “interactome” was achieved by query of LYAR, CTCF, ALG13, ABCF2, TIMM13, Ki67, and TGM2 to those reported protein–protein interaction annotated databases within the Michigan Molecular Interaction database (44). The Michigan Molecular Interaction plugin allows one to query for interactions by finding nearest neighbor proteins. Out of the seven proteins evaluated, five were linked to components of molecular signaling cascades (LYAR, TGM2, CTCF, TIMM13, and MKI67). These proteins are mainly involved in cancer progression and pathways including focal adhesion kinase (FAK) signaling, the transforming growth factor β (TGF-β) pathway (45), the MAPK activity signaling pathway, and the Wnt activation pathway (Fig. 6A).
Fig. 6.

A, interactome of LYAR, TGM2, CTCF, TIMM13, and MKi67 obtained using the MiMI plug-in of the Cytoscape program. B, C, total protein extracts prepared from UNR, empty vector (E.V.), or -miR-34a of both SHEP (B) and SH-SY5Y (C) cell clones, treated or not with DOX for 6 h and then subjected to Western blotting to evaluate Wnt, TGF-β, and FAK pathway activity. β-Actin and α-tubulin were used as loading controls, and in relative protein densitometric analysis, each value was expressed as fold-stimulation over the unstimulated cells (t0). D, attachment of SH-SY5Y and SHEP cell empty vector (E.V.) or miR-34a overexpressing cells on fibronectin and collagen I. Cells were treated or not with DOX for 3 h and then plated on wells uncoated or coated with fibronectin or collagen I. Results are shown as the percentage of adherent cells with respect to adherent empty vector cells. *p > 0.005, **p > 0.005, and ***p > 0.0005.
To validate these findings, we performed dual luciferase reporter assays. These allowed us to determine whether the mRNAs of the proteins that are significantly overexpressed in patients with worse outcomes and down-regulated by miR-34a in the SHEP-D and SH-SY5Y-4 clones are direct targets of miR-34a. Four of five genes (CTCF, LYAR, TGM2, and TIMM13) were significantly repressed when co-transfected with miR-34a, whereas a control clone using miR-scrambled had no effect on the luciferase reporter when co-transfected (supplemental Fig. S6A). This indicates that there was good correlation between the protein and mRNA levels in our miR-34a-induced cellular models, and it further supports our scheme as additional evidence of these bona fide analyses in this search for new candidates of NBL through the combination of proteomic analysis in these representative tumorigenic cells and gene-expression data in patient cohorts.
Proteome studies and luciferase assays did not allow the determination of the contributions of mRNA destabilization and translational repression upon miRNA-34a expression. Although some targets were repressed without detectable changes in mRNA levels (<33%), generally the mechanism for target repression was mRNA destabilization (46). Therefore, we examined whether miR-34a affected the mRNA stability of our newly identified targets. To achieve this, we treated control and miR-34a inducible clones with actinomycin D, which impairs mRNA transcription (47), and then harvested the cells at different time points after DOX treatment. As shown in supplemental Fig. S6B, miR-34a expression enhanced the degradation of ABCF2, TGM2, LYAR, and CTCF mRNAs, whereas no effect on mRNA half-life was observed in KI67, ALG13, TIMM13, or VIMENTIN genes. This indicates that the latter transcripts are subjected to translational repression. Collectively, these findings suggest that miR-34a was equally able to both destabilize mRNAs and repress translational events of target molecules. These data are in agreement with those previously reported by Kaller et al. on the SW480 cellular human colorectal cancer cell model (33).
Many of the pathways mentioned above converge on common downstream effectors that are well-established links to cancer. To verify down-regulation of the Wnt pathway, we analyzed expression of activated β-catenin in both NBL cells upon miR-34a expression. As shown in Figs. 6B and 6C, active β-catenin expression was reduced after 6 h of miR-34a expression in both cell lines, indicating that miR-34a led to Wnt signaling down-regulation and confirming our predictions. We then analyzed the TGF-β pathway, known to regulate several cellular functions. After phosphorylation and activation of TβRI, the transcription factors receptor-activated Smad2 and Smad3 are recruited and activated through phosphorylation of C-terminus residues; this converts them into transcriptional regulators that complex with Smad4, which then moves to the nucleus to induce gene transcription. We found that miR-34a expression in SH-SY5Y-4 cells led to a significant decrease in Smad2 phosphorylation (Figs. 6B and 6C), indicating that miR-34a also impairs TGF-β signaling. We further analyzed FAK signaling, which is coordinated by large, integrin-containing multiprotein assemblies spanning the plasma membrane that link the cellular cytoskeleton to the extracellular matrix. FAK is a 125-kDa non-receptor tyrosine kinase that plays a major role in mediating signal transduction by integrins, as well as by growth factor receptors, and in regulating cell adhesion, migration, proliferation, and differentiation in a variety of cell types. FAK has also been implicated in regulating the expression of Snail, Zeb1, Zeb2, and Twist in fibroblasts (48), and the expression of these transcription factors is crucial for maintenance of the mesenchymal phenotype of murine fibroblasts, including suppression of E-cadherin gene expression. We found that the expression of both FAK and pFAK Tyr397 was suppressed upon miR-34a expression (Figs. 6B and 6C), which prompted us to investigate the adhesion capabilities of cells with increased miR-34a expression. As shown in Fig. 6D and supplemental Fig. S7D, if miR-34a was not ectopically expressed, the adhesion index increased significantly (p < 0.05); conversely, low levels of adhesion cellular abilities were evident in both cell lines (SHEP-D and SH-SY5Y-4).
Thus we have here comprehensively demonstrated the functional abilities of miR-34a to simultaneously target the components of known cancer signaling cascades that are responsible for tumor progression.
DISCUSSION
The identification of miRNA targets that are functionally important for tumor biology is crucial for understanding miRNA functions. By directly measuring changes in protein levels, one can obtain proteome data that are likely to be more relevant than microarray data on transcripts. Indeed, silencing by miRNA does not always show correlation between transcript and protein levels (49).
Here, we analyzed proteome changes in two different NBL cell lines: SHEP cells, which are highly substrate adherent and grow in monolayer cultures but do not form tumors in nude mice, and SH-SY5Y cells, which have small, rounded cell bodies with many lamellipodia and neurites extending from the soma and which are tumorigenic in nude mice. These phenotypes are signs of less aggressiveness in vivo for SHEP cells, due to their milder phenotype relative to SH-5YSY cells. The analyses presented here reveal new direct targets of miR-34a that presumably represent the mediators of its cumulative effects on cell behavior during its expression. Direct regulation by miR-34a was confirmed by reporter gene assays for selected miR-34a target mRNAs, which showed that miR-34a-mediated repression did not necessarily require the presence of seed-matching sequences in the respective 3′-UTRs. Among the detected proteins, 186 were significantly regulated, with 112 proteins being down-regulated and 74 up-regulated upon miR-34a expression. Among the down-regulated proteins, we noted several proteins involved in apoptosis, cell motility, cell division, and metabolic processing. Some of these proteins do not contain predicted miR-34a binding sites in the 3′-UTRs of their mRNAs. Although we used a seed-driven approach to predict putative targets, miR-mediated down-regulation is not necessarily constrained to this rule (14, 15, 50, 51). MiRs are potentially targeted to other regions of the mRNA, such as CDS or the 5′-UTR. This could be the case for COL1A1 regulation as discussed above; future studies should address this specific control of expression by miR-34a.
We then identified several early targets of miR-34a (Table I) and, among these, seven proteins (LYAR, CTCF, TGM2, Ki67, TIMM13, ALG13, and ABCF2) having prognostic relevance in NBL.
LYAR, a nucleolar protein, encodes a polypeptide consisting of 388 amino acids with a zinc finger motif and three copies of nuclear localization signals. Literature data show that LYAR cDNA overexpression in NIH-3T3 fibroblast cells changes their phenotype to a more tumorigenic one, indicating that LYAR is a novel nucleolar protein that can be involved in cell growth regulation (52). Recently, microarray data showed that LYAR is highly expressed in undifferentiated human ES cells and significantly down-regulated upon differentiation (53). Thus, LYAR appears to be a likely player in controlling the self-renewal of ES cells. Li and colleagues (54) demonstrated that LYAR down-regulation significantly reduces the growth rate of ES cells and increases apoptosis. Moreover, reduced expression of LYAR in ES cells impairs their differentiation capacity, failing to rapidly silence pluripotency markers and activate differentiation genes upon differentiation. Future studies will be needed to assess the relevant function of LYAR in NBL tumor cell biology.
We also identified CTCF, which encodes a highly conserved zinc-finger protein implicated in multiple regulatory functions, including transcriptional activation/repression, insulation, imprinting, and X chromosome inactivation. Various studies have shown that CTCF is involved in cell cycle arrest, apoptosis, and differentiation, indicating that it is a potential tumor-suppressor factor. Other studies, however, found that CTCF protein levels are elevated in both breast and lung tumoral cell lines (55, 56) and are also associated with apoptosis resistance (55). These controversial results can be explained by the role of CTCF as a differentiation-inducing factor, involving a variety of signaling pathways depending on its cellular context (57–59).
TGM2 (TG2) encodes the tissue transglutaminase, known to be an important member of the transglutaminase family of enzymes that catalyze Ca2+-dependent post-translational modification of proteins. Involvement of TG2 in apoptosis has been well established, and its overexpression either results in spontaneous apoptosis of cells or renders cells highly sensitive to apoptosis-inducing agents. In contrast, recent evidence indicates that increased expression of TG2 may prolong cell survival by preventing apoptosis (60). TG2 expression is additionally up-regulated in drug-resistant and metastatic cancer cells and plays a role in the constitutive activation of NF-κB signaling. Increased expression of TG2 contributes to increased survival, invasion, and motility of breast cancer (61) and colorectal cancer cells (62). Finally, a recent study demonstrated that TGF-β-induced TG2 enhances ovarian tumor metastasis by inducing epithelial mesenchymal transition and a cancer stem cell phenotype (63).
ABCF2 encodes a member of the ATP binding cassette transporter family. These act as efflux pumps and are related to chemoresistance. ABCF2 has a chromosome gain at 7q 34–36. ABCF2 overexpression was found in a chemoresistant clear-cell ovarian carcinoma and it was suggested that ABCF2 might contribute to the chemoresistant phenotype in other tumors as well (64). Moreover, the ABCF2 protein might be a prognostic marker for clear-cell ovarian adenocarcinoma (65). As shown in Fig. 5A, gene expression data revealed that ABCF2 was highly expressed in advanced stages of NBL (p = 1.9e-03).
Antigen Ki67 is a nuclear protein that is strictly associated with, and might be necessary for, cellular proliferation. It was recently reported that Ki67 might be suitable for inclusion in the routine clinical screening of breast cancer (66). Ki67 was found to be overexpressed in NBL tissues relative to normal adrenal glands (p = 9.0e-11), as shown in Fig. 5A. Interestingly, in an NBL cohort, patients with loss of heterozygosity for the chromosomal region 1p36 had high expression of Ki67 relative to patients without this deletion (supplemental Fig. S5C) (p = 2.4e-03). These findings further support the notion that Ki67 is regulated by miR-34a.
We additionally found TIMM13, which encodes a member of the “small Tim protein” family. Together with Tim8, Timm13 forms a soluble hexameric 70-kDa complex that is present in the intermembrane space of mitochondria (67). This complex is involved in the import of a number of inner membrane proteins. Timm13 is a translocase involved in the import of metabolite transporters from the cytoplasm into the mitochondrial inner membrane.
Finally, we identified ALG13, the subunit of a bipartite UDP-N-acetylglucosamine transferase. It heterodimerizes with asparagine-linked glycosylation 14 homolog to form a functional UDP-GlcNAc glycosyltransferase that catalyzes the second sugar addition of the highly conserved oligosaccharide precursor in endoplasmic reticulum N-linked glycosylation. Along with Ki67, Alg13 is highly expressed in patients with 1p36 loss (p = 1.1e-03) (supplemental Fig. S5C) in tumors where there is a loss of the miR-34a genetic locus.
Further, several of these new miR-34a targets, LYAR, CTCF, TGM2, Ki67, and TIMM13, are predicted to be linked to one another and converge on important pathways that are involved in tumor progression, such as the Wnt, TGF-β, FAK, and MAPK pathways (Fig. 6).
Canonical Wnt signaling controls events ranging from cell fate determination and cell cycle regulation to cell motility and metabolism. In addition to the importance of the canonical Wnt pathway in normal cell function, pathologic increases in Wnt signaling are frequently implicated in neoplastic states. The importance of Wnt signaling in human cancer is highlighted by its coordinate control of the transcriptional programs underlying epithelial mesenchymal transition, cancer stem cell generation, and cancer progression. WNT1 has previously been report to be a direct target of miR-34a (68), supporting the present demonstration that miR-34a suppressed oncogenic Wnt signaling.
We also found alterations to TGF-β signaling, which is already known to be involved in signaling that controls a wide range of cellular processes, including cell proliferation, recognition, differentiation, and apoptosis, and the specification of developmental fate during embryogenesis and in mature tissues in species ranging from flies and worms to mammals (45, 69, 70). TGF-β suppresses early-stage tumor development through its potent growth-inhibitory effects, but it is also a pro-oncogenic factor that stimulates tumor cell growth and invasiveness at later stages of tumorigenesis (71, 72). Pathological forms of TGF-β signaling promote tumor growth and invasion, evasion of immune surveillance, and cancer-cell dissemination and metastasis. Moreover, a recent study demonstrated that miR-34a can target genes encoding multiple TGF-β isoforms (34). The inhibition of these pathways by miR-34a has been confirmed in the literature and by data obtained in our laboratory (73, 74).
An additional key finding is the alteration identified at early times of pre-miR-34a expression for FAK, which is an important mediator of growth factor signaling and cell proliferation, survival, and migration. In the cancer context, the synergistic signaling between growth factor receptors and FAK might be particularly relevant in the control of the altered growth of tumor cells, as well as in their responses to autocrine and paracrine factors. In addition, through diverse molecular interactions, FAK influences the dynamic regulation of integrin-associated adhesions and the actin cytoskeleton, which is tethered at the trailing edge (75). One potential question raised at this time is how to explain why not all targets were similarly down-regulated in the two NBL cellular models. Two explanations can be offered; the first is intrinsic biological cell differences and the second is the limitation of the proteomics technique. Also, we should take into consideration the fact that the reproducibility of sampling is not always 100% in all the experiments performed (due to “undersampling”). Another possibility would be related to different levels of target and protein half-life in the two cell lines used. Additionally, by comparing data from several proteomic analyses using the overexpression of miR-34a, we were able to observe a list of similar down-regulated targets and, most important, other new targets were identified that seemed to be specific to those cellular models analyzed (see supplemental Table S6).
Another important corollary of our proteome analysis is the demonstration that the miR-34a effects on the proteome occur at early times. In vitro studies have already shown that miRNAs can induce translational inhibition in a very short time frame (76). Therefore, the effects of miR-34a on the proteome were investigated in a time-dependent manner. Our data demonstrated that pre-miR-34a expression resulted in protein changes already observed at 6 h of expression. We found 20 and 56 down-regulated proteins in the SHEP-D and SH-SY5Y-4 clones, respectively. Some of these proteins have seed sequence sites in the 3′-UTRs of their transcripts, which could explain why these early down-regulation processes are occurring upon miR34a expression.
There were also a number of repressed proteins that did not show seed sequence sites. This implies that these proteins are probably indirect targets of miR-34a or could be subject to secondary effects that follow the direct miR-34a-mediated repression of other proteins that act upstream, which in turn regulate their expression.
Another explanation for this phenomenon might be that they are indirectly regulated by miR-34a and because of their short half-life we observed their down-regulation in a short time frame. It is also worth noting that our data further show the kinetics of miR-34a regulation. Here we analyzed the effects of miR-34a on the proteome in a time-dependent manner, allowing us to obtain a global picture of the miR-34a functions.
Recently, in vivo studies showed that tumor growth is significantly repressed after exogenous miR-34a administration in retroperitoneal NBL tumors (39). Identification of miR-34a is a highly significant finding with respect to the development of potential therapeutics for NBL. Current therapies for high-risk NBL include chemotherapy and radiotherapy, which attempt to hinder tumor relapse.
The emerging data from the present study provide a unifying principle that will lead to improvements in cancer therapy using ectopic miR-34a expression, which might also serve as a tumor therapeutic for human tumors in the future. Comprehensive knowledge of the targets and effects of miR-34a is also of relevance to the evaluation of the potential side effects of such therapies.
CONCLUSIONS
The role of miRNAs in mediating critical cellular processes is an emerging field in cancer genetics. Dysregulation, enhanced expression, and selective inhibition of miRNAs have improved the scientific understanding of the functional roles of these regulatory molecules in determining cancer progression and patient prognosis. MiR-34a was the first miRNA identified as a putative tumor suppressor in NBL, through its direct targeting of transcription factors and other genes essential for cell proliferation. Here, we have identified new early targets of miR-34a, adding an important step to our understanding of the mechanisms of action of miR-34a. Although miRNAs are largely known to repressively regulate protein expression, it has been reported that some miRNAs can also up-regulate translation (77). In the present study, we focused on the repressive gene regulation of miR-34a as a result of its binding to the 3′-UTR of target genes, although many up-regulated proteins have also been detected in quantitative bottom-up proteomics analysis. These data were further confirmed by wet-bench analyses of effects in the cell context, as related to cell proliferation, apoptosis, and the initiation of cellular adhesion processes. Further studies will be needed to determine mechanistically how miR-34a can up-regulate some proteins.
In conclusion, in the present study, our efforts were oriented toward not only the identification of new targets of miR-34a in NBL, but also the molecular principles that govern early events in the kinetics of gene regulation by miRNAs.
Supplementary Material
Acknowledgments
We thank Prof. Luigi Del Vecchio, the Cell Sorter, and the Sequencing facilities at CEINGE. We also thank De Pasquale Valeria for laboratory assistance.
Footnotes
Author contributions: P.d.A., M.C., P.M., J. Vandesompele, K.G., and M.Z. designed research; P.d.A., M.C., J. Vandenbussche, G.D., V.F., C.M., I.B., A.G., S.D., D.M., N.A., A.A., D.S., L.L., A.V., and C.C. performed research; J.H.S. and M.Z. contributed new reagents or analytic tools; P.d.A., M.C., J. Vandenbussche, K.G., and M.Z. analyzed data; P.d.A., M.C., K.G., and M.Z. wrote the paper.
* This study was financially supported by Associazione Italiana per la ricerca sul Cancro AIRC (MZ), Fondazione italiana per la lotta al Neuroblastoma (MZ), and PRIME-XS (Grant No. 262067, funded by the European Union 7th Framework Program). (VF) European School of Molecular Medicine (SEMM).
 This article contains supplemental material.
1 The abbreviations used are:
- NBL
- neuroblastoma
- UTR
- untranslated region
- UNR
- sequence-unrelated control
- DOX
- doxycycline
- FAK
- focal adhesion kinase
- TGF-β
- transforming growth factor β.
REFERENCES
- 1. Schwab M., Westermann F., Hero B., Berthold F. (2003) Neuroblastoma: biology and molecular and chromosomal pathology. Lancet Oncol. 4, 472–480 [DOI] [PubMed] [Google Scholar]
- 2. Brodeur G. M. (2003) Neuroblastoma: biological insights into a clinical enigma. Nat. Rev. Cancer 3, 203–216 [DOI] [PubMed] [Google Scholar]
- 3. Cohn S. L., Pearson A. D., London W. B., Monclair T., Ambros P. F., Brodeur G. M., Faldum A., Hero B., Iehara T., Machin D., Mosseri V., Simon T., Garaventa A., Castel V., Matthay K. K., Force I. T. (2009) The International Neuroblastoma Risk Group (INRG) classification system: an INRG Task Force report. J. Clin. Oncol. 27, 289–297 [DOI] [PMC free article] [PubMed] [Google Scholar]
- 4. Monclair T., Brodeur G. M., Ambros P. F., Brisse H. J., Cecchetto G., Holmes K., Kaneko M., London W. B., Matthay K. K., Nuchtern J. G., von Schweinitz D., Simon T., Cohn S. L., Pearson A. D., Force I. T. (2009) The International Neuroblastoma Risk Group (INRG) staging system: an INRG Task Force report. J. Clin. Oncol. 27, 298–303 [DOI] [PMC free article] [PubMed] [Google Scholar]
- 5. Ambros P. F., Ambros I. M., Brodeur G. M., Haber M., Khan J., Nakagawara A., Schleiermacher G., Speleman F., Spitz R., London W. B., Cohn S. L., Pearson A. D., Maris J. M. (2009) International consensus for neuroblastoma molecular diagnostics: report from the International Neuroblastoma Risk Group (INRG) Biology Committee. Br. J. Cancer 100, 1471–1482 [DOI] [PMC free article] [PubMed] [Google Scholar]
- 6. Bagatell R., Rumcheva P., London W. B., Cohn S. L., Look A. T., Brodeur G. M., Frantz C., Joshi V., Thorner P., Rao P. V., Castleberry R., Bowman L. C. (2005) Outcomes of children with intermediate-risk neuroblastoma after treatment stratified by MYCN status and tumor cell ploidy. J. Clin. Oncol. 23, 8819–8827 [DOI] [PubMed] [Google Scholar]
- 7. George R. E., London W. B., Cohn S. L., Maris J. M., Kretschmar C., Diller L., Brodeur G. M., Castleberry R. P., Look A. T. (2005) Hyperdiploidy plus nonamplified MYCN confers a favorable prognosis in children 12 to 18 months old with disseminated neuroblastoma: a Pediatric Oncology Group study. J. Clin. Oncol. 23, 6466–6473 [DOI] [PubMed] [Google Scholar]
- 8. Look A. T., Hayes F. A., Shuster J. J., Douglass E. C., Castleberry R. P., Bowman L. C., Smith E. I., Brodeur G. M. (1991) Clinical relevance of tumor cell ploidy and N-myc gene amplification in childhood neuroblastoma: a Pediatric Oncology Group study. J. Clin. Oncol. 9, 581–591 [DOI] [PubMed] [Google Scholar]
- 9. Weiss W. A., Aldape K., Mohapatra G., Feuerstein B. G., Bishop J. M. (1997) Targeted expression of MYCN causes neuroblastoma in transgenic mice. EMBO J. 16, 2985–2995 [DOI] [PMC free article] [PubMed] [Google Scholar]
- 10. Brodeur G. M., Seeger R. C., Schwab M., Varmus H. E., Bishop J. M. (1984) Amplification of N-myc in untreated human neuroblastomas correlates with advanced disease stage. Science 224, 1121–1124 [DOI] [PubMed] [Google Scholar]
- 11. Seeger R. C., Brodeur G. M., Sather H., Dalton A., Siegel S. E., Wong K. Y., Hammond D. (1985) Association of multiple copies of the N-myc oncogene with rapid progression of neuroblastomas. N. Engl. J. Med. 313, 1111–1116 [DOI] [PubMed] [Google Scholar]
- 12. Westermann F., Muth D., Benner A., Bauer T., Henrich K. O., Oberthuer A., Brors B., Beissbarth T., Vandesompele J., Pattyn F., Hero B., Konig R., Fischer M., Schwab M. (2008) Distinct transcriptional MYCN/c-MYC activities are associated with spontaneous regression or malignant progression in neuroblastomas. Genome Biol. 9, R150. [DOI] [PMC free article] [PubMed] [Google Scholar]
- 13. Ebner O. A., Selbach M. (2014) Quantitative proteomic analysis of gene regulation by miR-34a and miR-34c. PLoS One 9, e92166. [DOI] [PMC free article] [PubMed] [Google Scholar]
- 14. Shin C., Nam J. W., Farh K. K., Chiang H. R., Shkumatava A., Bartel D. P. (2010) Expanding the microRNA targeting code: functional sites with centered pairing. Mol. Cell 38, 789–802 [DOI] [PMC free article] [PubMed] [Google Scholar]
- 15. Lee I., Ajay S. S., Yook J. I., Kim H. S., Hong S. H., Kim N. H., Dhanasekaran S. M., Chinnaiyan A. M., Athey B. D. (2009) New class of microRNA targets containing simultaneous 5′-UTR and 3′-UTR interaction sites. Genome Res. 19, 1175–1183 [DOI] [PMC free article] [PubMed] [Google Scholar]
- 16. Valencia-Sanchez M. A., Liu J., Hannon G. J., Parker R. (2006) Control of translation and mRNA degradation by miRNAs and siRNAs. Genes Dev. 20, 515–524 [DOI] [PubMed] [Google Scholar]
- 17. Cech T. R., Steitz J. A. (2014) The noncoding RNA revolution—trashing old rules to forge new ones. Cell 157, 77–94 [DOI] [PubMed] [Google Scholar]
- 18. Lodygin D., Tarasov V., Epanchintsev A., Berking C., Knyazeva T., Korner H., Knyazev P., Diebold J., Hermeking H. (2008) Inactivation of miR-34a by aberrant CpG methylation in multiple types of cancer. Cell Cycle 7, 2591–2600 [DOI] [PubMed] [Google Scholar]
- 19. Raver-Shapira N., Marciano E., Meiri E., Spector Y., Rosenfeld N., Moskovits N., Bentwich Z., Oren M. (2007) Transcriptional activation of miR-34a contributes to p53-mediated apoptosis. Mol. Cell 26, 731–743 [DOI] [PubMed] [Google Scholar]
- 20. Ji Q., Hao X., Zhang M., Tang W., Yang M., Li L., Xiang D., Desano J. T., Bommer G. T., Fan D., Fearon E. R., Lawrence T. S., Xu L. (2009) MicroRNA miR-34 inhibits human pancreatic cancer tumor-initiating cells. PLoS One 4, e6816. [DOI] [PMC free article] [PubMed] [Google Scholar]
- 21. Liu C., Kelnar K., Liu B., Chen X., Calhoun-Davis T., Li H., Patrawala L., Yan H., Jeter C., Honorio S., Wiggins J. F., Bader A. G., Fagin R., Brown D., Tang D. G. (2011) The microRNA miR-34a inhibits prostate cancer stem cells and metastasis by directly repressing CD44. Nat. Med. 17, 211–215 [DOI] [PMC free article] [PubMed] [Google Scholar]
- 22. Guessous F., Zhang Y., Kofman A., Catania A., Li Y., Schiff D., Purow B., Abounader R. (2010) microRNA-34a is tumor suppressive in brain tumors and glioma stem cells. Cell Cycle 9, 1031–1036 [DOI] [PMC free article] [PubMed] [Google Scholar]
- 23. Yamakuchi M., Ferlito M., Lowenstein C. J. (2008) miR-34a repression of SIRT1 regulates apoptosis. Proc. Natl. Acad. Sci. U.S.A. 105, 13421–13426 [DOI] [PMC free article] [PubMed] [Google Scholar]
- 24. Welch C., Chen Y., Stallings R. L. (2007) MicroRNA-34a functions as a potential tumor suppressor by inducing apoptosis in neuroblastoma cells. Oncogene 26, 5017–5022 [DOI] [PubMed] [Google Scholar]
- 25. Sun F., Fu H., Liu Q., Tie Y., Zhu J., Xing R., Sun Z., Zheng X. (2008) Downregulation of CCND1 and CDK6 by miR-34a induces cell cycle arrest. FEBS Lett. 582, 1564–1568 [DOI] [PubMed] [Google Scholar]
- 26. Ghesquiere B., Jonckheere V., Colaert N., Van Durme J., Timmerman E., Goethals M., Schymkowitz J., Rousseau F., Vandekerckhove J., Gevaert K. (2011) Redox proteomics of protein-bound methionine oxidation. Mol. Cell. Proteomics 10, M110.006866. [DOI] [PMC free article] [PubMed] [Google Scholar]
- 27. Staes A., Impens F., Van Damme P., Ruttens B., Goethals M., Demol H., Timmerman E., Vandekerckhove J., Gevaert K. (2011) Selecting protein N-terminal peptides by combined fractional diagonal chromatography. Nat. Protoc. 6, 1130–1141 [DOI] [PubMed] [Google Scholar]
- 28. Perkins D. N., Pappin D. J., Creasy D. M., Cottrell J. S. (1999) Probability-based protein identification by searching sequence databases using mass spectrometry data. Electrophoresis 20, 3551–3567 [DOI] [PubMed] [Google Scholar]
- 29. Helsens K., Colaert N., Barsnes H., Muth T., Flikka K., Staes A., Timmerman E., Wortelkamp S., Sickmann A., Vandekerckhove J., Gevaert K., Martens L. (2010) ms lims, a simple yet powerful open source laboratory information management system for MS-driven proteomics. Proteomics 10, 1261–1264 [DOI] [PubMed] [Google Scholar]
- 30. Martens L., Hermjakob H., Jones P., Adamski M., Taylor C., States D., Gevaert K., Vandekerckhove J., Apweiler R. (2005) PRIDE: the proteomics identifications database. Proteomics 5, 3537–3545 [DOI] [PubMed] [Google Scholar]
- 31. Barsnes H., Vizcaino J. A., Eidhammer I., Martens L. (2009) PRIDE Converter: making proteomics data-sharing easy. Nat. Biotechnol. 27, 598–599 [DOI] [PubMed] [Google Scholar]
- 32. Hermeking H. (2010) The miR-34 family in cancer and apoptosis. Cell Death Differ. 17, 193–199 [DOI] [PubMed] [Google Scholar]
- 33. Kaller M., Liffers S. T., Oeljeklaus S., Kuhlmann K., Roh S., Hoffmann R., Warscheid B., Hermeking H. (2011) Genome-wide characterization of miR-34a induced changes in protein and mRNA expression by a combined pulsed SILAC and microarray analysis. Mol. Cell. Proteomics 10, M111.010462. [DOI] [PMC free article] [PubMed] [Google Scholar]
- 34. Lal A., Thomas M. P., Altschuler G., Navarro F., O'Day E., Li X. L., Concepcion C., Han Y. C., Thiery J., Rajani D. K., Deutsch A., Hofmann O., Ventura A., Hide W., Lieberman J. (2011) Capture of microRNA-bound mRNAs identifies the tumor suppressor miR-34a as a regulator of growth factor signaling. PLoS Genet. 7, e1002363. [DOI] [PMC free article] [PubMed] [Google Scholar]
- 35. Biedler J. L., Roffler-Tarlov S., Schachner M., Freedman L. S. (1978) Multiple neurotransmitter synthesis by human neuroblastoma cell lines and clones. Cancer Res. 38, 3751–3757 [PubMed] [Google Scholar]
- 36. Tsai N. P., Lin Y. L., Wei L. N. (2009) MicroRNA mir-346 targets the 5′-untranslated region of receptor-interacting protein 140 (RIP140) mRNA and up-regulates its protein expression. Biochem. J. 424, 411–418 [DOI] [PubMed] [Google Scholar]
- 37. de Antonellis P., Medaglia C., Cusanelli E., Andolfo I., Liguori L., De Vita G., Carotenuto M., Bello A., Formiggini F., Galeone A., De Rosa G., Virgilio A., Scognamiglio I., Sciro M., Basso G., Schulte J. H., Cinalli G., Iolascon A., Zollo M. (2011) MiR-34a targeting of Notch ligand delta-like 1 impairs CD15+/CD133+ tumor-propagating cells and supports neural differentiation in medulloblastoma. PLoS One 6, e24584. [DOI] [PMC free article] [PubMed] [Google Scholar]
- 38. Tivnan A., Orr W. S., Gubala V., Nooney R., Williams D. E., McDonagh C., Prenter S., Harvey H., Domingo-Fernandez R., Bray I. M., Piskareva O., Ng C. Y., Lode H. N., Davidoff A. M., Stallings R. L. (2012) Inhibition of neuroblastoma tumor growth by targeted delivery of microRNA-34a using anti-disialoganglioside GD2 coated nanoparticles. PLoS One 7, e38129. [DOI] [PMC free article] [PubMed] [Google Scholar]
- 39. Tivnan A., Tracey L., Buckley P. G., Alcock L. C., Davidoff A. M., Stallings R. L. (2011) MicroRNA-34a is a potent tumor suppressor molecule in vivo in neuroblastoma. BMC Cancer 11, 33. [DOI] [PMC free article] [PubMed] [Google Scholar]
- 40. Cole K. A., Attiyeh E. F., Mosse Y. P., Laquaglia M. J., Diskin S. J., Brodeur G. M., Maris J. M. (2008) A functional screen identifies miR-34a as a candidate neuroblastoma tumor suppressor gene. Mol. Cancer Res. 6, 735–742 [DOI] [PMC free article] [PubMed] [Google Scholar]
- 41. Wei J. S., Song Y. K., Durinck S., Chen Q. R., Cheuk A. T., Tsang P., Zhang Q., Thiele C. J., Slack A., Shohet J., Khan J. (2008) The MYCN oncogene is a direct target of miR-34a. Oncogene 27, 5204–5213 [DOI] [PMC free article] [PubMed] [Google Scholar]
- 42. Kertesz M., Iovino N., Unnerstall U., Gaul U., Segal E. (2007) The role of site accessibility in microRNA target recognition. Nat. Genet. 39, 1278–1284 [DOI] [PubMed] [Google Scholar]
- 43. Shannon P., Markiel A., Ozier O., Baliga N. S., Wang J. T., Ramage D., Amin N., Schwikowski B., Ideker T. (2003) Cytoscape: a software environment for integrated models of biomolecular interaction networks. Genome Res. 13, 2498–2504 [DOI] [PMC free article] [PubMed] [Google Scholar]
- 44. Gao J., Ade A. S., Tarcea V. G., Weymouth T. E., Mirel B. R., Jagadish H. V., States D. J. (2009) Integrating and annotating the interactome using the MiMI plugin for cytoscape. Bioinformatics 25, 137–138 [DOI] [PMC free article] [PubMed] [Google Scholar]
- 45. Massague J. (2000) How cells read TGF-beta signals. Nat. Rev. Mol. Cell Biol. 1, 169–178 [DOI] [PubMed] [Google Scholar]
- 46. Baek D., Villen J., Shin C., Camargo F. D., Gygi S. P., Bartel D. P. (2008) The impact of microRNAs on protein output. Nature 455, 64–71 [DOI] [PMC free article] [PubMed] [Google Scholar]
- 47. Gamez B., Rodriguez-Carballo E., Bartrons R., Rosa J. L., Ventura F. (2013) MicroRNA-322 (miR-322) and its target protein Tob2 modulate Osterix (Osx) mRNA stability. J. Biol. Chem. 288, 14264–14275 [DOI] [PMC free article] [PubMed] [Google Scholar]
- 48. Li X. Y., Zhou X., Rowe R. G., Hu Y., Schlaepfer D. D., Ilic D., Dressler G., Park A., Guan J. L., Weiss S. J. (2011) Snail1 controls epithelial-mesenchymal lineage commitment in focal adhesion kinase-null embryonic cells. J. Cell Biol. 195, 729–738 [DOI] [PMC free article] [PubMed] [Google Scholar]
- 49. Bartel D. P. (2004) MicroRNAs: genomics, biogenesis, mechanism, and function. Cell 116, 281–297 [DOI] [PubMed] [Google Scholar]
- 50. Chi S. W., Hannon G. J., Darnell R. B. (2012) An alternative mode of microRNA target recognition. Nat. Struct. Mol. Biol. 19, 321–327 [DOI] [PMC free article] [PubMed] [Google Scholar]
- 51. Hausser J., Syed A. P., Bilen B., Zavolan M. (2013) Analysis of CDS-located miRNA target sites suggests that they can effectively inhibit translation. Genome Res. 23, 604–615 [DOI] [PMC free article] [PubMed] [Google Scholar]
- 52. Su L., Hershberger R. J., Weissman I. L. (1993) LYAR, a novel nucleolar protein with zinc finger DNA-binding motifs, is involved in cell growth regulation. Genes Dev. 7, 735–748 [DOI] [PubMed] [Google Scholar]
- 53. Cai J., Chen J., Liu Y., Miura T., Luo Y., Loring J. F., Freed W. J., Rao M. S., Zeng X. (2006) Assessing self-renewal and differentiation in human embryonic stem cell lines. Stem Cells 24, 516–530 [DOI] [PMC free article] [PubMed] [Google Scholar]
- 54. Li H., Wang B., Yang A., Lu R., Wang W., Zhou Y., Shi G., Kwon S. W., Zhao Y., Jin Y. (2009) Ly-1 antibody reactive clone is an important nucleolar protein for control of self-renewal and differentiation in embryonic stem cells. Stem Cells 27, 1244–1254 [DOI] [PubMed] [Google Scholar]
- 55. Docquier F., Farrar D., D'Arcy V., Chernukhin I., Robinson A. F., Loukinov D., Vatolin S., Pack S., Mackay A., Harris R. A., Dorricott H., O'Hare M. J., Lobanenkov V., Klenova E. (2005) Heightened expression of CTCF in breast cancer cells is associated with resistance to apoptosis. Cancer Res. 65, 5112–5122 [DOI] [PubMed] [Google Scholar]
- 56. Fiorentino F. P., Macaluso M., Miranda F., Montanari M., Russo A., Bagella L., Giordano A. (2011) CTCF and BORIS regulate Rb2/p130 gene transcription: a novel mechanism and a new paradigm for understanding the biology of lung cancer. Mol. Cancer Res. 9, 225–233 [DOI] [PubMed] [Google Scholar]
- 57. Torrano V., Chernukhin I., Docquier F., D'Arcy V., Leon J., Klenova E., Delgado M. D. (2005) CTCF regulates growth and erythroid differentiation of human myeloid leukemia cells. J. Biol. Chem. 280, 28152–28161 [DOI] [PubMed] [Google Scholar]
- 58. Qi C. F., Martensson A., Mattioli M., Dalla-Favera R., Lobanenkov V. V., Morse H. C., 3rd (2003) CTCF functions as a critical regulator of cell-cycle arrest and death after ligation of the B cell receptor on immature B cells. Proc. Natl. Acad. Sci. U.S.A. 100, 633–638 [DOI] [PMC free article] [PubMed] [Google Scholar]
- 59. Heath H., Ribeiro de Almeida C., Sleutels F., Dingjan G., van de Nobelen S., Jonkers I., Ling K. W., Gribnau J., Renkawitz R., Grosveld F., Hendriks R. W., Galjart N. (2008) CTCF regulates cell cycle progression of alphabeta T cells in the thymus. EMBO J. 27, 2839–2850 [DOI] [PMC free article] [PubMed] [Google Scholar]
- 60. Mann A. P., Verma A., Sethi G., Manavathi B., Wang H., Fok J. Y., Kunnumakkara A. B., Kumar R., Aggarwal B. B., Mehta K. (2006) Overexpression of tissue transglutaminase leads to constitutive activation of nuclear factor-kappaB in cancer cells: delineation of a novel pathway. Cancer Res. 66, 8788–8795 [DOI] [PubMed] [Google Scholar]
- 61. Mangala L. S., Fok J. Y., Zorrilla-Calancha I. R., Verma A., Mehta K. (2007) Tissue transglutaminase expression promotes cell attachment, invasion and survival in breast cancer cells. Oncogene 26, 2459–2470 [DOI] [PubMed] [Google Scholar]
- 62. Miyoshi N., Ishii H., Mimori K., Tanaka F., Hitora T., Tei M., Sekimoto M., Doki Y., Mori M. (2010) TGM2 is a novel marker for prognosis and therapeutic target in colorectal cancer. Ann. Surg. Oncol. 17, 967–972 [DOI] [PubMed] [Google Scholar]
- 63. Cao L., Shao M., Schilder J., Guise T., Mohammad K. S., Matei D. (2012) Tissue transglutaminase links TGF-beta, epithelial to mesenchymal transition and a stem cell phenotype in ovarian cancer. Oncogene 31, 2521–2534 [DOI] [PubMed] [Google Scholar]
- 64. Ogawa Y., Tsuda H., Hai E., Tsuji N., Yamagata S., Tokunaga S., Nakazawa K., Tamamori Y., Ogawa M., Shimizu S., Inoue T., Nishiguchi Y. (2006) Clinical role of ABCF2 expression in breast cancer. Anticancer Res. 26, 1809–1814 [PubMed] [Google Scholar]
- 65. Tsuda H., Ito Y. M., Ohashi Y., Wong K. K., Hashiguchi Y., Welch W. R., Berkowitz R. S., Birrer M. J., Mok S. C. (2005) Identification of overexpression and amplification of ABCF2 in clear cell ovarian adenocarcinomas by cDNA microarray analyses. Clin. Cancer Res. 11, 6880–6888 [DOI] [PubMed] [Google Scholar]
- 66. Gong P., Wang Y., Liu G., Zhang J., Wang Z. (2013) New insight into ki67 expression at the invasive front in breast cancer. PLoS One 8, e54912. [DOI] [PMC free article] [PubMed] [Google Scholar]
- 67. Lutz T., Neupert W., Herrmann J. M. (2003) Import of small Tim proteins into the mitochondrial intermembrane space. EMBO J. 22, 4400–4408 [DOI] [PMC free article] [PubMed] [Google Scholar]
- 68. Hashimi S. T., Fulcher J. A., Chang M. H., Gov L., Wang S., Lee B. (2009) MicroRNA profiling identifies miR-34a and miR-21 and their target genes JAG1 and WNT1 in the coordinate regulation of dendritic cell differentiation. Blood 114, 404–414 [DOI] [PMC free article] [PubMed] [Google Scholar]
- 69. Patterson G. I., Padgett R. W. (2000) TGF beta-related pathways. Roles in Caenorhabditis elegans development. Trends Genet. 16, 27–33 [DOI] [PubMed] [Google Scholar]
- 70. Massague J., Blain S. W., Lo R. S. (2000) TGFbeta signaling in growth control, cancer, and heritable disorders. Cell 103, 295–309 [DOI] [PubMed] [Google Scholar]
- 71. Massague J. (2008) TGFbeta in Cancer. Cell 134, 215–230 [DOI] [PMC free article] [PubMed] [Google Scholar]
- 72. Javelaud D., Alexaki V. I., Mauviel A. (2008) Transforming growth factor-beta in cutaneous melanoma. Pigment Cell Melanoma Res. 21, 123–132 [DOI] [PubMed] [Google Scholar]
- 73. Yang P., Li Q. J., Feng Y., Zhang Y., Markowitz G. J., Ning S., Deng Y., Zhao J., Jiang S., Yuan Y., Wang H. Y., Cheng S. Q., Xie D., Wang X. F. (2012) TGF-beta-miR-34a-CCL22 signaling-induced Treg cell recruitment promotes venous metastases of HBV-positive hepatocellular carcinoma. Cancer Cell 22, 291–303 [DOI] [PMC free article] [PubMed] [Google Scholar]
- 74. Genovese G., Ergun A., Shukla S. A., Campos B., Hanna J., Ghosh P., Quayle S. N., Rai K., Colla S., Ying H., Wu C. J., Sarkar S., Xiao Y., Zhang J., Zhang H., Kwong L., Dunn K., Wiedemeyer W. R., Brennan C., Zheng H., Rimm D. L., Collins J. J., Chin L. (2012) microRNA regulatory network inference identifies miR-34a as a novel regulator of TGF-beta signaling in glioblastoma. Cancer Discovery 2, 736–749 [DOI] [PMC free article] [PubMed] [Google Scholar]
- 75. Carragher N. O., Frame M. C. (2004) Focal adhesion and actin dynamics: a place where kinases and proteases meet to promote invasion. Trends Cell Biol. 14, 241–249 [DOI] [PubMed] [Google Scholar]
- 76. Mathonnet G., Fabian M. R., Svitkin Y. V., Parsyan A., Huck L., Murata T., Biffo S., Merrick W. C., Darzynkiewicz E., Pillai R. S., Filipowicz W., Duchaine T. F., Sonenberg N. (2007) MicroRNA inhibition of translation initiation in vitro by targeting the cap-binding complex eIF4F. Science 317, 1764–1767 [DOI] [PubMed] [Google Scholar]
- 77. Vasudevan S., Tong Y., Steitz J. A. (2007) Switching from repression to activation: microRNAs can up-regulate translation. Science 318, 1931–1934 [DOI] [PubMed] [Google Scholar]
Associated Data
This section collects any data citations, data availability statements, or supplementary materials included in this article.