

Abstract
Uptake of administered D-glucose (Glc) or 2-deoxy-D-glucose (2DG) has been indirectly mapped through the chemical exchange (CE) between glucose hydroxyl and water protons using CE-dependent saturation transfer (glucoCEST) magnetic resonance imaging (MRI). We propose an alternative technique—on-resonance CE-sensitive spin-lock (CESL) MRI—to enhance responses to glucose changes. Phantom data and simulations suggest higher sensitivity for this ‘glucoCESL' technique (versus glucoCEST) in the intermediate CE regime relevant to glucose. Simulations of CESL signals also show insensitivity to B0-fluctuations. Several findings are apparent from in vivo glucoCESL studies of rat brain at 9.4 Tesla with intravenous injections. First, dose-dependent responses are nearly linearly for 0.25-, 0.5-, and 1-g/kg Glc administration (obtained with 12-second temporal resolution), with changes robustly detected for all doses. Second, responses at a matched dose of 1 g/kg are much larger and persist for a longer duration for 2DG versus Glc administration, and are minimal for mannitol as an osmolality control. And third, with similar increases in steady-state blood glucose levels, glucoCESL responses are ∼2.2 times higher for 2DG versus Glc, consistent with their different metabolic properties. Overall, we show that glucoCESL MRI could be a highly sensitive and quantifiable tool for glucose transport and metabolism studies.
Keywords: CEST, chemical exchange, deoxyglucose, glucose metabolism, glucose transport
Introduction
Glucose is the body's fuel; its uptake and metabolism are sensitive biomarkers of cellular dysfunction in afflictions such as cancer, stroke, Alzheimer's, and psychiatric diseases. Direct detection of glucose uptake in vivo has been established in human and animal studies by 13C and 1H nuclear magnetic resonance spectroscopy,1, 2, 3, 4 but low glucose concentrations severely limit sensitivity. Clinical positron emission tomography scans with radioisotope-labeled deoxyglucose detect altered metabolism, but radiation exposure limits the scan frequency and excludes certain patient groups. In addition, this procedure is expensive and has low spatial and temporal resolutions. Thus, development of magnetic resonance imaging (MRI) techniques sensitive to levels of nonradioactive glucose and its analogs is of crucial importance. Throughout this paper, we refer to glucose and its analogs simply by the term ‘glucose'.
Many key biomolecules can be indirectly detected via their chemical exchange (CE) with water. One MRI approach uses the CE saturation transfer (CEST) technique,5, 6, 7, 8, 9 where low-power, long-duration (several seconds) radiofrequency (RF) irradiation at the resonance frequency of labile protons (e.g., the hydroxyl protons in glucose) provides a magnetic label that is transferred to water protons by CE. This saturation transfer attenuates the bulk water signal, improving the detectability to labile protons. Recently, animal CEST MRI studies administering nonradioactive D-glucose (Glc) and 2-deoxy-D-glucose (2DG) have shown promising results for tumor detection and cell-line differentiation,10, 11, 12 and for assessment of glucose uptake and metabolism in normal brain.13 These encouraging studies indicate that ‘glucoCEST' has a wide range of applications; however, as will be shown below, technical challenges include relatively low sensitivity, susceptibility to B0 inhomogeneity and fluctuation, low temporal resolution, and difficulty in quantification. A main concern is that optimal CE contrast is obtained by CEST only when the exchange rate (k) between protons in water and those in the hydroxyl groups of glucose is much slower than their resonance frequency separation (δ)5, 14 (i.e., k/δ<<1); however, this condition is not satisfied under physiologic conditions where exchange between water and glucose hydroxyl protons is rapid, and their resonance frequencies are close.15 Therefore, high glucose doses are required for CEST detectability in normal brain.13
An alternative technique to indirectly map the CE of biomolecules with water utilizes on-resonance spin-lock (SL) MRI. This CE-sensitive SL (CESL) technique offers promise as a tool to enhance sensitivity to faster exchange processes (versus CEST).16, 17 We recently reported that CESL contrast is optimal for the intermediate CE regimes relevant to glucose (i.e., k/δ ∼1), and showed high glucose detection sensitivity in phantom studies.18 In addition, feline and human applications of SL functional MRI have shown high-temporal resolution, which can improve the detectability to glucose changes.19, 20 On-resonance SL signals are usually quantified by T1ρ, the spin-lattice relaxation time in the rotating frame. Although T1ρ has contributions from all CE and non-CE relaxation pathways, and thus lacks specificity to any particular type of labile protons, recent in vivo studies have shown that tissue T1ρ is insensitive to variations in blood flow, volume, and intravascular susceptibility;19, 21 this lack of chemical specificity (versus CEST) is alleviated in applications with glucose administration (referred to as ‘glucoCESL'), where the the signal response is expected to be dominated by elevated concentrations of glucose and its metabolic products.
In the current work, we methodically examined the feasibility of mapping brain glucose changes with CESL after intravenous injection of Glc or 2DG. Assessment included 9.4 T (Tesla) experiments and simulations incorporating SL frequency variation. Phantom experiments of biomolecular solutions characterized CESL for hydroxyl groups with different k values, and for varying pH, concentration, and water longitudinal (T1) and transverse (T2) relaxation times. Computer simulations of CESL versus CEST compared sensitivity features and investigated the dependence on B0 shifts. Three separate groups of in vivo rat-brain glucoCESL studies with high-temporal resolution were performed with intravenous injections. First, the dose dependence and detection threshold with our settings was determined for Glc. Next, glucoCESL responses were compared for matched doses of Glc, 2DG, and mannitol, and with measurement of arterial blood Glc and 2DG levels. The latter studies served to characterize dynamic properties and to assess ΔR1ρ contributions from changes in tissue water content after intravenous injection of hypertonic solutions; mannitol served as a control, since it induces large elevations in plasma osmolality, has a long half-life in blood (∼60 minutes in rats22), and does not cross the blood–brain barrier.23 And lastly, glucoCESL responses were obtained for varied SL power levels at steady-state blood glucose levels to further examine the origin and quantification of glucoCESL responses.
Materials and Methods
Theoretical Background
Although CEST and CESL each incorporate an RF preparation period to encode the exchange processes between water and labile protons, their labeling approaches are different. In the on-resonance CESL technique, water proton spins are excited (i.e., magnetization is flipped to the transverse plane) and then SL irradiation is applied at that same water resonance frequency. During the SL period, water protons exchange with labile protons (e.g., the hydroxyl groups of glucose). Water proton magnetization is then returned to the longitudinal plane, where the CE-reduced magnetization can be detected. The SL frequency in CESL is usually a few hundred Hertz (Hz) to effectively ‘lock' the water magnetization in the presence of B0 inhomogeneity, and this requires higher power (equivalent to an RF magnetic field strength B1 of ∼10 μT) versus CEST studies, where B1 is usually <2 μT. However, the on-resonance SL duration in CESL is usually comparable to water T2 (on the order of tens of milliseconds for in vivo studies), and this duration is much shorter than required for the off-resonance saturation of CEST, which should be comparable to water T1 (on the order of seconds). Thus, the specific absorption rate for CESL is often similar to that of CEST, and has already been applied to several human studies.20, 24
Signal intensity in CESL is determined by R1ρ (=1/T1ρ), the spin-lattice relaxation rate in the rotating frame, and R1ρ is obtained by varying the SL duration (TSL), and fitting the data to S=S0 · exp(-R1ρ · TSL), where S and S0 are signal intensities with and without SL irradiation, respectively. Assuming a two-pool exchange process where the relative population of labile to water protons, p, is much smaller than 1, R1ρ can be expressed as18, 25
where Rex is the exchange-mediated relaxation rate, and R2,0 is the transverse relaxation rate of water protons without CE contributions. The Rex term fully characterizes the CE process and is proportional to labile proton concentration as defined by18, 25
 |
where ω1 is the SL frequency equal to γB1/2π (units of Hz), and γ is the gyromagnetic ratio. Determination of R1ρ at multiple ω1 levels yields a ‘dispersion curve', where R2,0 can then be approximated as the R1ρ value at high ω1, and CE-related values p, k (units of per second), and δ (units of rad/second) can be determined by fitting the dispersion data to Equations [1] and [2].18 Equation [1] quantitatively describes both CESL and CEST data for glucose and other biomolecules, as confirmed by our recent phantom studies.18
In glucoCESL applications, ΔR1ρ with administration of Glc or 2DG should be dominated by ΔRex, and relate to the change in the ratio of hydroxyl to water protons (Δp), as expressed by
 |
Simulations
Characterizations of CESL and CEST were performed by computer simulations with Bloch–McConnell equations as follows.
(1) Sensitivity to different exchange rates was compared for CESL versus CEST by simulating the maximum CE contrast achievable by each of these approaches for various k/δ values, for water R1=1/T1=0.5 per second, and water R2,0 values of 5 and 20 per second. For comparison with in vivo glucoCESL data, we also assumed a chemical shift, δ, between water and labile protons of 3,770 rad/second, equivalent to +1.5 ppm relative to water at 9.4 T, and a labile proton concentration of 10 mmol/L, with water R1=0.5 per second and water R2,0=20 per second. Contrast for CESL was calculated as the difference (ΔS) between T1ρ-weighted signals (S) with CE (i.e., p≠0) and without CE (i.e., p=0), normalized by S0. Contrast for CEST was obtained from the asymmetric magnetization transfer (MT) ratio, which is the difference (ΔS) between signals with irradiation frequency offsets, Ω, at the reference frequency (Ω=−δ) and at the hydroxyl proton frequency (Ω=+δ), normalized by S0. Maximum contrast at each k value was simulated for CESL at optimal ω1 and TSL values, and for CEST at optimal ω1 for steady-state conditions (saturation duration→∞).
(2) The effect of errors on CESL versus CEST measurements owing to variations in water resonance frequency was simulated for B0 shifts ranging from 0 to 20 Hz, assuming water R1=0.5 per second, water R2,0=20 per second, and no CE (p=0). The CEST asymmetric MT ratio errors were calculated at Ω=200, 400, and 600 Hz with B1=1.6 μT and 4-second saturation duration (typical for glucoCEST studies10, 11, 13). For comparison, the errors in CESL contrast (ΔS/S0) and CESL R1ρ owing to B0 shifts were simulated for ω1=300, 400, and 500 Hz. Since B0 shifts cause CESL signal oscillations, the magnitude of signal oscillations was first calculated as ΔS=|STSL(with B0 shift)−STSL(without B0 shift)| for each of 100 equally spaced TSL values ranging between 45 and 55 milliseconds (typical in vivo tissue T1ρ values at 9.4 T19) and then averaged.
Chemical Exchange-Sensitive Spin-Lock Magnetic Resonance Imaging Experiments—General
All MRI experiments were performed on a 9.4-T MR system (Agilent Technologies, Santa Clara, CA, USA). For phantom experiments, a 3.8-cm ID quadrature volume coil (Rapid Biomedical, OH, USA) provided RF transmission and detection; on-resonance SL irradiation of TSL duration at the desired ω1 level was sandwiched between a 90° hard excitation pulse and a 90° hard flip-back pulse. For the in vivo experiments of paradigms 1 and 2 (see below), RF transmission was provided by a volume coil (6.4 cm diameter) and received by a surface coil (2.2 cm diameter; coil combination from Nova Medical, MA, USA). For the in vivo experiments of paradigm 3, RF was transmitted and received by a home-built surface coil (1.6 cm diameter), since these studies required higher ω1 values.19 In all in vivo studies, 50 milliseconds of SL irradiation at the desired ω1 level was sandwiched between an adiabatic half-passage pulse and an inverse adiabatic half-passage pulse (each of 1.5 millisecond duration).26 Immediately after SL preparation, MR images were acquired by single-shot echo planar imaging (EPI).
Chemical Exchange-Sensitive Spin-Lock Phantom Magnetic Resonance Imaging Studies
Biochemicals dissolved in phosphate-buffered saline were placed in individual vials, and data from multivial phantoms were acquired at 37°C to characterize various CESL properties. (i) Effects of hydroxyl groups from different molecules were studied with 30 mmol/L solutions of Glc, 2DG, glycogen, and myo-inositol at pH=7.0. (ii) Dependence on pH was determined with 20 mmol/L Glc at pH=6.8, 7.0, 7.2, and 7.4. (iii) Water T1 and T2 effects on quantification were examined with 5 and 20 mmol/L solutions of Glc at pH=7.0, both with and without addition of 0.1 mmol/L MnCl2. (iv) Linear dependence of R1ρ on glucose concentration was validated with 5, 10, 15, 20, 30, and 40 mmol/L solutions of Glc and 2DG at pH=7.0, with addition of 0.15 mmol/L MnCl2 to reduce T2 to values closer to tissue, and also to speed acquisition. For all phantoms, dispersion data were acquired with spin-echo EPI for 11 ω1 values between 125 and 4,000 Hz, with 64 × 64 matrix size, 4 × 4 cm2 field of view, 5 mm slice thickness, echo time=25 milliseconds, and repetition time=15 seconds.
Chemical Exchange-Sensitive Spin-Lock In Vivo Magnetic Resonance Imaging Studies
Animal preparation
With approval by the Institutional Animal Care and Use Committee at the University of Pittsburgh, 32 male Sprague-Dawley rats were studied (26 for MRI experiments, and 6 for bench-top measurements of blood glucose). Animals were anesthetized with isoflurane (5% for induction and 2% for surgery) in a mixture of O2 and air, with the O2 concentration maintained at 30%. The right femoral vein was catheterized to deliver maintenance fluid and Glc (or 2DG or mannitol). The right femoral artery was catheterized to ensure arterial blood pressure was maintained within a normal physiologic range. After surgery, the isoflurane level was reduced to ∼1.5%, and maintained at this level. End-tidal CO2 levels were monitored and kept within 3.0 to 4.0%. Rectal temperature was maintained at 37.2±0.5°C using a feedback-controlled heating pad.
Animal magnetic resonance imaging experiments
GlucoCESL rat-brain studies were performed for three separate paradigms with intravenous injection of Glc, 2DG, or mannitol. General EPI parameters were matrix size=64 × 64, field of view=3.2 × 3.2 or 2.56 × 2.56 cm2, 2 mm slice thickness, repetition time=3 seconds, echo time=30 milliseconds for single- or double-spin-echo EPI, and echo time=12.5 milliseconds for gradient-echo EPI. Determinations of R1ρ time courses in each run were made from interleaved acquisitions of images with TSL=0 and with TSL=50 milliseconds at the appropriate ω1 values; when TSL was 0, delays after data acquisition were increased by 50 milliseconds to maintain constant repetition time. Solutions of Glc, 2DG, and mannitol were prepared at 20% weight by volume, and each dose was injected over a 1- to 5-minute period, except for the additional infusion of Glc in paradigm 3. Specific details are as follows:
Paradigm 1: The detection threshold of glucoCEST MRI with our settings was determined by administering consecutive doses of 0.25, 0.5, and 1.0 g/kg body weight Glc (n=5 rats) at 40, 100, and 180 minutes, respectively, after initiation of scanning. The 60- and 80-minute intervals between doses allowed blood glucose to recover to baseline levels (as shown below in Figure 5D for 1 g/kg injection). Maps of R1ρ (and ΔR1ρ) were generated from spin-echo EPI images without SL preparation (i.e., TSL=0, single acquisition) and SL-weighted images with ω1=500 Hz (TSL=50 milliseconds, 3 averages), yielding a temporal resolution of 12 seconds.
Paradigm 2: The dynamic properties of glucoCESL MRI were assessed for Glc, 2DG, and mannitol administration (n=4 rats each) for matched doses of 1 g/kg body weight, both to compare sensitivity, and to characterize the source of ΔR1ρ changes. Data were acquired for 100 minutes after Glc or 2DG administration; responses after mannitol injection were small, so acquisition in those studies was terminated at 60 minutes. Maps of R1ρ (and ΔR1ρ) were generated as in paradigm 1. In separate bench-top studies, blood glucose levels were sampled every 10 minutes with administration of Glc (n=3 rats) or 2DG (n=3 rats), and time courses were compared with those of ΔR1ρ.
Paradigm 3: The origin of glucoCESL contrast was further assessed by acquiring time-dependent data for ΔR1ρ at varied ω1 values in Glc and in 2DG studies with data acquired at steady state. If the origin of signal change is dominated by CE effects, then ΔR1ρ should decrease with ω1, as expected in Equation [3]. A second goal was to compare steady-state responses to 2DG and Glc administration, where the correlations between blood and brain glucose levels for the latter have been established.2 As blood glucose levels decrease faster after Glc versus 2DG injection, steady-state levels were attained in Glc studies (n=4 rats), by injecting 0.3 g/kg body weight Glc over a 1-minute period, followed by constant infusion of 2.0 g/kg per hour Glc for 1 hour; four double-spin-echo EPI T1ρ-weighted images were acquired in an interleaved manner, one without and three with SL weighting (ω1=500, 1,000, and 2,000 Hz). Blood glucose levels were sampled shortly before and ∼60 minutes after onset of the first Glc injection. In 2DG studies (n=5 rats), a single injection of 1 g/kg 2DG was administered; three T1ρ-weighted images were acquired in an interleaved manner either by double-spin-echo or gradient-echo EPI, one without SL preparation and two with SL weighting of ω1=500 and 2,000 Hz (results from both EPI techniques were similar, so they were combined). To ensure that ω1 was similar in all studies and across the region of interest (ROI), a midcortical ROI in the dorsal area close to the surface coil was first selected from anatomic images (see orange pixels of Figure 5C inset image for an example), and ω1 was adjusted so that its spatial average over the ROI reached the target value.19
Data Analysis
Data were analyzed with in-house Matlab programs and STIMULATE software.27 For phantoms studies, quantitative analyses were performed for large circular ROIs defined within each sample vial. Values of δ, k, and R2,0 for each solution were first obtained by fitting the R1ρ dispersion data to Equations [1] and [2]. Then Rex values were determined at ω1=500 Hz and at ω1=2,000 Hz, and the ratio between them was calculated. For fitting to Equation [2], the relative population (p) is the number of labile protons per biomolecule (N) times its concentration divided by 110 mol/L (proton concentration in the water pool), where N is 5 for Glc, 4 for 2DG, 3 for glycogen, and 6 for myo-inositol. Although different hydroxyl protons within each molecule have their own chemical shifts and exchange rates7, 11, 18 (e.g., Glc hydroxyl protons shows distinct resonances at ∼1.2, 2.2, and 2.8 ppm relative to water7), it is the average δ, k, and Rex values from all hydroxyl resonances that were determined here.
For in vivo experiments where images with varied ω1 and TSL values were acquired in an interleaved manner, images with same ω1 and TSL values were extracted from each run. Time series of R1ρ images were calculated by mono-exponential fitting of signal intensities from TSL=0 milliseconds and TSL=50 milliseconds, as R1ρ=ln (STSL=0/STSL=50 milliseconds)/50 milliseconds. Statistical maps corresponding to R1ρ changes resulting from Glc or 2DG injection were calculated by performing Student's t-tests on a pixel-by-pixel basis, where a threshold of P<0.05 (uncorrected for multiple comparisons) was chosen and a minimum cluster size of 3 pixels was applied. Baseline data were averaged from the period spanning 10 to 0 minutes before start of injection. Data for glucose-induced changes were from periods spanning 10 to 25 minutes post injection for paradigms 1 and 2, and 50 to 70 minutes post injection for paradigm 3. Quantitative analyses were performed for ROIs encompassing all brain pixels (paradigm 1) and from small midcortical ROIs (paradigms 2 and 3), as determined from anatomic images. Time-dependent series of ΔR1ρ maps are presented as averages over 10-minute intervals before subtraction from the baseline average, while ΔR1ρ time courses from within ROIs are presented as averages over 1-minute intervals and are shown as mean±s.e.m.
Results
Chemical Exchange-Sensitive Spin-Lock Magnetic Resonance Imaging Studies in Phantoms
Figure 1 shows dispersion data characterizing CESL properties in phantoms. In Figure 1A, 30 mmol/L solutions of Glc, 2DG, myo-inositol, and glycogen all show high R1ρ values when ω1⩽500 Hz, but this CE effect is attenuated as ω1 increases, and R1ρ is much slower when ω1⩾2,000 Hz; this ω1 dependence on CE is an important property of CESL. The arrows in the dispersion curve approximately indicate the half-width at half-maximum value of ω1, where the condition ω12=k2+δ2 is satisfied.18 Assuming similar δ, the higher half-width at half-maximum values for Glc and 2DG suggest that k is faster than for glycogen and myo-inositol. Figure 1B shows R1ρ dispersion data for 20 mmol/L Glc solutions spanning the range of physiologic pH values (6.8 to 7.4); the half-width at half-maximum values of ω1 increase with pH. Characteristics of Figure 1B dispersion curves can be appreciated from Equation [2], given that δ is constant for all four solutions (pH-independent), whereas k increases with pH. Namely, at very small ω1 values, the largest R1ρ is seen for the pH 7.0 solution, meaning that δ is closest to the k value of that solution (i.e., in the intermediate CE regime), whereas at very large ω1, R1ρ increases with k.18, 19 Note that at ω1 ∼500 Hz (vertical dashed line), R1ρ, and therefore Rex, are relatively insensitive to this physiologic pH range, with a variation of <8%. However, when ω1⩾2,000 Hz, R1ρ and Rex are much more sensitive to pH. From Equation [2], the ratio between Rex acquired at 500 Hz versus 2,000 Hz should therefore decrease monotonically with increasing k. Information on k (and pH) changes can thus be inferred from this ratio of Rex values. Table 1 shows results of fitting R1ρ dispersion data to yield values for k, δ, and the ratio of Rex values at ω1=500 versus 2,000 Hz.
Figure 1.

Chemical exchange-sensitive spin-lock magnetic resonance imaging data at 9.4 T (Tesla) from biochemical solutions prepared in phosphate-buffered saline, and measured at 37°C. (A–C) Dispersion curves (rotating-frame spin-lattice relaxation rates, R1ρ, versus spin-lock frequencies, ω1) are displayed for solutions with (A) D-glucose (Glc), 2-deoxy-D-glucose (2DG), glycogen (Gly), and myo-inositol (Ins), all at 30 mmol/L concentration at pH=7.0; (B) 20 mmol/L Glc at four pH values; and (C) 5 and 20 mmol/L Glc at pH=7.0 without and with MnCl2. Color-matched arrows in panel A indicate the approximate half-width at half-maximum (HWHM) values of ω1 for each solution, suggesting that the chemical exchange rates (k) between protons in water and those in the hydroxyl groups are faster for Glc and 2DG versus Gly and Ins (see text for rationale). The dispersion curve in panel B is steepest for samples at pH=6.8 and 7.0, with HWHM values for ω1 increasing with pH value; the R1ρ values are similar for all pH values at ω1=500 Hz (vertical dashed line). The nearly identical R1ρ span between arrows at ω1=500 Hz in panel C indicates that Glc concentration-dependent R1ρ differences are independent of T1 and T2 relaxation. (D) As expected from Equation [2], R1ρ is shown to be linearly proportional to glucose concentration in Glc and 2DG solutions (at pH=7.0 with 0.15 mmol/L MnCl2; acquired with ω1=500 Hz); the slope of the linear fit is 0.066 per second per mmol/L for Glc and 0.050 per second per mmol/L for 2DG.
Table 1. Valuesa derived by fitting phantom R 1ρ dispersion data to Equations [1] and [2].
| Glc | Glc | Glc | Glc | 2DG | Gly | Ins | |
|---|---|---|---|---|---|---|---|
| pH | 6.8 | 7.0 | 7.2 | 7.4 | 7.0 | 7.0 | 7.0 |
| k (per second) | 4,280 | 4,710 | 6,100 | 8,140 | 4,500 | 2,155 | 3,388 |
| δ (rad/second) | 3,572 | 3,648 | 3,773 | 3,824 | 3,522 | 2,516 | 2,718 |
 |
3.5 | 3.0 | 2.6 | 2.1 | 3.4 | 6.5 | 6.1 |
2DG, 2-deoxy-D-glucose; Glc, D-glucose; Gly, glycogen; Ins, myo-inositol; k, chemical exchange rate between protons in water and those in the hydroxyl groups; δ, resonance frequency separation between protons in water and those in the hydroxyl groups; Rex, exchange-mediated relaxation term.
Results are mean values for all OH groups.
Dispersion data were also acquired for Glc concentrations of 5 and 20 mmol/L, with the water relaxation rates altered by MnCl2. Figure 1C shows that glucose concentration-dependent differences in R1ρ are independent of the MnCl2-induced differences in water T1 and T2, as seen by the similar spans indicated by the blue arrows. Therefore, ΔR1ρ from Equation [3] can be a quantitative index to determine changes in glucose concentration. The linear dependence of R1ρ on glucose concentration was further confirmed by studies of Glc and 2DG solutions with pH 7.0 at a typical ω1 value of 500 Hz (Figure 1D). A linear fit to concentration yields ΔR1ρ (and ΔRex) of ∼0.066 per second per mmol/L Glc (r=0.998) or 0.050 per second per mmol/L 2DG (r=0.999).
Simulations of Chemical Exchange Effects in Chemical Exchange Saturation Transfer and Chemical Exchange-Sensitive Spin-Lock with Bloch–McConnell Equations
Values for maximum contrast with CEST and CESL were calculated for different k/δ values. Contrast with CEST is optimal for slow CE regimes (k/δ<<1), but very low for fast CE regimes (k/δ>1). However, CESL contrast is optimal for intermediate CE regimes (k/δ∼1), and is higher than CEST when k/δ>1. Contrast with both CESL and CEST decreases as R2,0 increases. For a more specific example relevant to glucose in vivo, the R2,0=20 per second data from the dotted region of Figure 2A were replotted as a percentage change in Figure 2B, where both Glc and 2DG are represented at 9.4 T by the blue vertical line (k/δ=1.29, from Table 1), and at 3 T by the green vertical line (k/δ=4.05). These results suggest that CESL MRI is a good choice for glucose mapping at 9.4 T, and an even better choice at lower fields where k/δ is larger.
Figure 2.

Simulations by Bloch–McConnell equations showing enhanced sensitivity to glucose detection for chemical exchange-sensitive spin lock (CESL) versus chemical exchange saturation transfer (CEST). Values shown are for the maximum contrast achievable. (A) Normalized contrast (ΔS/S0/(p·δ)) with CEST highest in the slow-exchange regimes (i.e., when k/(resonance frequency separation, δ) «1), where it outperforms CESL. Normalized contrast with CESL highest for intermediate-exchange regimes (k/δ ∼1), and CESL outperforms CEST in the fast-exchange regimes (k/δ>1). Contrast in both CEST and CESL depends on R2,0 (the transverse relaxation rate in the absence of exchange effects), but scales linearly with δ and with relative population (i.e., glucose hydroxyl protons to water protons, p) when p·δ<<1, so contrast is normalized by (p·δ). (B) Simulations are plotted over a smaller range of k/δ values, for reasonable in vivo values of R2,0=20 per second, 10 mmol/L of labile protons (P=0.00091), and δ=3,770 rad/second; vertical lines indicating the k/δ values appropriate for both D-glucose and 2-deoxy-D-glucose at 9.4 T (Tesla; blue line) and at 3 T (green line) show that CESL outperforms CEST at both field strengths; however, the sensitivity enhancement is substantially higher at 3 T.
Computed errors owing to water resonance frequency variations in CEST and CESL experiments appear in Figure 3. Simulations for typical in vivo CEST saturation (i.e., B1=1.6 μT applied for 4 seconds) show that the asymmetric MT ratio signal at an irradiation offset (Ω) of 400 Hz has an error of 0.5% for the 2-Hz B0 shift often encountered in brain studies,28, 29 1.2% for a 5-Hz shift, and 5% for a 20-Hz shift (Figure 3A). Simulations for typical in vivo CESL studies (i.e., TSL ∼50 milliseconds) show that errors from B0 shifts are greatly reduced (versus CEST) for ω1⩾300 Hz, with negligible effects on either contrast (ΔS/S0; Figure 3B) or on calculated R1ρ values (Figure 3C), even for B0 shifts as large as 20 Hz.
Figure 3.

Simulations by Bloch–McConnell equations showing that small magnetic field (B0) shifts give large errors in chemical exchange saturation transfer (CEST), and very small errors in chemical exchange-sensitive spin lock (CESL). Large B0-dependent errors appear for (A) CEST asymmetric magnetization transfer ratio (MTRasym) in simulations for three radiofrequency offset (Ω) values, while negligible B0-dependent errors are present for (B) CESL contrast (ΔS/S0), and (C) CESL R1ρ values in simulations at three ω1 levels. Note the vastly different vertical axes scales in panel A versus panel B.
Dose-Dependence and Detection-Threshold Evaluation of glucoCESL with Glc in Rat Brain
In vivo glucoCESL data from consecutive Glc injections administered at three different doses appear in Figure 4 (paradigm 1). Figure 4A shows statistical maps calculated from the ΔR1ρ time series for each Glc dose in two separate animals. At the lowest dose of 0.25 g/kg Glc, increases in R1ρ already appear above the statistical threshold for many pixels, but with injection of 0.5 g/kg Glc, a widespread increase in R1ρ is detected, and at 1 g/kg Glc, the increase in R1ρ is higher yet, with pixels above the statistical threshold spanning most of the brain. Figure 4B shows the average of the brain R1ρ time courses from all five animals, where a dose-dependent R1ρ increase is robustly observed, even at 0.25 g/kg Glc. For individual animals, the brain ΔR1ρ value at the time of its highest response increases nearly linearly with Glc dose (Figure 4C).
Figure 4.
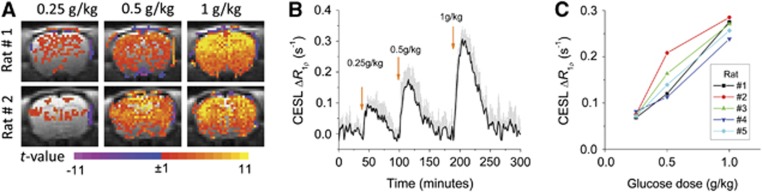
Rat-brain glucoCESL studies at 9.4 T showing near-linear contrast for intravenously administered D-glucose (Glc) doses of 0.25, 0.5, and 1.0 g/kg, and robust detection for doses ⩾0.25 g/kg (in vivo paradigm 1). (A) The t-maps for each dose for two of the animals show highest t-values in the cortex where sensitivity is higher with our surface coil reception. Color scale: t-value. (B) Average of time courses for all animals (n=5, mean±s.e.m.) clearly shows the increase in brain ΔR1ρ with Glc dose. Arrows indicate time of injection. (C) The nearly linear dependence of peak brain ΔR1ρ on Glc dose appears for each individual animal. CESL, chemical exchange-sensitive spin lock.
Dynamic glucoCESL Response Comparisons for Glc, 2DG, and Mannitol in Rat Brain
Time-dependent glucoCESL (Figure 5) shows in vivo postinjection responses that are much larger and persist for a longer duration for 1 g/kg 2DG versus 1 g/kg Glc (paradigm 2) in serial ΔR1ρ maps typifying 0 to 90 minutes post injection (Figures 5A and 5B, respectively). These dynamic properties are further shown in ΔR1ρ time course averages from all the four animals (Figure 5C). Peak ΔR1ρ values were reached in ∼20 minutes for both 2DG and Glc, but with ∼2.5 times higher magnitude for 2DG, which is in good agreement with a glucoCEST report.13 Recovery of ΔR1ρ to preinjection baseline levels occurred around 60 minutes post-Glc injection, but recovery for 2DG still had not occurred at the end of the 100-minute window. The higher-intensity and longer-duration ΔR1ρ responses to 2DG (versus Glc) can partially be explained by the difference in time courses of blood glucose levels after single 1-g/kg dose injections (Figure 5D). Blood glucose levels peaked immediately after injection, with magnitudes similar for 2DG and Glc. However, blood glucose levels with Glc decreased rapidly, returning to baseline at ∼60 minutes post injection, whereas levels with 2DG decreased much slower; after a postinjection delay of 10 to 40 minutes, the ratio of blood glucose concentration decrease for Glc versus 2DG is qualitatively similar to that for ΔR1ρ (Figure 5C versus 5D). The osmolality change after 1-g/kg mannitol injection in the four animals has a smaller effect (versus Glc) on the ΔR1ρ time course (Figure 5C).
Figure 5.

Temporal dynamic properties in rat brain showing larger and longer-duration R1ρ responses at 9.4 T after the intravenous injection of 2-deoxy-D-glucose, 2DG (1 g/kg) versus D-glucose, Glc (1 g/kg)—with only minor contributions from osmolality changes (mannitol, 1 g/kg)—and more persistent elevation of blood glucose levels for 2DG versus Glc (in vivo paradigm 2). Representative time-resolved maps show ΔR1ρ before and 0 to 90 minutes after the injection of Glc (A) versus 2DG (B), where times are 0 to 10 and 80 to 90 minutes for the first and final postinjection maps, respectively; note the difference in ΔR1ρ gray scale ranges under each series. High-temporal resolution ΔR1ρ time courses (C) of Glc, 2DG, and mannitol (n=4 each, mean±s.e.m.) are shown for midcortical regions as typified by orange pixels in the inset image; time courses from all brain pixels are qualitatively similar to those of the midcortical regions (not shown). The hypertonic mannitol injection serves as an osmolality control to investigate contributions to ΔR1ρ owing to any changes in tissue water content. (D) Time courses of blood glucose changes in bench-top studies with injection of 1-g/kg Glc or 1-g/kg 2DG (n=3 each, mean±s.e.m.) show dynamic characteristics that differ from ΔR1ρ (compare to panel C) at initial time points (<20 minutes), but are similar at later time points; gray bar indicates injection time. CESL, chemical exchange-sensitive spin lock.
Dependence of In Vivo glucoCESL Contrast on Spin-Lock Frequency and Blood Glucose Levels
Further assessment of contributions to in vivo ΔR1ρ was achieved at a steady state (i.e., administration tailored to attain similar blood glucose concentrations, Glc versus 2DG) with determination of SL-frequency dependence (paradigm 3). Time courses in Figure 6 for ΔR1ρ at different ω1 values represent averages from all animals administered Glc (n=4) or 2DG (n=5). Arterial blood glucose levels sampled at 60 minutes post injection confirm that increases for Glc versus 2DG studies were similar: 160±25 mg/dL for Glc during MRI experiments, versus 144±31 mg/dL for 2DG from separate bench-top measurements (see Figure 5D). GlucoCESL data show that ΔR1ρ is much smaller for ω1=2,000 versus 500 Hz, both for Glc (Figure 6A) and 2DG (Figure 6B), which is expected for responses dominated by CE effects, as reflected in Equation [3] and shown in Figure 1. The averaged ratio of ΔR1ρ at ω1=500 Hz to ΔR1ρ at ω1=2,000 Hz is 1.75 for Glc and 2.1 for 2DG. The average steady-state ΔR1ρ value at ω1=500 Hz between 50 and 70 minutes post injection is 0.30±0.03 per second for Glc, and 0.65±0.03 per second for 2DG, respectively.
Figure 6.

Rat-brain glucoCESL contrast at 9.4 T confirmed to be mainly from glucose chemical exchange (in vivo paradigm 3). Blood glucose concentrations were sustained at a steady state in (A) by injecting 0.3 g/kg D-glucose (Glc) over a 1-minute duration (blue arrow), followed by a constant infusion of Glc at 2 g/kg per hour for 1 hour (gray bar). For the 2-deoxy-D-glucose (2DG) studies of (B), a single injection of 1 g/kg was given at time=0. Arterial blood glucose levels at 60 minutes post injection increased to 160±25 mg/dL for Glc and 144±31 mg/dL for 2DG. Time courses of ΔR1ρ dependence on ω1 with intravenous injections of Glc (A, n=4, mean±s.e.m.) or 2DG (B, n=5, mean±s.e.m.) show values within midcortical regions, as typified in the inset image of Figure 5C. For clarity, ΔR1ρ data with ω1=1,000 Hz is not shown, since it falls between the data for ω1=500 and 2,000 Hz. The ΔR1ρ values are much smaller for ω1=2,000 versus 500 Hz, both for Glc and 2DG, which is expected for responses mainly due to CE effects. CESL, chemical exchange-sensitive spin lock.
Discussion
Enhancement in Glucose Detection Sensitivity for glucoCESL versus glucoCEST
Previous glucoCEST rat-brain studies at 9.4 T found no detectable responses for a dose of 0.5 g/kg Glc, and even at 1 g/kg Glc the responses were weak and had diminished after 10 minutes, despite the fact that blood glucose levels remained hyperglycemic.13 Reliable detection of brain glucose with glucoCEST requires that blood glucose levels should be raised above baseline by more than 300 mg/dL (∼17 mmol/L).13 With the near-linear relationship between brain and blood glucose levels established by nuclear magnetic resonance spectroscopy,1, 2 these studies suggested a brain glucose elevation of 6 to 7 mmol/L as a detection threshold for glucoCEST at 9.4 T. However, our in vivo glucoCESL rat-brain studies at 9.4 T show robust detection at doses as low as 0.25 g/kg Glc, meaning ΔR1ρ ∼0.1 per second is the detection threshold for our conditions, which corresponds to ∼1.5 mmol/L increase in brain glucose concentration. We reported in a prior fMRI study that with sufficient signal averaging to enhance the sensitivity, neural stimulation induced a small CESL ΔR1ρ response of ∼0.05 per second in the cat visual cortex, which may be attributed to a submillimolar decrease in glucose.19
This enhancement in glucose detection sensitivity for glucoCESL versus glucoCEST may be explained by three major factors—differing sensitivity to exchange rates, differing temporal resolution, and different effects from B0 shifts. First, k values for Glc were determined to be 4,280 to 8,140 per second for a physiologic range of pH values (6.8 to 7.4), and this falls between the intermediate and fast exchange regimes (k/δ>1, Table 1), where CESL contrast is expected to exceed that of CEST (see Figure 2B). However, this sensitivity advantage of glucoCESL will be reduced if k is much slower, such as the case for the lower pH of ischemic tissues. Second, temporal resolution in our glucoCESL sensitivity tests was 12 seconds, while typically for glucoCEST it is ∼10 minutes to accommodate the long saturation pulse and the need to acquire images at multiple RF offsets.10, 11, 13 This much-higher temporal resolution of glucoCESL provides a higher statistical power for glucose detection as compared with glucoCEST. Third, the effect of any B0 shift is much smaller for glucoCESL versus glucoCEST. Because the saturation frequency for CEST is quite close to water, B0 shift of just a few hertz can cause significant signal errors, making an effective pixel-wise B0 correction scheme with acquisition of redundant data essential.10, 11, 13 Unfortunately, accurate pixel-wise B0 corrections could be very difficult in the presence of the large physiologic or instrumental fluctuations that may occur during long CEST acquisitions.30
Sensitivity enhancement of glucoCESL versus glucoCEST is expected to be even higher at lower magnetic fields for two reasons. (i) Since δ is proportional to the magnetic field, the increase in k/δ at lower clinical fields (such as 3 T) as compared with ultra-high fields (⩾9.4 T) will consequently make the relative sensitivity gain of CESL versus CEST even more prominent (Figure 2B). (ii) Although, CESL only have minimal errors originating from B0 shifts, these errors in CEST may intensify at lower fields where the RF saturation frequency offset is proportionately closer to water (see Figure 3A, Ω=200 versus 600 Hz).
Origin of glucoCESL Signals
A glucose increase in three separate pools can contribute to glucoCESL signals: intravascular blood and extracellular and intracellular spaces in tissue. The intravascular blood glucose contribution to ΔR1ρ is minimal at 9.4 T because of (1) a small arterial vascular volume fraction (∼1%) and (2) suppression of the venous component in EPI acquisitions at relatively long echo times, due to short T2 and T2* values.31 In addition, insight about the contribution from intravascular glucose can be obtained by comparing the temporal dynamics of blood glucose levels and the high-temporal resolution time course of ΔR1ρ. Blood glucose peaks immediately after injection, whereas ΔR1ρ increases gradually and peaks ∼15 to 20 minutes post injection. This temporal mismatch indicates that ΔR1ρ should have minimal contributions from intravascular glucose.
A decrease of extravascular water content induced by the elevation of plasma osmolality can contribute to a small ΔR1ρ term, as evidenced after mannitol injection (Figure 5C). However, this contribution is exaggerated with mannitol, since it remains in the vasculature with a half-life of ∼60 minutes.22 The osmolality-induced ΔR1ρ for glucoCESL is dependent on the difference between blood and tissue glucose concentrations. Tissue uptake of Glc and 2DG makes their osmolality contributions to ΔR1ρ even smaller, since there will be rapid equilibration of blood and tissue glucose concentrations. In addition, osmolality effects should be further reduced by rapid metabolism of Glc to glucose-6-phosphate, and metabolism of 2DG to 2DG-6-phosphate (2DG6P) with the latter accumulating in tissue.
As glucoCESL vascular contributions are minimal, the change in R1ρ mostly arises from the extracellular and intracellular spaces in tissue, where relative contributions depend on glucose concentration, pool size, k, and ω1. Intracellular pH is usually 7.0 to 7.1,6, 32 while extracellular pH is ∼7.2 to 7.3.33, 34 Our phantom data suggest that at ω1=500 Hz, glucoCESL sensitivity is similar for this range of pH values (Figure 1B), and therefore the ΔR1ρ change would have similar weighting from both extracellular and intracellular spaces and reflect the total glucose change. The ratio of in vivo ΔR1ρ at 500 to 2,000 Hz is ∼40% smaller than for the aqueous phantoms at pH=7.0, suggesting that overall in vivo k values are higher (according to Equation [3] and Table 1). It is possible that in vivo k values are higher than our phantom at matched pH because of a different concentration of exchange catalysts. Further studies will be necessary to quantify in vivo k values and to determine whether ΔR2,0 is negligible in Glc and 2DG results, possibly by fitting in vivo dispersion data acquired with more ω1 levels to Equations [1] and [2].
Quantification of Glucose Concentration Changes
One critical question is whether a change in Glc concentration can be determined with CE-MRI. In both CEST and CESL, the CE sensitivity is coupled with non-CE relaxation mechanisms including T1 and T2 effects, and MT from semisolid macromolecules, as seen in Figures 2A for varied T2. Consequently, different T2 and MT effects will alter CE signal intensities, even when metabolite concentrations are the same.35, 36 Therefore, in vivo glucoCEST signals cannot be directly compared with those measured in aqueous phantoms to determine the glucose concentration. Unlike CEST and CESL signal intensities, our phantom results indicate that R1ρ changes in CESL are independent of T1 and T2, and provide a quantitative index of glucose concentration changes (Figure 1C). In addition, the non-CE MT effect is also incorporated into the R2,0 term in Equation [1] with minimal contribution to ΔR1ρ in Equation [3]. Assuming that the k value is the same in vivo as for our aqueous phantoms (Figure 1C and Table 1), the brain glucose change can be estimated. In the steady state, the ΔR1ρ value of 0.30 per second averaged between 50- and 70-minutes post-Glc injection at ω1=500 Hz in paradigm 3 (Figure 6A) yields an estimate of 4.5 mmol/L increase in brain glucose concentration, or 3.7 μmoL per gram tissue, assuming 0.83 g water per gram tissue. This is in good agreement with the conversion of our 160±25 mg/dL (i.e., 8.9±1.5 mmol/L) blood glucose levels (obtained at 60 minutes post injection) to brain glucose levels of 4±1 μmoL per gram tissue, using the blood–brain glucose relationship.2
Although, blood glucose levels were similarly elevated in Glc and 2DG studies (160 versus 144 mg/dL) when ΔR1ρ reached steady state (60-minute time point of Figure 6), the increase in brain 2DG concentration is estimated to be ∼13 mmol/L from ΔR1ρ of 0.65 per second, much higher than for Glc. It should be noted that glucose-administered CE-MRI techniques detect an overall increase in the number of hydroxyl groups, which predominantly arise from concentration changes of glucose (Glc or 2DG) and its metabolic products containing hydroxyl groups, such as glucose-6-phosphate and 2DG6P. Given a minimal contribution from intravascular blood, the higher steady-state ΔR1ρ values in 1-g/kg 2DG versus 1-g/kg Glc studies (Figure 5) are primarily because of a larger extravascular (i.e, neural tissue) concentration of 2DG and its metabolic products (versus Glc). It is known that unlike glucose-6-phosphate, 2DG6P accumulates in cells.37, 38 It was reported that with a 0.5-g/kg 2DG injection, the brain concentration of 2DG6P was approximately the same as that of 2DG at 20 minutes post injection and was approximately four times that of 2DG at 100 minutes post injection.39 Thus, with similar increases of blood Glc and 2DG concentrations, the much higher ΔR1ρ of 2DG may be mainly because of the increased concentration of intracellular 2DG6P. This observation and interpretation are consistent with the recent glucoCEST results,13 where the signal from 2DG is much higher than Glc, even when the steady-state blood glucose concentration with Glc infusion is higher than that of 1-g/kg 2DG injection.
Conclusion
Recent glucoCEST MRI studies show potential for widespread applications in diseases with altered glucose transport and metabolism, but sensitivity is limited, especially at clinical magnetic fields, and quantification is difficult. Our alternative glucoCESL approach substantially increases sensitivity and provides an index for potential quantitative mapping of glucose concentration changes that can be applied to dynamic studies with subminute temporal resolution. These advantages make glucoCESL MRI a viable tool for studies of glucose transport and potentially metabolism in clinical settings and in functional studies.
Acknowledgments
The authors thank Dr Ping Wang for animal preparation, and Dr Xiaopeng Zong and Professor Julie Price for helpful discussions.
The authors declare no conflict of interest.
Footnotes
This work is supported by NIH grants EB003324, P30-NS076405, and T90-DA022761.
References
- Choi I-Y, Lee S-P, Kim S-G, Gruetter R. In vivo measurements of brain glucose transport using the reversible Michaelis-Menton model and simultaneous measurements of cerebral blood flow changes during hyperglycemia. J Cereb Blood Flow Metab. 2001;21:653–663. doi: 10.1097/00004647-200106000-00003. [DOI] [PubMed] [Google Scholar]
- Choi IY, Lei HX, Gruetter R. Effect of deep pentobarbital anesthesia on neurotransmitter metabolism in vivo: on the correlation of total glucose consumption with glutamatergic action. J Cereb Blood Flow Metab. 2002;22:1343–1351. doi: 10.1097/01.WCB.0000040945.89393.46. [DOI] [PubMed] [Google Scholar]
- Shestov AA, Emir UE, Kumar A, Henry PG, Seaquist ER, Oz G. Simultaneous measurement of glucose transport and utilization in the human brain. Am J Physiol Endocrinol Metab. 2011;301:E1040–E1049. doi: 10.1152/ajpendo.00110.2011. [DOI] [PMC free article] [PubMed] [Google Scholar]
- de Graaf RA, Pan JW, Telang F, Lee JH, Brown P, Novotny EJ, et al. Differentiation of glucose transport in human brain gray and white matter. J Cereb Blood Flow Metab. 2001;21:483–492. doi: 10.1097/00004647-200105000-00002. [DOI] [PubMed] [Google Scholar]
- Ward KM, Aletras AH, Balaban RS. A new class of contrast agents for MRI based on proton chemical exchange dependent saturation transfer (CEST) J Magn Reson. 2000;143:79–87. doi: 10.1006/jmre.1999.1956. [DOI] [PubMed] [Google Scholar]
- Zhou JY, Payen JF, Wilson DA, Traystman RJ. van Zijl PCM. Using the amide proton signals of intracellular proteins and peptides to detect pH effects in MRI. Nat Med. 2003;9:1085–1090. doi: 10.1038/nm907. [DOI] [PubMed] [Google Scholar]
- van Zijl PCM, Jones CK, Ren J, Malloy CR, Sherry AD. MRI detection of glycogen in vivo by using chemical exchange saturation transfer imaging (glycoCEST) Proc Natl Acad Sci USA. 2007;104:4359–4364. doi: 10.1073/pnas.0700281104. [DOI] [PMC free article] [PubMed] [Google Scholar]
- Ling W, Regatte RR, Navon G, Jerschow A. Assessment of glycosaminoglycan concentration in vivo by chemical exchange-dependent saturation transfer (gagCEST) Proc Natl Acad Sci USA. 2008;105:2266–2270. doi: 10.1073/pnas.0707666105. [DOI] [PMC free article] [PubMed] [Google Scholar]
- Haris M, Nanga RPR, Singh A, Cai K, Kogan F, Hariharan H, et al. Exchange rates of creatine kinase metabolites: feasibility of imaging creatine by chemical exchange saturation transfer MRI. NMR Biomed. 2012;25:1305–1309. doi: 10.1002/nbm.2792. [DOI] [PMC free article] [PubMed] [Google Scholar]
- Chan KWY, McMahon MT, Kato Y, Liu GS, Bulte JWM, Bhujwalla ZM, et al. Natural D-glucose as a biodegradable MRI contrast agent for detecting cancer. Magn Reson Med. 2012;68:1764–1773. doi: 10.1002/mrm.24520. [DOI] [PMC free article] [PubMed] [Google Scholar]
- Walker-Samuel S, Ramasawmy R, Torrealdea F, Rega M, Rajkumar V, Johnson SP, et al. In vivo imaging of glucose uptake and metabolism in tumors. Nat Med. 2013;19:1067–1072. doi: 10.1038/nm.3252. [DOI] [PMC free article] [PubMed] [Google Scholar]
- Rivlin M, Horev J, Tsarfaty I, Navon G. Molecular imaging of tumors and metastases using chemical exchange saturation transfer (CEST) MRI. Sci Rep. 2013;3:3045. doi: 10.1038/srep03045. [DOI] [PMC free article] [PubMed] [Google Scholar]
- Nasrallah FA, Pages G, Kuchel PW, Golay X, Chuang KH. Imaging brain deoxyglucose uptake and metabolism by glucoCEST MRI. J Cereb Blood Flow Metab. 2013;33:1270–1278. doi: 10.1038/jcbfm.2013.79. [DOI] [PMC free article] [PubMed] [Google Scholar]
- van Zijl PCM, Yadav NN. Chemical exchange saturation transfer (CEST): what is in a name and what isn't. Mag Reson Med. 2011;65:927–948. doi: 10.1002/mrm.22761. [DOI] [PMC free article] [PubMed] [Google Scholar]
- Zhou JY, van Zijl PCM. Chemical exchange saturation transfer imaging and spectroscopy. Prog Nucl Magn Reson Spectrosc. 2006;48:109–136. [Google Scholar]
- Thompson RT, Knispel RR, Pintar MM. A study of proton exchange in tissue water by spin relaxation in rotating frame. Chem Phys Lett. 1973;22:335–337. [Google Scholar]
- Davis DG, Perlman ME, London RE. Direct measurements of the dissociation-rate constant for inhibitor-enzyme complexes via the t-1-rho and t-2 (cpmg) methods. J Magn Reson B. 1994;104:266–275. doi: 10.1006/jmrb.1994.1084. [DOI] [PubMed] [Google Scholar]
- Jin T, Autio J, Obata T, Kim SG. Spin-locking versus chemical exchange saturation transfer MRI for investigating chemical exchange process between water and labile metabolite protons. Magn Reson Med. 2011;65:1448–1460. doi: 10.1002/mrm.22721. [DOI] [PMC free article] [PubMed] [Google Scholar]
- Jin T, Kim SG. Characterization of non-hemodynamic functional signal measured by spin-lock fMRI. Neuroimage. 2013;78:385–395. doi: 10.1016/j.neuroimage.2013.04.045. [DOI] [PMC free article] [PubMed] [Google Scholar]
- Hulvershorn J, Borthakur A, Bloy L, Gualtieri EE, Reddy R, Leigh JS, et al. T-1 rho contrast in functional magnetic resonance imaging. Magn Reson Med. 2005;54:1155–1162. doi: 10.1002/mrm.20698. [DOI] [PMC free article] [PubMed] [Google Scholar]
- Kettunen MI, Grohn OHJ, Silvennoinen MJ, Penttonen M, Kauppinen RA. Effects of intracellular pH, blood, and tissue oxygen tension on T-1 rho relaxation in rat brain. Magn Reson Med. 2002;48:470–477. doi: 10.1002/mrm.10233. [DOI] [PubMed] [Google Scholar]
- Levy JR, Stevens W. Plasma hyperosmolality stimulates leptin secretion acutely by a vasopressin-adrenal mechanism. Am J Physiol Endocrinol Metab. 2004;287:E263–E268. doi: 10.1152/ajpendo.00514.2003. [DOI] [PubMed] [Google Scholar]
- Thenuwara K, Todd M, Brian JEJ. Effect of mannitol and furosemide on plasma osmolality and brain water. Anesthesiology. 2002;96:416–421. doi: 10.1097/00000542-200202000-00029. [DOI] [PubMed] [Google Scholar]
- Magnotta VA, Heo H-Y, Dlouhy BJ, Dahdaleh NS, Follmer RL, Thedens DR, et al. Detecting activity-evoked pH changes in human brain. Proc Nat Acad Sci. 2012;109:8270–8273. doi: 10.1073/pnas.1205902109. [DOI] [PMC free article] [PubMed] [Google Scholar]
- Trott O, Palmer AG. R-1rho relaxation outside of the fast-exchange limit. J Magn Reson. 2002;154:157–160. doi: 10.1006/jmre.2001.2466. [DOI] [PubMed] [Google Scholar]
- Garwood M, DelaBarre L. The return of the frequency sweep: designing adiabatic pulses for contemporary NMR. J Magn Reson. 2001;153:155–177. doi: 10.1006/jmre.2001.2340. [DOI] [PubMed] [Google Scholar]
- Strupp JP. Stimulate: a GUI based fMRI analysis software package. Neuroimage. 1996;3:S607. [Google Scholar]
- Van de Moortele PF, Pfeuffer J, Glover GH, Ugurbil K, Hu X. Respiration-induced B0 fluctuations and their spatial distribution in the human brain at 7 Tesla. Magn Reson Med. 2002;47:888–895. doi: 10.1002/mrm.10145. [DOI] [PubMed] [Google Scholar]
- Zahneisen B, Asslander J, Levan P, Hugger T, Reisert M, Ernst T, et al. Quantification and correction of respiration induced dynamic field map changes in fMRI using 3D single shot techniques. Magn Reson Med. 2014;71:1093–1102. doi: 10.1002/mrm.24771. [DOI] [PubMed] [Google Scholar]
- Desmond K, Moosvi F, Stanisz GJ. Mapping of amide, amine, and aliphatic peaks in the CEST spectra of murine xenografts at 7 T. Magn Reson Med. 2013;71:1841–1853. doi: 10.1002/mrm.24822. [DOI] [PubMed] [Google Scholar]
- Lee S-P, Silva AC, Ugurbil K, Kim S-G. Diffusion-weighted spin-echo fMRI at 9.4 T: microvascular/tissue contribution to BOLD signal change. Magn Reson Med. 1999;42:919–928. doi: 10.1002/(sici)1522-2594(199911)42:5<919::aid-mrm12>3.0.co;2-8. [DOI] [PubMed] [Google Scholar]
- Chu WJ, Hetherington HP, Kuzniecky RJ, Vaughan JT, Twieg DB, Faught RE, et al. Is the intracellular pH different from normal in the epileptic focus of patients with temporal lobe epilepsy? A 31P NMR study. Neurology. 1996;47:756–760. doi: 10.1212/wnl.47.3.756. [DOI] [PubMed] [Google Scholar]
- Cragg P, Patterson L, Purves M. The pH of brain extracellular fluid in the cat. J Physiol. 1977;272:137–166. doi: 10.1113/jphysiol.1977.sp012038. [DOI] [PMC free article] [PubMed] [Google Scholar]
- Kraig RP, Ferreira-Filho C, Nicholson C. Alkaline and acid transients in cerebellar microenvironment. J Neurophysiol. 1983;49:831–850. doi: 10.1152/jn.1983.49.3.831. [DOI] [PubMed] [Google Scholar]
- Jin T, Kim SG. Quantitative chemical exchange sensitive MRI using irradiation with toggling inversion preparation. Magn Reson Med. 2012;68:1056–1064. doi: 10.1002/mrm.24449. [DOI] [PMC free article] [PubMed] [Google Scholar]
- Vinogradov E, Sherry AD, Lenkinski RE. CEST: from basic principles to applications, challenges and opportunities. J Magn Reson. 2013;229:155–172. doi: 10.1016/j.jmr.2012.11.024. [DOI] [PMC free article] [PubMed] [Google Scholar]
- Sokoloff L, Reivich M, Kennedy C, Des Rosiers M, Patlak G, Pettigrew K, et al. The [14C] deoxyglucose method for the measurement of local cerebral glucose utilization: theory, procedure, and normal values in the conscious and anesthetized albino rat. J Neurochem. 1977;28:897–916. doi: 10.1111/j.1471-4159.1977.tb10649.x. [DOI] [PubMed] [Google Scholar]
- Huang MT, Veech RL. Metabolic fluxes between [14C]2-deoxy-D-glucose and [14C]2-deoxy-D-glucose-6-phosphate in brain in vivo. J Neurochem. 1985;44:567–573. doi: 10.1111/j.1471-4159.1985.tb05450.x. [DOI] [PubMed] [Google Scholar]
- Kotyk JJ, Rust RS, Ackerman JJH, Deuel RK. Simultaneous in vivo monitoring of cerebral deoxyglucose and deoxyglucose-6-phosphate by 13C{1H} nuclear magnetic resonance spectroscopy. J Neurochem. 1989;53:1620–1628. doi: 10.1111/j.1471-4159.1989.tb08560.x. [DOI] [PubMed] [Google Scholar]