Abstract
Seronegative spondyloarthropathy is a group of chronic inflammatory rheumatic diseases that predominantly affect the axial skeleton. Involvement of sacroiliac joint is considered a hallmark for diagnosis of seronegative spondyloarthropathy and is usually the first manifestation of this condition. It is essential for the radiologist to know the computed tomography (CT) and magnetic resonance imaging (MRI) features of spondyloarthropathy-related sacroiliitis as imaging plays an important role in diagnosis and evaluation of response to treatment. We present a pictorial essay of CT and MRI imaging findings in seronegative spondyloarthropathy-related sacroiliitis in various stages and highlight common differentials that need to be considered.
Keywords: Assessment of SpondyloArthritis international society, computed tomography, magnetic resonance imaging, sacroiliitis, seronegative, spondyloarthropathy sacroiliitis
Introduction
Seronegative spondyloarthropathy is a group of chronic inflammatory rheumatic diseases that predominantly affect the axial skeleton. This group comprises disease entities like ankylosing spondylitis, reactive arthritis, psoriatic arthritis, arthritis associated with chronic inflammatory bowel disease (Crohn's disease and ulcerative colitis), and undifferentiated spondyloarthropathies.[1,2,3] The disease is usually seen between second and fourth decades of life with onset after 45 years being exceedingly uncommon. The presence of human leukocyte antigen (HLA)-B27 is a common feature of all spondyloarthropathies, with approximately 90% patients of ankylosing spondylitis being positive. With the advent of imaging modalities like computed tomography (CT) and magnetic resonance imaging (MRI), increased awareness of this entity, and presence of new treatment options, more and more cases of spondyloarthropathy are being diagnosed at an early stage. It is essential for the radiologist to know the CT and MRI signs of spondyloarthropathy, as imaging plays an important role in diagnosis. Involvement of sacroiliac (SI) joint is considered a hallmark for diagnosis of seronegative spondyloarthropathy and is usually the first manifestation of this condition.[1,2,3,4,5] Thus, detection of sacroiliitis helps in early diagnosis and treatment. In this pictorial essay, we present the CT and MRI imaging findings in seronegative spondyloarthropathy-related sacroiliitis and highlight the common differentials that need to be considered.
Assessment of Spondyloarthritis International Society Criteria for Spondyloarthropathy
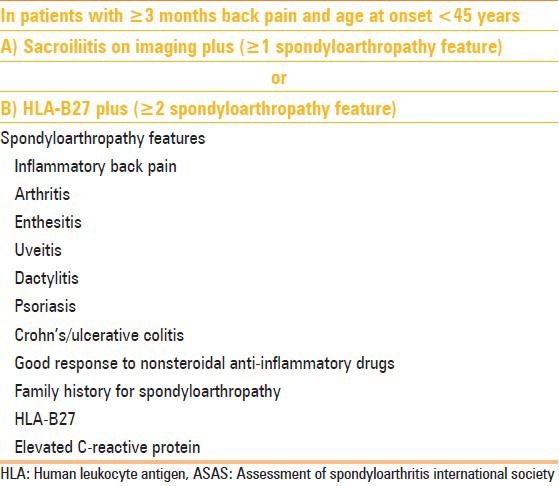
The Assessment of SpondyloArthritis international Society (ASAS) have developed a diagnostic criteria for axial spondyloarthropathy using a combination of clinical, imaging, and laboratory findings [Table 1].[3] According to the ASAS criteria, the imaging findings are based on demonstration of sacroiliitis on MRI and/or radiography. Radiography evaluation for sacroiliitis is based on changes defined according to the modified New York criteria. MRI is now recognized to play a pivotal role in the diagnosis of early sacroiliitis and for evaluation of response to treatment. According to the ASAS criteria, the MRI imaging features considered positive for spondyloarthropathy-related sacroiliitis include the following:
Table 1.
ASAS axial spondyloarthritis criteria
-
(a)
Sequence and signal-presence of bone marrow hyperintensity on short TI inversion recovery (STIR) images or contrast enhancement on fat-suppressed T1-weighted (T1W) images;
-
(b)
Site- periarticular or subarticular location; and
-
(c)
Number of lesions- two or more areas of bone marrow hyperintensity/enhancement on a single slice, or in cases of single area of bone marrow hyperintensity/enhancement, the area should be clearly seen on two consecutive slices.
Presence of structural lesions (erosions, sclerosis, subchondral fatty change, capsulitis, enthesitis, and bony bridges) alone on MRI in the absence of bone marrow edema is considered insufficient for the diagnosis of sacroiliitis according to the ASAS criteria, and this is considered to be a prominent limitation.[1,2]
Normal Anatomy of SI Joint
The SI joint has two parts, a lower ventral part which is predominantly cartilaginous and an upper dorsal part which is a fibrous joint [Figures 1 and 2]. The cartilaginous segment has smooth and parallel margins, while the fibrous segment shows irregular margins. Bone marrow edema in seronegative spondyloarthropathy-related sacroiliitis predominantly involves the lower and posterior part of the joint. Normal anatomic variants of SI joint include accessory SI joint (seen in the posterosuperior portion of the joint) [Figure 3], bipartite iliac bone plate [Figure 3], and iliosacral complex.[1]
Figure 1 (A and B).
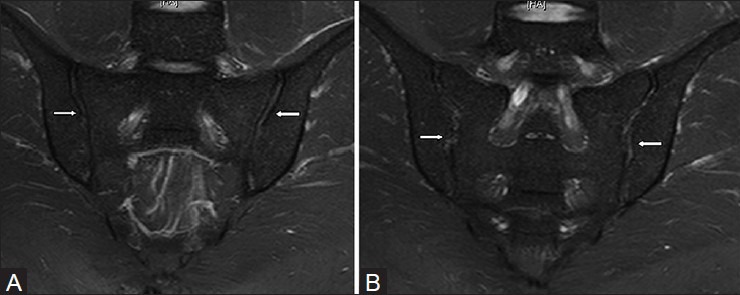
Normal anatomy of the sacroiliac joint in a 26 year old male. (A) Oblique coronal STIR MRI images show smooth and parallel margins of the cartilaginous lower ventral portion of the joint (arrows). (B) Oblique coronal STIR MRI images in more posterior aspect show irregular edges of the fibrous or ligamentous upper dorsal portion of the joint (arrows). Distinction between compartments of sacroiliac joints is possible on MRI images
Figure 2 (A-C).
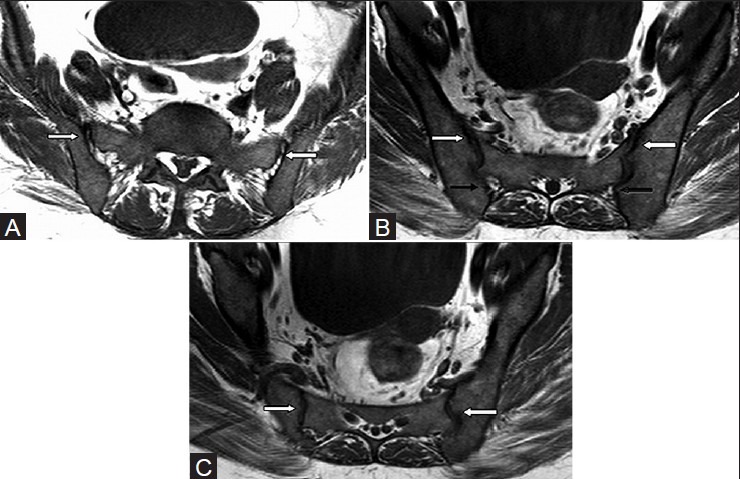
Normal anatomy of the sacroiliac joint. Axial T1W MRI images at three different levels in a 29 year male: (A) upper portion is predominantly ligamentous (arrows); (B) mid portion is cartilaginous in its anterior aspect (white arrow) and ligamentous in its posterior aspect (black arrows); (C) lower portion is cartilaginous only (white arrows)
Figure 3 (A and B).
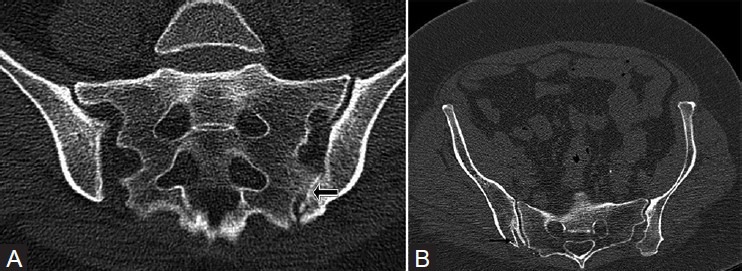
Anatomic variants of the sacroiliac joints. (A) Oblique coronal CT section of the sacroiliac joint in a 69 year old male shows left accessory sacroiliac joint (black arrow) with degenerative changes and osteophytes. (B) Oblique coronal CT image in a 58 year old female shows right bipartite iliac bone plates (black arrow)
Imaging Modalities for Evaluation of sacroiliitis - Advantages and Disadvantages
Conventional radiology
Radiography is considered to be a useful screening modality for sacroiliitis; however, plain radiographic changes are seen only after 5 years of disease activity.[2] Hence, it is not useful in detecting early disease in which treatment might help prevent disease progression.
CT
CT is a widely available and relatively less expensive imaging modality, compared to MRI. It can demonstrate erosions, sclerotic changes, and ankylosis better than MRI.[1,2,6] It is a useful modality for screening of early disease. However, radiation exposure is a concern and follow-up imaging for disease response should be done with MRI.
MRI
MRI can detect early findings of sacroiliitis like bone marrow edema, capsulitis, and enthesitis. Additionally, it forms an important component of the ASAS criteria. It is helpful in demonstrating the response to therapy and can detect the activity of disease (acute-on-chronic disease). However, it is a relatively expensive modality.
Imaging Protocol and Technique
CT
CT scan of SI joints involves multiplanar oblique coronal and oblique axial scans oriented parallel and perpendicular to the long axis of sacrum.
MRI
The basic protocol includes fast spin echo T1W and STIR T2-weighted (T2W) sequences in oblique, axial and coronal planes for evaluation of SI joint. Although noncontrast MRI findings are sufficient to diagnose spondyloarthropathy-related sacroiliitis, contrast MRI may demonstrate additional supportive signs of sacroiliitis like synovitis, capsulitis, and enthesitis. Post-contrast T1W images may be required in cases of doubtful sacroiliitis on non contrast MRI imaging. Additional fast spin echo T2W sagittal scan of lumbosacral spine and coronal STIR scan of pelvis including bilateral hips can be acquired to assess additional supportive features of seronegative spondyloarthropathy and screen for other causes of low backache.
Imaging Findings in Spondyloarthropathy- related Sacroiliitis on CT and MRI
CT findings
CT findings in spondyloarthropathy-related sacroiliitis [Figures 4 and 5] include the following:
Figure 4 (A-E).
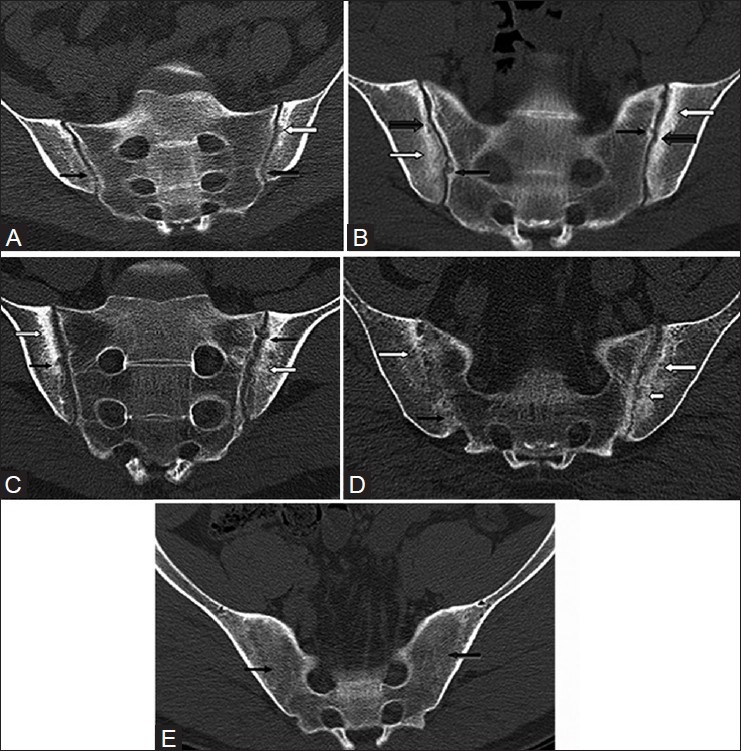
Sacroiliitis on CT. (A) Oblique coronal CT scan in a 27 year old male with ankylosing spondylitis shows erosion on the left iliac articular surface (white arrow) with bilateral diffuse reduction of joint spaces and blurring of the articular cortex (black arrows). (B) Oblique coronal CT scan in a 49 year old female with ankylosing spondylitis shows bilateral reduction in joint space, erosions on both iliac side (thick black arrows) and sacral side (thin black arrows), along with bilateral subchondral sclerosis (white arrows). (C) Oblique coronal CT scan in a 24 year old male with inflammatory bowel disease shows multiple erosions (black arrows), subchondral sclerosis (white arrows), and widening of the joint space bilaterally. (D) Coronal oblique CT scan in another patient shows bony bridges on the right side (black arrow), subchondral sclerosis on iliac sides bilaterally (white arrows), and erosions in the left ilium (small white arrow). (E) Coronal oblique CT scan in a 65 year old male with ankylosing spondylitis shows complete ankylosis of both sacroiliac joints (black arrows)
Figure 5 (A and B).
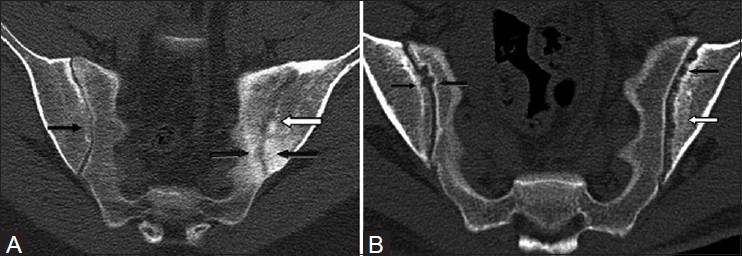
Asymmetrical sacroiliitis. (A) Coronal oblique CT scan in a 51 year old female with psoriasis shows bilateral diffuse reduction in joint spaces, blurring of articular cartilage on the right side (thin black arrow), multiple erosions in the left ilium (white arrow), and subchondral sclerosis on both iliac and sacral sides (thick black arrow). (B) Coronal oblique CT scan in another case shows multiple erosions in the left ilium (black arrow) with subchondral sclerosis (white arrow) and few erosions on the right iliac and sacral surfaces (black arrows)
Subchondral demineralization: It is considered to be an early sign and equivalent of subchondral bone marrow hyperintensity seen on MRI, but is a nonspecific finding
Erosions: Erosions are seen on the iliac side in early stage of the disease with later involvement of the sacral surface. Early involvement of the iliac surface is because of thinner cartilage on the iliac surface compared to the sacral surface. Erosions are associated with narrowing of joint space
Subchondral sclerosis: Sclerosis can be focal or diffuse, asymmetrical or symmetrical, measuring more than 5 mm on iliac surface[2]
Transarticular bony bridges and total ankylosis in late stage result in complete obliteration of the joint space.
MRI findings
MRI findings can be classified as those seen in acute, chronic, and acute-on-chronic stages.
Acute stage
Subchondral bone marrow edema [Figure 6–8]: It is considered to be an earliest imaging sign of sacroiliitis and forms an important component of the ASAS criteria. It can be symmetrical or asymmetrical and typically involves lower and posterior portion of the joint surface
Erosions: Erosions are defects in joint surface which can be subtle in the early stage. They involve iliac surface in the early stage with the sacral surface getting involved later
Synovitis and joint effusion: It is seen as hyperintensity within the joint. Contrast MRI can help differentiate synovitis from joint effusion by demonstrating enhancing synovium in synovitis[1,2,4,5]
Capsulitis and enthesitis: Capsulitis is inflammation of anterior and posterior capsules and seen on MRI as STIR hyperintensity or contrast enhancement of the capsule. Enthesitis represents inflammation involving the junctional interface of bone with ligaments and capsule. It is seen as junctional zone T2W hyperintensity which may extend into the surrounding soft tissue.[1,2,5]
Figure 8 (A-C).
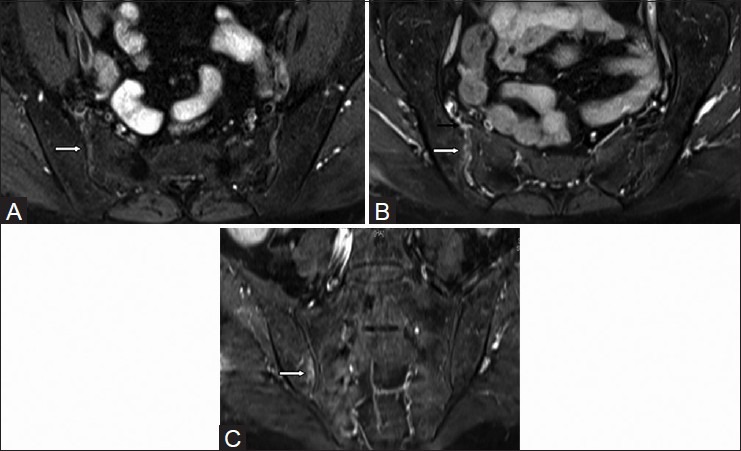
Findings of acute sacroiliitis on MRI - synovitis and marrow enhancement. Axial T1W fat-saturated (A) pre-contrast and (B) post-contrast MR images in a 52 year old female with psoriasis show enhancing joint synovium on the right side consistent with synovitis (white arrows); enhancement of anterior capsule is also seen (black arrow). (C) Coronal T1W fat-saturated post-contrast MR image shows subchondral bone marrow enhancement in the right iliac bone, findings consistent with active osteitis (white arrow)
Figure 6 (A-C).
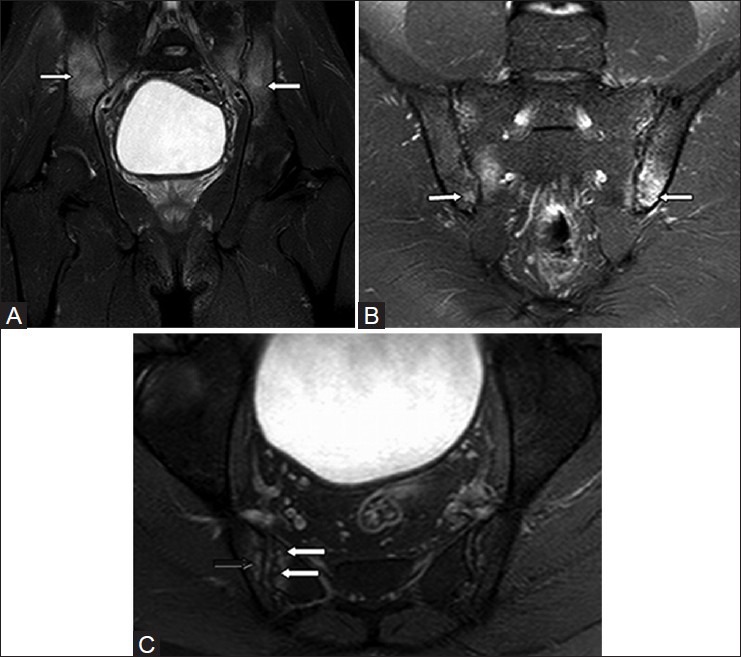
Findings of acute sacroiliitis on MRI – subchondral edema and erosions. (A) Coronal STIR MR image in a 21 year old female with ankylosing spondylitis shows bilateral symmetrical edema in the subchondral and inferior aspects of the sacroiliac joints (white arrows). (B) Oblique coronal STIR MR image of the sacroiliac joint shows bilateral symmetrical edema in the posteroinferior aspect of the joints (white arrows). (C) Axial STIR MR image through sacroiliac joints shows multiple erosions (white arrows) with subchondral edema (black arrow)
Figure 7 (A and B).
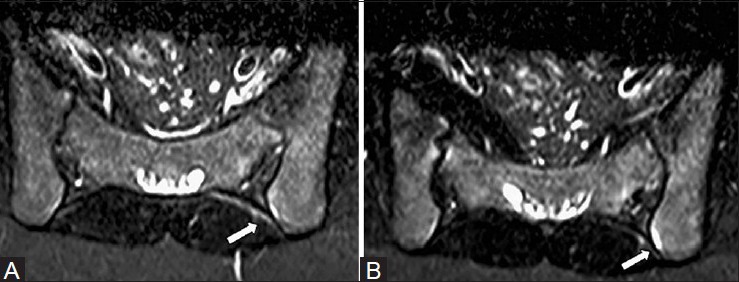
Findings of acute sacroiliitis on MRI – capsulitis and enthesitis. Axial oblique STIR images show (A) hyperintensity of the posterior capsule (white arrow) which represents capsulitis with (B) hyperintensity of the junctional interface of capsule and bone (white arrow) which represents enthesitis
Chronic stage
Subchondral fatty deposition [Figure 9]: It is an important indicator of chronic sacroiliitis. It is seen as subchondral T1W hyperintensity which gets suppressed on fat-saturated images. As an isolated finding, it is nonspecific and represents sequelae of previous inflammation. However, when associated with other findings like erosions, sclerosis, or bony bridging, it helps in diagnosing spondyloarthropathy-related sacroiliitis[1,2]
Subchondral sclerosis: Sclerosis is seen on both iliac and sacral subchondral surfaces, and is seen as T1W and T2W hypointensities on MRI. It should extend at least 5 mm from the SI joint surface
Erosions: Erosions are seen involving both iliac and sacral surfaces with associated joint space narrowing. Large confluent erosions may result in pseudo-widening of the joints
Bony bridges and total ankylosis: Fusion of joint surfaces is seen which may be focal, asymmetrical or symmetrical, and complete. The surrounding bone may show subchondral fatty changes.
Figure 9 (A-E).
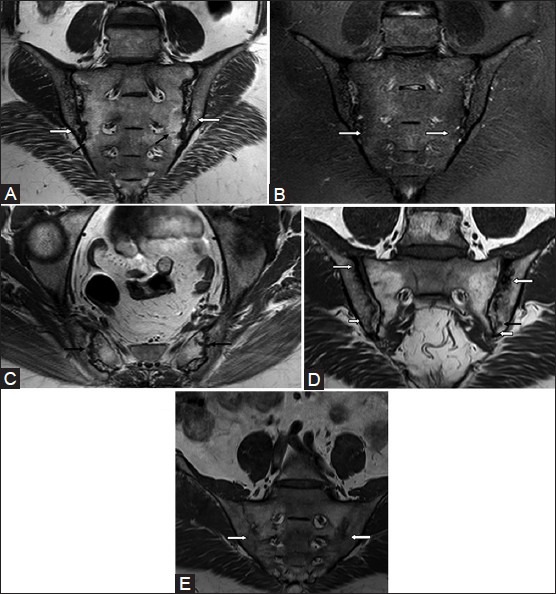
Findings of chronic sacroiliitis on MRI. (A) Coronal oblique T1W MR image without fat suppression in a 33 year old male with ankylosing spondylitis shows fatty deposition on both iliac (white arrows) and sacral surfaces (black arrows). (B) Corresponding coronal oblique STIR MR image shows suppression of fat signal (white arrows) without any edema. (C) Axial T1W MR image shows multiple subchondral erosions (black arrow). (D) T1W oblique coronal image without fat suppression in another patient shows subchondral sclerosis (thin white arrow), erosion (black arrow), and fatty deposition around the sacroiliac joint (short white arrow). (E) Coronal oblique T1W images without fat supression through sacroiliac joints show complete joint ankylosis (white arrows) in a 60 year old male with ankylosing spondylitis
Acute-on-chronic sacroiliitis
In the presence of acute-on-chronic sacroiliitis, subchondral bone marrow edema may be seen in a background of subchondral fat deposition and other signs of chronic sacroiliitis [Figure 10]. Active erosions may show underlying bone marrow edema and enhancement on post-contrast scans.
Figure 10 (A and B).
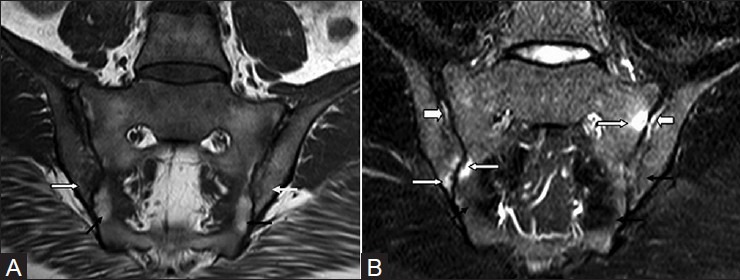
Acute-on-chronic sacroiliitis. (A) Coronal oblique T1W MR image without fat suppression in a 39 year old female with ankylosing spondylitis shows fat deposition on both sacral sides (black arrows) and iliac sides (white arrows). (B) Corresponding STIR images through sacroiliac joint show subchondral edema (active sacroiliitis) (white arrows), areas of fat suppression (chronic sacroiliitis) (black arrows), and synovitis (thick white arrows)
Associated Findings
Additional findings, when seen in the surrounding structures in the imaging field, can add substantial value to the diagnosis of spondyloarthropathy. Additional CT and MRI findings [Figures 11 and 12] in routine SI joint protocol include the following:
Figure 11 (A and B).
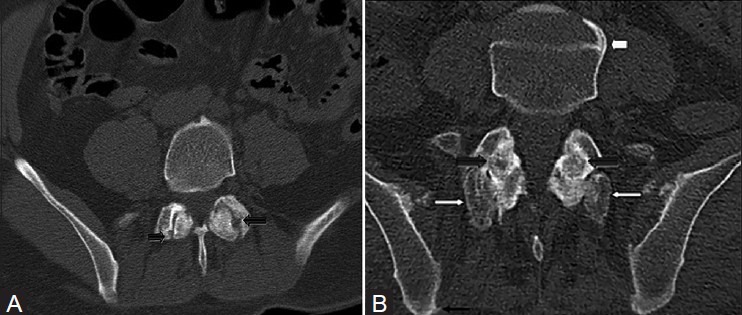
Associated findings in seronegative spondyloarthropathy-related sacroiliitis on CT scan. (A) Axial CT sections in a 51 year old male with sacroiliitis shows erosions in the bilateral facet joints (black arrows). (B) Coronal oblique CT scan in another patient shows bridging syndesmophytes (thick white arrow), facet ankylosis (thick black arrows), and enthesitis (thin black arrow) with periarticular ossification adjacent to facet joints (thin white arrows). Detection of any of these findings in the imaging field in patients with sacroiliitis can support a diagnosis of seronegative spondyloarthropathy
Figure 12 (A-E).
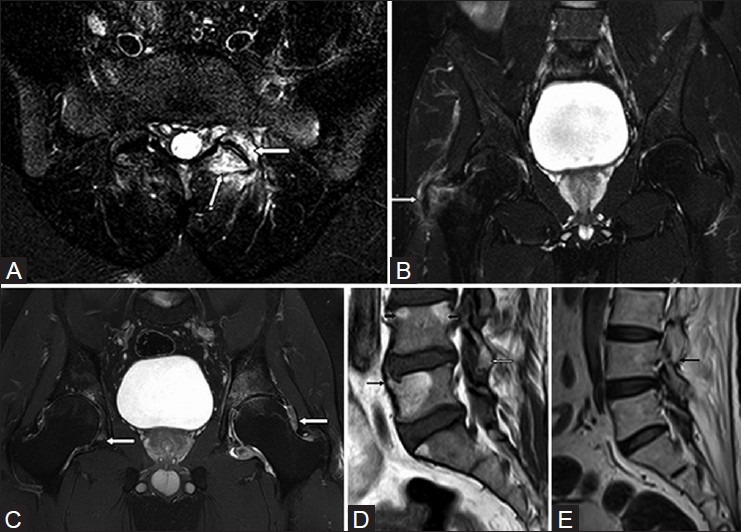
Associated findings in seronegative spondyloarthropathy-related sacroiliitis on MRI. (A) Axial STIR MR image at L5-S1 shows left facetal joint subchondral edema (white arrows). (B) Coronal STIR MR image through both hip joints shows edema at tendinous insertion in the right greater tuberosity of femur, suggestive of enthesopathy (white arrow). (C) Coronal STIR MR image through both hip joints shows minimal joint effusion with prominent synovial thickening indicating synovitis (white arrows). (D) Sagittal T1W MR image of lumbosacral spine shows bridging syndesmophyte (thin black arrow), fatty deposition at the superior aspect of anterior and posterior margins of L4 vertebral body indicating shiny corner sign (thick black arrow), and fatty deposition around L4-5 facet joint (white arrow). (E) Sagittal T1W MR image of lumbosacral spine shows ankylosis of the facet joint (black arrow). Detection of any of these findings in the imaging field in patients with sacroiliitis can support a diagnosis of seronegative spondyloarthropathy
Facetal arthropathy: It is seen as facet joint erosions, facetal osteophytes, and parafacetal ossification on CT. On MRI, facet joint effusion, facet joint fusion, bone marrow edema, and fatty changes in the superior and inferior facets are seen
Enthesitis: Screening of pelvis may show significant T2W hyperintensity due to enthesitis at greater trochanter and ischial tuberosity[7]
MRI corner sign and bridging syndesmophytes: Bone marrow edema involves the anterior and posterior corners of the lower lumbar vertebrae in the acute stage and fatty deposition in the chronic stage.[8] Bridging anterior and posterior syndesmophytes may be seen
Hip joint effusion: Spondyloarthropathy can have associated hip joint effusion and synovitis.[7]
Differentials
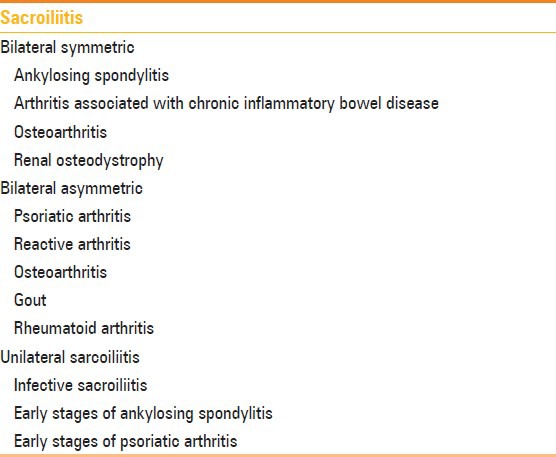
Imaging differentials that need to be considered when evaluating for spondyloarthropathy-related sacroiliitis include the following [Table 2]:
Table 2.
Differentials for sacroiliitis depending upon pattern of involvement
Infective sacroiliitis: Infectious sacroiliitis [Figure 13] should be considered in the presence of unilateral joint involvement and disproportionate bone marrow edema involving either iliac or sacral surface with presence of collection extending into the surrounding soft tissue. However, it is important to note that in some early cases of spondyloarthropathy-related sacroiliitis, unilateral joint edema with disproportionate iliac side edema can be seen.[9] In such cases, the presence of surrounding soft tissue collection favors an infective etiology. Infective sacroiliitis is treated with antibiotics based on the organism isolated by CT-guided joint fluid/soft tissue collection aspiration and blood cultures
Osteitis condensans ilii [Figure 14]: It can resemble subchondral sclerosis seen in chronic stages of sacroiliitis on both CT and MRI. It is commonly seen in multiparous woman. Sclerosis is seen to involve the bilateral iliac surfaces in the absence of bone marrow oedema, erosions, and joint space narrowing
Degenerative changes [Figure 15]: It is associated with marginal osteophytes, periarticular joint space narrowing, and subchondral cysts in the absence of erosion. The area of involvement is typically anterior and middle half of the SI joint compared to involvement of posterior third in spondyloarthropathy-related sacroiliitis[2]
Stress fracture [Figure 16]: Stress fractures can present with unilateral or bilateral sacral bone marrow edema. Non-involvement of iliac surface and visualization of the distinct fracture line helps in differentiation
Diffuse idiopathic skeletal hyperostosis (DISH) [Figure 17]: Synovial portion of the SI joints is normal with ossification of the iliolumbar ligaments and anterior and superior articular portions of the SI joint. Spine shows characteristic flowing ossifications along the anterolateral aspect of at least 4 contiguous vertebrae[10]
Hyperparathyroidism [Figure 18]: Hyperparathyroidism can present with bilateral symmetric or asymmetric SI joint widening with subchondral erosions. Presence of abnormal bone density, subperiosteal, subligamentous erosions, and involvement of other bones helps in differentiation.
Figure 13 (A-D).
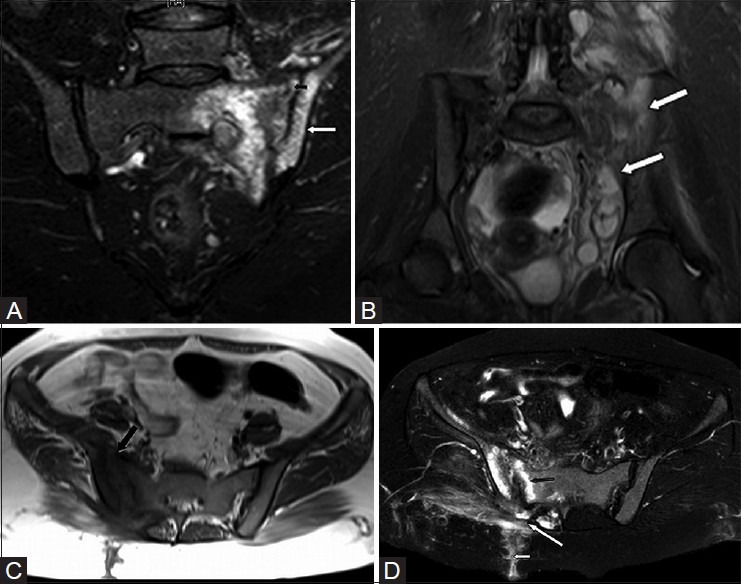
Infective sacroiliitis. (A) Oblique coronal STIR MR image through sacroiliac joint in a 19 year old female shows left sacroiliitis with bone marrow edema (white arrow) and widening of joint space (black arrow). (B) Coronal STIR MRI image of pelvis shows muliple surrounding hyperintense collections suggesting infective sacroiliitis (white arrow). (C) Axial T1W MRI image in another patient with infective sacroiliitis shows right sacroiliitis with bone marrow edema, subchondral erosions, and joint space widening (black arrow). (D) Axial T2W MRI image in the same patient shows bone marrow edema, subchondral erosions, and joint space widening (black arrow) with multiple surrounding hyperintense soft tissue collections in the right gluteal region (long white arrow) and sinus tract extending upto the overlying skin (short white arrow)
Figure 14 (A and B).

Osteitis condensans ilii. (A) Oblique coronal CT scan through sacroiliac joint in a 31 year old female shows triangular area of subchondral sclerosis on iliac sides (white arrows) with smooth articular surfaces. (B) Corresponding oblique coronal T1W image without fat suppression shows triangular area of subchondral sclerosis with normal articular surfaces (white arrow)
Figure 15.
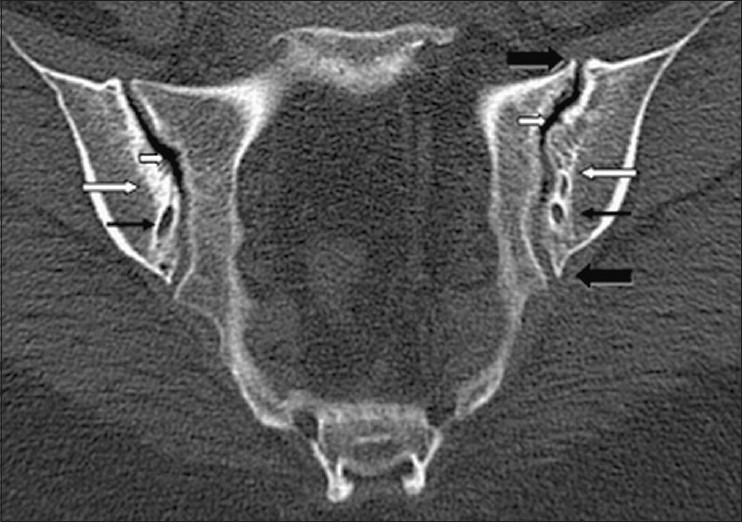
Degenerative arthrosis in sacroiliac joints. Oblique coronal CT scan shows osteophytes (thick black arrows), subchondral cyst (thin black arrow), vaccum phenomenon (short white arrow), and subchondral sclerosis (long white arrow)
Figure 16 (A and B).
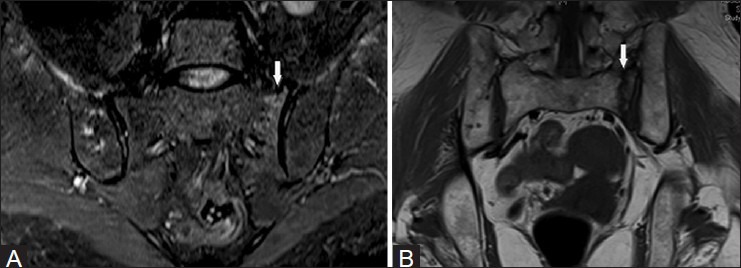
Stress fracture. (A) Oblique coronal STIR MR image in a 70 year old female with left hip pain shows minimal degree of edema in the subchondral region in left sacrum (white arrow). (B) Corresponding T1W coronal image without fat suppression shows hypointense fracture line (white arrow)
Figure 17 (A-D).
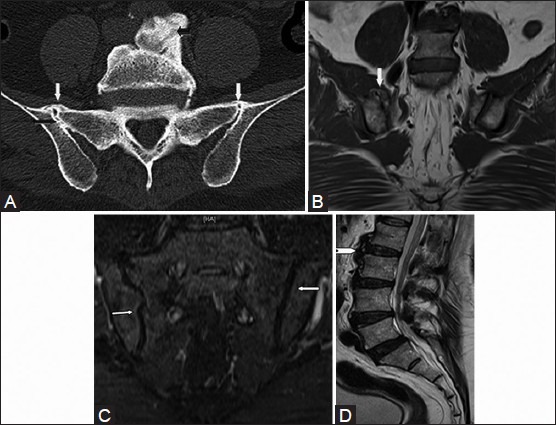
DISH. (A) Oblique coronal CT scan through sacroiliac joint shows bridging osteophytes in the superior aspect of joint (white arrows), asymmetrical intra-articular fusion of right sacroiliac joint (long black arrow), and flowing anterior osteophytes (short black arrow). (B) T1W coronal MR images show bridging osteophytes in the superior aspect on the right side (white arrow). (C) Corresponding coronal STIR image shows smooth articular surfaces of bilateral sacroiliac joint without erosions (white arrows) and (D) T2W sagittal image through lumbosacral spine shows flowing ossification in the anterior aspect of the vertebral body (white arrow head)
Figure 18 (A-C).
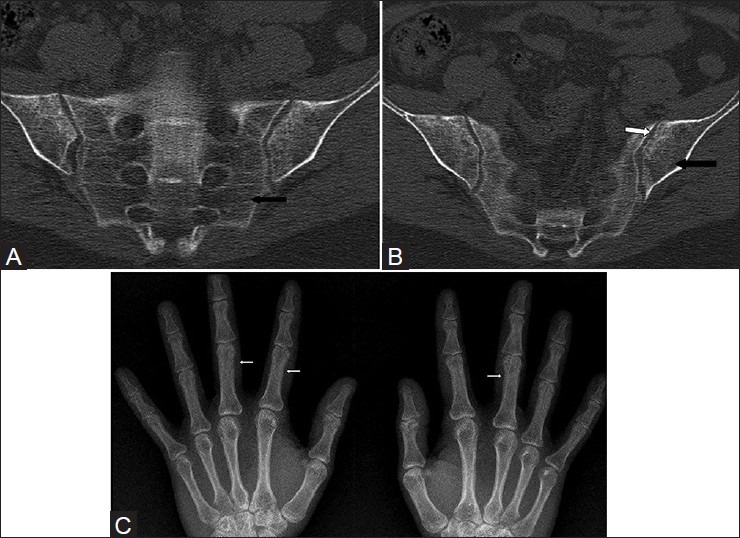
Hyperparathyroidism. Oblique coronal CT scan images through sacroiliac joint in a 40 year old female (A, B) show diffuse osteopenia (black arrows) with subchondral erosions (white arrows). Bilateral hand radiographs (C) in the same patient demonstrate generalized osteopenia with subperiosteal bone resorption (white arrows) particularly involving the radial aspects of the second and third middle phalanges
Conclusion
CT and MRI are important imaging modalities in early diagnosis of spondyloarthropathy-related sacroiliitis. MRI is particularly helpful in demonstrating early findings of the disease, activity of the disease, and response to treatment. Awareness of CT and MRI findings of spondyloarthropathy-related sacroiliitis in different stages is essential for diagnosis and treatment of this condition.
Footnotes
Source of Support: Nil
Conflict of Interest: None declared.
References
- 1.Navallas M, Ares J, Beltrán B, Lisbona MP, Maymó J, Solano A. Sacroiliitis associated with axial spondyloarthropathy: New concepts and latest trends. Radiographics. 2013;33:933–56. doi: 10.1148/rg.334125025. [DOI] [PubMed] [Google Scholar]
- 2.Canella C, Schau B, Ribeiro E, Sbaffi B, Marchiori E. MRI in seronegative spondyloarthritis: Imaging features and differential diagnosis in the spine and sacroiliac joints. AJR Am J Roentgenol. 2013;200:149–57. doi: 10.2214/AJR.12.8858. [DOI] [PubMed] [Google Scholar]
- 3.Van den Berg R, Van der Heijde DM. How should we diagnose spondyloarthritis according to the ASAS classification criteria: A guide for practicing physicians. Pol Arch Med Wewn. 2010;120:452–7. [PubMed] [Google Scholar]
- 4.Bredella MA, Steinbach LS, Morgan S, Ward M, Davis JC. MRI of the sacroiliac joints in patients with moderate to severe ankylosing spondylitis. AJR Am J Roentgenol. 2006;187:1420–6. doi: 10.2214/AJR.05.1423. [DOI] [PubMed] [Google Scholar]
- 5.Lacout A, Rousselin B, Pelage JP. CT and MRI of spine and sacroiliac involvement in spondyloarthropathy. AJR Am J Roentgenol. 2008;191:1016–23. doi: 10.2214/AJR.07.3446. [DOI] [PubMed] [Google Scholar]
- 6.Guglielmi G, Scalzo G, Cascavilla A, Carotti M, Salaffi F, Grassi W. Imaging of the sacroiliac joint involvement in seronegative spondylarthropathies. Clin Rheumatol. 2009;28:1007–19. doi: 10.1007/s10067-009-1192-1. [DOI] [PubMed] [Google Scholar]
- 7.Eshed I, Bollow M, McGonagle DG, Tan AL, Althoff CE, Asbach P, et al. MRI of enthesitis of the appendicular skeleton in spondyloarthritis. Ann Rheum Dis. 2007;66:1553–9. doi: 10.1136/ard.2007.070243. [DOI] [PMC free article] [PubMed] [Google Scholar]
- 8.Kim NR, Choi JY, Hong SH, Jun WS, Lee JW, Choi JA, et al. “MR corner sign”: Value for predicting presence of ankylosing spondylitis. AJR Am J Roentgenol. 2008;191:124–8. doi: 10.2214/AJR.07.3378. [DOI] [PubMed] [Google Scholar]
- 9.Bollow M, Hermann KG, Biedermann T, Sieper J, Schontube M, Braun J. Very early spondyloarthritis: Where the inflammation in the sacroiliac joints starts. Ann Rheum Dis. 2005;64:1644–6. doi: 10.1136/ard.2004.034967. [DOI] [PMC free article] [PubMed] [Google Scholar]
- 10.Taljanovic MS, Hunter TB, Wisneski RJ, Seeger JF, Friend CJ, Schwartz SA, et al. Imaging characteristics of diffuse idiopathic skeletal hyperostosis with an emphasis on acute spinal fractures: Review. AJR Am J Roentgenol. 2009;193(Suppl 3):S10–9. doi: 10.2214/AJR.07.7102. Quiz S20-4. [DOI] [PubMed] [Google Scholar]


