Abstract
Literature data indicate that bone is a major storage organ for manganese (Mn), accounting for 43% of total body Mn. However, the kinetic nature of Mn in bone, especially the half-life (t1/2), remained unknown. This study was designed to understand the time-dependence of Mn distribution in rat bone after chronic oral exposure. Adult male rats received 50 mg Mn/kg (as MnCl2) by oral gavage, 5 days per week, for up to 10 weeks. Animals were sacrificed every two weeks during Mn administration for the uptake study, and on day 1, week 2, 4, 8, or 12 after the cessation at 6-week Mn exposure for the t1/2 study. Mn concentrations in bone (MnBn) were determined by AAS analysis. By the end of 6-week’s treatment, MnBn appeared to reach the steady state (Tss) level, about 2–3.2 fold higher than MnBn at day 0. Kinetic calculation revealed t1/2s of Mn in femur, tibia, and humerus bone of 77 (r=0.978), 263 (r=0.988), and 429 (r=0.994) days, respectively; the average t1/2 in rat skeleton was about 143 days, equivalent to 8.5 years in human bone. Moreover, MnBn were correlated with Mn levels in striatum, hippocampus, and CSF. These data support MnBn to be a useful biomarker of Mn exposure.
Keywords: Manganese, Biomarker, Bone, Half-life, Disposition
1. Introduction
Occupational exposure to manganese (Mn), such as in mining, smelting, welding or dry-cell battery production, has been associated with a neurodegenerative parkinsonian disorder clinically called manganism (Barbeau et al., 1976; Chandra et al., 1981; Crossgrove and Zheng, 2004; Jiang et al., 2006). Environmental exposure to this toxic metal has also been linked to the consumption of Mn-containing pesticides and contamination in drinking water and food (Bouchard et al., 2011). Addition of Mn to gasoline as the anti-knocking reagent, methylcyclopentadienyl Mn tricarbonyl (MMT) further raises concerns about health risks associated with a potential increase in environmental levels of Mn (Butcher et al., 1999; Sierra et al., 1995). Recently, increasing numbers of cases of Mn-induced Parkinsonism have been observed among drug addicts using ephedrone (Sikk et al., 2011). It is because of rising public health concerns that a thorough understanding of Mn neurotoxicity, including its distribution in the body and mechanism of action, is well justified.
Patients suffering from manganism have signs and symptoms closely resembling, but not identical to, Parkinson’s disease (PD) (Aschner et al., 2007; Jiang et al., 2006; Racette et al., 2012). Recent data also show that Mn may play a role in PD etiology (DeWitt et al., 2013; Lucchini et al., 2007). Since clinically manifested Mn neurotoxicity is usually progressive and irreversible, early diagnosis becomes critical to treatment and prevention of Mn intoxication. Historically, searches for biomarker(s) of Mn exposure and health risk have focused on Mn concentrations in blood, urine, and/or nail. These biomarkers, however, are of limited use for exposure assessment in that primarily intracellular accumulation of Mn renders blood, urine, or nail Mn levels inaccurate in reflecting the true body burden of Mn (Apostoli et al., 2000; Zheng and Monnot, 2012). For example, in group comparisons among active workers, blood Mn has some utility for distinguishing exposed from unexposed subjects; yet a large variability in mean values renders it insensitive for discriminating one individual from the rest of the study population. Human studies using magnetic resonance imaging (MRI), in combination with non-invasive assessment of γ-aminobutyric acid (GABA) by MR spectroscopy (MRS), have provided evidence of Mn exposure in patients devoid of clinical symptoms of Mn intoxication (Dydak et al., 2011; Jiang et al., 2007). These methods, however, do not provide an adequate estimation of Mn body burden in a long-term, low-dose Mn exposure scenario (Zheng and Monnot, 2012). Thus, to date, a reliable biomarker to accurately reflect Mn exposure or body burden remains unavailable.
Data in literature suggest that, at normal physiological conditions, Mn accumulates extensively in human bone tissues (Pejovic-Milic et al., 2009; Schroeder et al., 1966; Zaichick et al., 2011). Schroeder et al. (1966) observed an average concentration of 2 mg/kg of Mn in bone ash, which gives rise to about 32.5% of body Mn in bone, according to our recent calculation (Liu et al., 2013). The International Commission on Radiological Protection (ICRP) has reported approximately 40% of body Mn accumulates in bone (ICRP, 1972). Information from animal studies of Mn accumulation in bone can be found in literature, albeit is very limited (Dorman et al., 2005; Seaborn and Nielsen, 2002). Using a physiologically-based pharmacokinetic modeling approach, Andersen et al. (1999) reported that Mn stored in bone tissues contributed to over 40% of body Mn; the estimate is closer to the aforementioned human data. Studies by Furchner et al. (1966) using radioactive 54Mn administered orally to rats at a normal physiological dose have found that the radioisotope in bone had a half-life of more than 50 days, which was much longer than the 54Mn half-life in other rat tissues. Another study by Newland et al. (1987) in primates using 54Mn reported that Mn had a relatively long half-life of about 220 days in the whole head after inhalation exposure. In the same study, the researchers found that the half-life of 54Mn in brain tissues from the same animals was much shorter; hence they ascribed a long half-life of 54Mn in the head to 54Mn present in the skull or to replenishment from other depots (Newland et al., 1987). These data have clearly established that bone is one of the major organs for long-term storage of Mn in the body. Thus, a reliable assessment of Mn health benefits or risks should take into account the extensive Mn deposition in bone. However, knowledge on the rate of Mn accumulation in human or animal bone, and the pertinent biological half-life of Mn in bone was incomplete.
Recent advances in neutron activation-based detection technology has made it possible to develop a transportable neutron activation analysis (NAA) system for quantifying MnBn (Liu et al., 2013). This highly innovative technique uses a portable deuterium–deuterium (DD) neutron generator (as the neutron source) to detect Mn in bone, non-invasively and in real time, in human subjects. To support this technical innovation, there was a need to understand the toxicokinetics of Mn in bone under a long-term, low-dose exposure condition. The current study is part of a larger research effort at Purdue University (Liu et al., 2013) to use MnBn as a reliable biomarker for the noninvasive assessment of Mn body burden in humans.
The purposes of the current study were to (1) characterize the time-dependent accumulation of Mn in rat bone following chronic oral administration of Mn to animals; (2) determine the elimination t1/2 of Mn in bone tissues; (3) investigate if bone samples collected from different body parts had similar or different kinetic characteristics; and (4) seek the correlations between MnBn and Mn concentrations in select brain regions known to be targets of Mn neurotoxicity. Understanding the time-dependent changes of tissue distribution of Mn within bone, central nervous system (CNS), and other tissues will help discover a novel biomarker suitable for the assessment of Mn exposure in humans.
2. Materials and Methods
2.1 Chemicals
Chemical reagents were purchased from the following sources: Mn chloride tetrahydrate (MnCl2•4H2O) from Fisher Scientific (Pittsburgh, PA); Mn and Cu standard solutions were from SCP Science (Champlain, NY); ketamine from Fort Dodge (Fort Dodge, IA ); and xylazine from Vedco (St. Joseph, MO). All reagents were analytical grade, HPLC grade, or the best available pharmaceutical grade.
2.2 Experimental design
The overall experimental design is illustrated below:

Phase 1 studies were designed to determine the time course of Mn accumulation in bone. Rats received daily administration of 50 mg Mn/kg as MnCl2 by oral gavage, 5 days per week for the period of time specified in the above illustration. In this phase, dose administration lasted up to 10 weeks with cohorts of animals sacrificed every two weeks to determine the steady state Mn concentrations (Tss) in bone following oral exposure.
Phase 2 studies were designed to determine the elimination t1/2 of Mn from bone tissues. The results from phase 1 suggest a Tss was reached by 6 weeks of continuous Mn exposure. After the last dose of the week-6 dose administration, animals were sacrificed at 24 hours, 2 weeks, 1, 2 and 3 months to determine t1/2 of MnBn.
2.3 Animals and Mn administration
Male Sprague Dawley rats were purchased from Harlan Laboratories, Inc. (Indianapolis, IN). Upon arrival, animals were housed in a temperature-controlled, 12-h light/dark cycle room and allowed to acclimate for one week prior to experimentation. At the time of use, rats were 8 weeks old and weighed 220–250 g. Animals had ad libitum access to filtered tap water and pelleted rat chow (Harlan Teklad 2018 Diet, Harlan Laboratories). The studies were approved by the Institutional Animal Care and Use Committee at Purdue University.
MnCl2•4H2O dissolved in sterile saline was administrated to rats by oral gavage of 50 mg Mn/kg, once per day, 5 days per week, for up to 10 weeks. This dose regimen was selected based on our preliminary study showing plasma Mn concentration of ~25 μg/L after 2-week oral doses, which is comparable to blood Mn levels in Mn-exposed human subjects. Earlier human studies indicate that Mn-poisoned workers usually have blood Mn concentrations between 4–15 μg/L (Inoue and Makita, 1996; Vezér et al., 2007). Our own human study among 39 Mn-poisoned welders in Beijing reveals that the welders with a distinct manganism have a blood Mn level in the range of 8.2–36 μg/L (Crossgrove and Zheng, 2004). Thus, a continuous daily oral gavage at 50 mg/kg would likely result in a steady-state blood concentration similar to chronic occupational exposure in humans. The daily equivalent volume (4 ml/kg) of sterile saline was given to control animals. Twenty-four hours after the last injection, rats were anesthetized with ketamine/xylazine (75:10 mg/kg; 1 mg/kg, ip). CSF samples, free of blood, were collected using a 26G butterfly needle inserted between the protuberance and the spine of the atlas, and blood samples were obtained from the descending aorta and processed for plasma. Rat brains were dissected to harvest choroid plexus from lateral and third ventricles, hippocampus (HP), striatum (ST) and frontal cortex (FC). Samples were stored at −80°C for later analysis.
2.4 Determination of Mn, Fe, Cu and Zn concentrations by AAS
All brain and bone samples were digested with concentrated ultrapure nitric acid in a MARSXpress microwave-accelerated reaction system. Plasma and CSF samples were digested overnight with nitric acid in a drying oven at 55°C. An Agilent Technologies 200 Series SpectrAA with a GTA 120 graphite tube atomizer was used to quantify Mn, Fe, Cu and Zn concentrations. Digested samples were diluted 50, 500, or 1000 times with 1.0% (v/v) HNO3 in order to keep the readings within the concentration range of the standard curves. Ranges of calibration standards were 0–5 μg/l for Mn, 0–10 μg/l for Fe, and 0–25 μg/l for Cu and Zn. Detection limits for Mn, Fe, Cu and Zn were 0.09 ng/ml, 0.18 ng/ml, 0.9 ng/ml, and 0.28 ng/ml, respectively, of the final assay solution (Zheng et al., 1998, 1999, 2009).
2.5 Toxicokinetic and Statistics analysis
Values of MnBn from various body parts were plotted as a function of time. Calculation of the terminal-phase elimination rate constant (Ke) was based on the assumption of first-order elimination kinetics (Gibaldi and Perrier, 1982; Zheng et al., 2001). A linear regression analysis was used to estimate the Ke of individual curves obtained from different body bones, from which the t1/2 was obtained using the following equation:
All data are expressed as mean ± S.D.; statistical analyses of the differences between groups were carried out by one-way ANOVA with post hoc comparisons by Dunnett’s test or Student’s t-test using SPSS for Windows (version 20.0). The differences between the two means were considered significant if p values were equal to or less than 0.05.
3. Results
3.1 Increased Mn concentrations in body fluids after Mn exposure
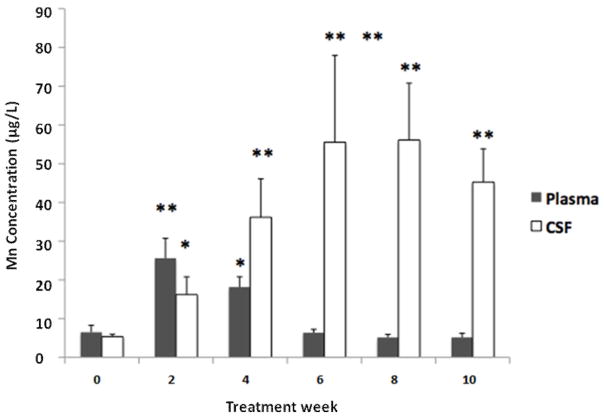
Following oral chronic Mn exposure, the plasma concentrations of Mn were significantly increased compared to baseline (week 0) after only two weeks of Mn exposure (Fig. 1). After 4 weeks of Mn dosing, plasma Mn concentration remained significantly higher compared to the baseline, but it declined from the 2-week value (Fig. 1). Plasma Mn concentrations were not significantly different after 6, 8, or 10 weeks of Mn exposure as compared to the baseline. Similarly, Mn concentration in CSF was significantly increased compared to baseline after 2 weeks of Mn exposure (p < 0.05; Fig. 1). Interestingly, Mn concentrations in CSF samples remained significantly higher at 4, 6, 8, and 10 weeks of dosing in comparison to the baseline value (p<0.01; Fig. 1). Between the sixth and eighth weeks of Mn exposure, Mn levels in the CSF appeared to plateau.
Fig. 1.
Time course of Mn concentrations in plasma and cerebrospinal fluid (CSF) following chronic oral Mn exposure.
Rats received 50 mg Mn/kg as MnCl2 by oral gavage once daily, five days per week for the time indicated. Mn concentrations in plasma and CSF were determined by AAS. Data represent mean ± S.D., n = 5–6; *: p < 0.05, **: p < 0.01.
3.2 Increased Mn concentrations in bones after Mn exposure
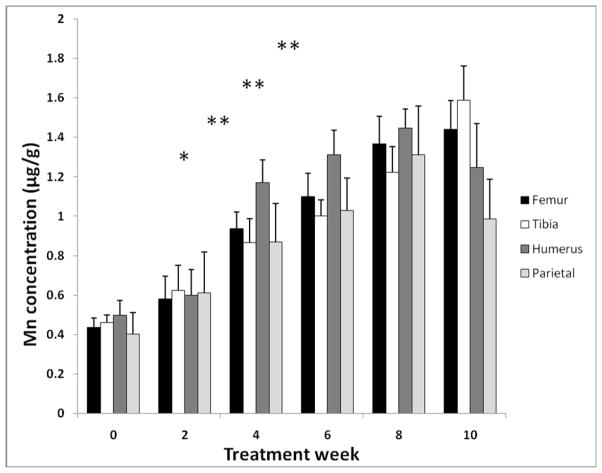
Mn accumulation in bone was investigated in bone samples including femur, tibia, humerus, and parietal bones. While chronic Mn oral exposure did not significantly affect animals’ body weights after 6 weeks exposure, the weight of femur bones was significantly reduced compared to controls (−8.5%, p<0.01; Table 1). Concentrations of Mn in bone appeared to be elevated after only two-weeks of exposure, although the values were not statistically significant (Fig. 2). After 4-weeks of exposure, a significant accumulation of Mn in bone was observed in all bone samples (p<0.05; Fig. 2). This increase in Mn accumulation in all bone samples continued until the 8th week of Mn exposure. Since there were no statistically significant differences between the data points from the 6th-, 8th- or 10th-week bone samples, MnBn appeared to reach the steady state (Tss) concentration after 6-weeks of Mn exposure (Fig. 2).
TABLE 1.
Changes of Total Body Weight and Femur Bone Weight s after Chronic Oral Mn Exposure in Rats
| Body Weight | Bone Weight | |||
|---|---|---|---|---|
| Day 0 | 18 Weeks | Day 0 | 18 Weeks | |
| Control | 261.6 ± 5.22 | 354.9 ± 16.24 | 1.07 ± 0.13 | 1.30 ± 0.02 |
| Mn-treated | 268.4 ± 8.65 | 352.13 ± 9.96 | 1.21 ± 0.38 | 1.19 ± 0.01* |
Rats received 50 mg Mn/kg as MnCl2 by oral gavage once daily, five days per week, for 6 weeks. Mn concentrations were determined by AAS. Data represent mean ± S.D., n = 5–6;
p < 0.05.
Fig. 2.
Time-dependent accumulation of Mn in rat bones after chronic oral Mn exposure. The animal treatment regimen is described in the legend to Fig. 1.
Mn concentrations in various bone samples were determined by AAS. Data represent mean ± S.D., n = 5–6; *: p < 0.05, **: p < 0.01 indicating group comparisons made between samples collected at times after Mn exposure and samples at time 0.
3.3 Mn t1/2 in rat bones
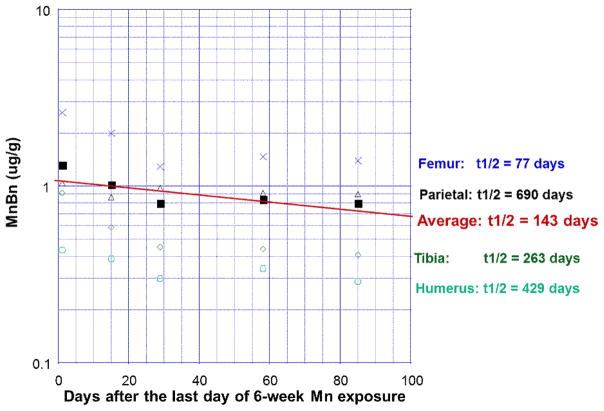
To determine the elimination t1/2, animals were exposed to Mn for 6 weeks until the Tss was reached. Bone tissues were then dissected at 24 hours, 2 weeks, 1, 2 and 3 months following exposure cessation for AAS quantification of Mn concentrations in femur, tibia, humerus, and parietal bone. Average values for each type of bone were plotted on a semi-log scale over time to yield four separate regression lines. The slopes of these regression lines were taken as the individual elimination rate constant Ke and used to calculate the MnBn t1/2 for each bone type. Our calculations result in t1/2s of 77, 263, 429, and 690 days for femur, tibia, humerus, and parietal bones, respectively. To estimate the Mn t1/2 in the whole rat skeleton, the values for all bones at each time point were averaged. Following the same procedure used to calculate the t1/2 in individual bones, the average MnBn t1/2 was estimated to be approximately 143 days (Fig. 3).
Fig. 3.
Terminal phase elimination half-Life (t1/2) of Mn in bones following chronic oral Mn exposure. Rats received 50 mg Mn/kg as MnCl2 by oral gavage once daily, five days per week for 6 weeks. Groups of animals were sacrificed at the times indicated. The values of MnBn were plotted as a function of time; the elimination rate constants were estimated by linear regression analysis, and used to calculate the elimination t1/2. To estimate average t1/2 in rat skeleton, all values at each time point were averaged and the linear regression method was then used.
3.4 Correlations between MnBn and Mn concentrations in selected brain regions
To test the hypothesis that Mn stored in bone tissues may serve as the internal source of Mn in brain, a linear regression method was used to correlate Mn concentrations in the striatum and hippocampus with MnBn from the same animals. Since the choroid plexus in brain ventricles transports metals and secretes the CSF, which provides the internal milieu of the CNS (Zheng et al. 2003), the correlations between MnBn and Mn concentration in choroid plexus and CSF collected from the same animals were also investigated. The results showed that there were strong correlations between MnBn and Mn levels in striatum (correlation coefficient r=0.7549, p<0.001) and hippocampus (r=0.7823, p<0.001). Interestingly, the Mn concentration in the choroid plexus was also strongly associated with MnBn (r=0.6519, p<0.001), so was the correlation between MnBn and CSF (r=0.7204, p<0.001), suggesting that bone could potentially serve as an endogenous source of Mn to the body and CNS (Fig. 4).
Fig. 4.
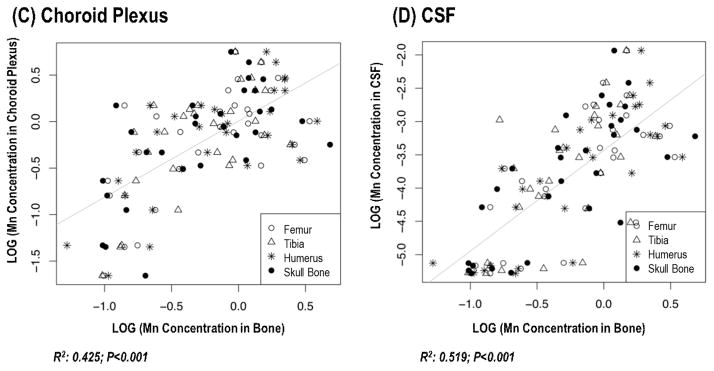
Changes of Mn concentrations in brain, choroid plexus and CSF as a function of MnBn.
The animal treatment regimen is described in the legend to Fig. 1. Mn concentrations in all tissues were determined by AAS. Liner regression was used to estimate the correlation coefficients.
3.5 Correlations between MnBn and concentrations of Fe, Cu, and Zn in rat skeleton
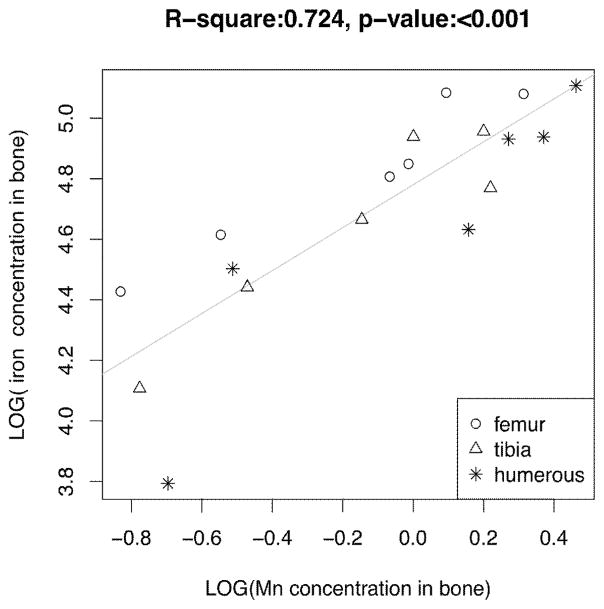
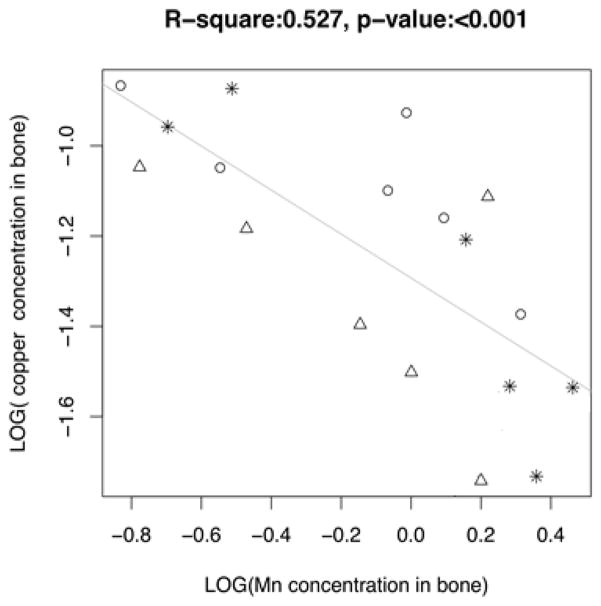
To understand how Mn accumulation in bone affects accumulation of other metals, such as Fe, Cu, and Zn in the rat skeleton, the linear regression method was again used to correlate MnBn with concentrations of Fe, Cu, and Zn in femur, tibia, and humerus bones from the same animals. The results showed there were strong positive correlations between MnBn and Fe levels in the rat bones (r=0.8509, p<0.001), and MnBn and Zn (r=0.7510, p<0.001), but an inverse correlation between MnBn and Cu (r=−0.7259, p<0.001) (Fig. 5). The results suggested that Mn accumulation in bone likely affected other essential metals in bone.
Fig. 5.
Changes of Fe, Cu and Zn concentrations in bone as a function of MnBn.
The animal treatment regimen is described in the legend to Fig. 1. Concentrations of Mn, Fe, Cu and Zn were determined by AAS. Liner regression was used to estimate the correlation coefficients.
3.6 MnBn in rats with other Mn exposure paradigm
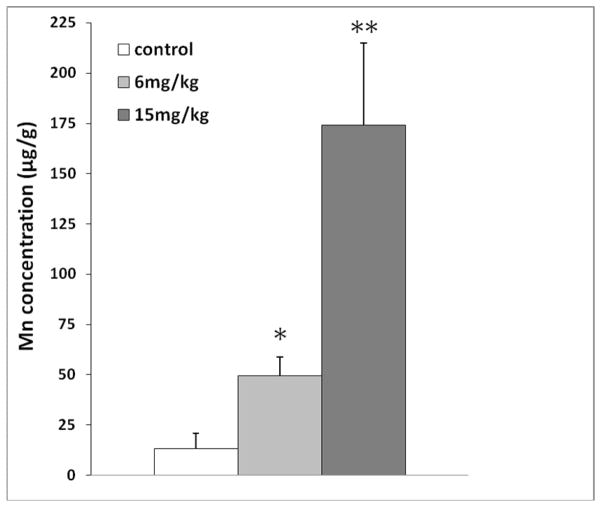
A rapid time-dependent Mn accumulation in bone observed in Phase 1 of this study raised the question as to whether alternative Mn dose regimens and routes of exposure may lead to similar Mn accumulation in bone. In our previous studies, we have used a subchronic Mn exposure model by administering rats 6 mg Mn/kg (low dose) or 15 mg Mn/kg (high dose) as MnCl2, 5 days per week for 4 weeks by intraperitoneal injection, and found significant alterations in neurochemical profiles (O’Neal et al., 2014). To investigate bone Mn accumulation in this animal model, rats received ip injections of Mn with the same dose regimen. Following 4-week ip dose administration, MnBn was significantly increased in both exposure groups as compared to controls (49.3 ± 9.3 for low dose, 172.9 ± 35.3 for high dose vs. 13.0 ± 7.8 for control; mean ± SD μg/g; p < 0.01) (Fig. 6). It was apparent that Mn accumulated in bone tissues was in a dose-dependent manner after ip Mn exposure.
Fig. 6.
Mn concentration in rat bone after chronic ip injection exposure.
Rats received 6 mg Mn/kg as MnCl2 by ip. injections once daily, five days per week, for 4 weeks. Data represent mean ± S.D., n = 5–6; *: p < 0.05, **: p < 0.01
3.7 Mn concentration in muscle
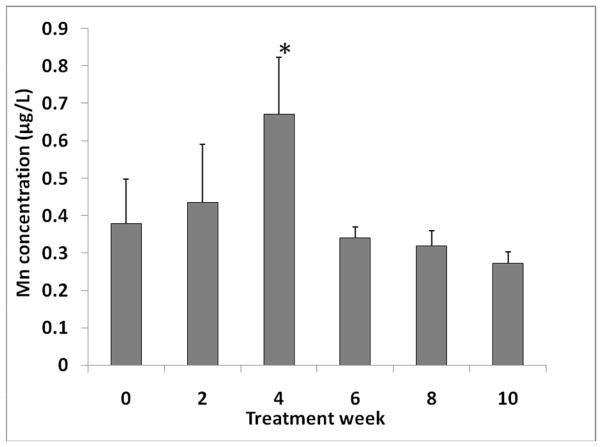
In vivo noninvasive measurements of MnBn (Liu et al., 2013) will likely include some contribution of Mn present in skeletal muscle. To estimate Mn concentrations in muscle (MnM), we determined MnM in animals receiving oral doses of Mn. The soleus muscle was selected because of its proximity to the tibia, one of the bones commonly measured in vivo. The results showed an initial increase of MnM in the soleus muscle, which reached a statistical significance after 4 weeks of dose administration (p<0.05; Fig. 7). However, similar to Mn concentrations in plasma and CSF, the levels of Mn began to decrease despite continued administration of Mn and stayed relatively unchanged in comparison to controls at time 0 (~0.35–0.40 μg/L). Thus, it seems likely that under long-term, chronic exposure condition, Mn concentration in muscle tissues would remain at a relatively constant level.
Fig. 7.
Mn concentration in muscle after chronic oral Mn exposure.
The animal treatment regimen is described in the legend to Fig. 1. Mn concentrations in soleus muscle were determined by AAS. Data represent mean ± S.D., n = 5–6; *: p < 0.05.
4. Discussion
This study is the first to report estimations of t1/2 of Mn in bone after a chronic oral Mn exposure. Other reports in literature have described extensive Mn accumulation in bone (Pejovic-Milic et al., 2009; Schroeder et al., 1966; Zaichick et al., 2011); yet none has calculated the half-life of Mn in the rat skeleton.
Occupational exposure to Mn in the air at concentrations from 0.1–1.27 mg/m3 shows levels of Mn in the blood to be 10.3–12.5 μg/l (Vezér et al., 2007). Among patients with clinical signs and symptoms of manganism, the blood Mn concentration varies between 4–40 μg/L (Crossgrove and Zheng, 2004; Inoue and Makita, 1996; Jiang, et al., 2007). Interestingly, the plasma Mn concentration in rats at day 30 following this oral dose regimen is ~20 μg/L; the level is highly comparable to human Mn blood level at poisoning. More interestingly, the steady-state concentrations of Mn in rat striatum under this dose regimen are about 1–1.2 μg/g between four and six weeks of dose administration (Supplemental Fig. I); under this brain concentration range, a significant striatal neurodegenerative injury has been observed (Fujioka et al., 2003). Noticeably, environmental exposure to Mn has been known to occur through eating foods and drinking water contaminated with Mn (ATSDR, 2012). Studies of humans drinking contaminated water in Bangladesh and Greece show that levels of Mn between 50 μg/l and 8.61 mg/l can cause adverse health effects (Hafeman et al., 2007; Kondakis et al., 1989). The LD50 of oral MnCl2 exposure in rats is 338 mg/kg (McMillian, 1999). Our dose of 50 mg/kg is approximately 15% of this value. Although rats were exposed orally in the current study, the ATSDR (2012) reports that health effects observed after an oral exposure are similar to those observed after an inhalation exposure. Thus, the current oral Mn administration appears to be an appropriate animal model for chronic Mn intoxication study including Mn accumulation and elimination from bone tissues.
It is interesting to know that in the first 4 weeks of Mn dose administration, MnBn continued to increase, while the blood Mn concentration started to decline by the end of the 4th week of dosing. Although the blood Mn concentration returned to nearly baseline level after 10 weeks of exposure, MnBn remained significantly higher than in controls. This observation supports the view that a short blood t1/2 of Mn is due primarily to its intracellular distribution (Zheng et al., 2000) and thus, Mn blood concentration is deemed insufficient for assessment of Mn exposure or health risk (Zheng et al., 2011). Data from the current study clearly demonstrate that the bone tissue serves as a storage site upon Mn chronic exposure. Indeed, the average t1/2 of MnBn was estimated to be about 143 days. In a comparative study of human and rat developmental time points and associated body weights, Sengupta (2011) proposes that every 16.7 days throughout the life of the rat is equivalent to one human year. Using this analogy, we estimate the half-life of Mn in the rat femur to be 4.6 years, tibia 15.8 years, humerus 25.7 years, and parietal bone would be an astounding 41.3 years. To estimate the value for the entire skeleton, it is more appropriate to take the half-lives of bone sampled from different body parts. Thus, by using the average half-life in in the current study, we estimate that the average half-life of Mn in the rat skeleton corresponds to 8.6 years for humans.
The current study also revealed an interesting observation, i.e., the shortest half-lives of Mn were observed in the weight-bearing bones. Specifically, we observed the shortest half-lives in femur and tibia bones and the longest in parietal bone. Regarding animal locomotor behavior, rats are a generalist species, with skeletal structures developed for burrowing, running, jumping, and walking. Although not bipedal, rats do spend time standing on their hind limbs while exploring or searching for food. This potentially puts more pressure on the femur and tibia bones when compared with their humerus or parietal bones. The observation leads to another interesting question as to why the weight-bearing bones have a shorter storage time for Mn.
In both adult humans and rats, the main function of the skeleton is remodeling. Bone remodeling consists of both bone formation and resorption. Between the different types of bones, there are anatomical and functional differences. For example, the perfusion rate within tubular long bones differs between areas of cortical bone such as the diaphysis, and areas of trabecular bone, including the femoral head and neck. Tøndevold and Eliasen (1982) have found that the perfusion rate is highest in areas with more trabecular bone and lowest in the diaphysis with more cortical bone. They also show that the perfusion rate is similar between the femur and tibia (Tøndevold and Eliasen, 1982), although the differences between these and other bone types, such as parietal bone, remain unknown. Serrat et al. (2007) indicate that some bones, such as the humerus, have different ossification patterns than does the femur. Bancroft et al. (2002) also suggest that the differences in fluid perfusion rates among bone tissues could alter the levels of nutrients including intracellular calcium and other biochemical factors, such as prostaglandin E2 and cyclooxygenase-2 in bone in vitro. Further, they observe that the fluid flow in these tissues mechanically stimulates pressure gradients so to move fluid outward into the cortical bone (Bancroft et al., 2002). Taking into account these literature data, we postulate that differences in anatomical structure, perfusion rate of bone tissues, and hydrostatic pressure or compression may explain the observed differences in Mn half-lives in different bones.
In the present study, we did not see any significant changes in animals’ body weights after chronic Mn oral exposure. However, we did observe the weight of femur bone to be significantly reduced after 18 weeks of Mn exposure. This observation suggests that in addition to simple storage, Mn ions accumulated in bone may have a direct detrimental effect on bone’s normal structure and function. In addition, we found that MnBn was positively associated with Fe and Zn in bone but inversely related to Cu. The implications of these relationships are currently unknown. Thus, Mn-induced osteotoxicity as a result of chronic Mn exposure in humans as well as animals deserves further in-depth investigation.
To understand whether MnBn could be used as a potential biomarker for Mn-induced neurotoxicity, we correlated MnBn with Mn levels in selected brain regions, including striatum, hippocampus, and choroid plexus from the same animals. It was evident that the values of MnBn were well correlated with each of these brain regions. These relationships are important for studies of Mn neurotoxicity in humans, for striatum is known to accumulate Mn to a great extent in humans (Dydak et al., 2011; Jiang et al., 2007), hippocampus is a potential target of Mn toxicity (Wang et al., 2012), and Mn accumulation in the choroid plexus is known to cause the dysregulation of the homeostasis of iron and copper in the central milieu (Zheng et al., 2003; 2012).
One of the purposes of this study was to build a theoretical foundation for human noninvasive quantitation of MnBn by using a novel deuterium-deuterium (DD) neutron generator–based neutron activated analysis (NAA) system (Liu et al., 2013). A transportable version of this system, which has been developed recently at Purdue University, has a detection limit of 0.7 ppm (μg/g). Schroeder et al. (1966) report that normal human subjects have a MnBn of 2 μg/g, which was determined using postmortem human bone tissues. Based on our current data, MnBn at the steady-state exceeds 1 μg/g. Thus, this transportable NAA device shall be of practical value in human study. The concentration of Mn in muscle was also determined in order to understand the kinetic changes of Mn levels in this tissue. Our results demonstrated that the Mn concentration in muscle remained constant after chronic exposure. Taken together, we feel that because MnBn has a long half-life, is well correlated with levels of Mn in brain and is not interfered by Mn in muscle, the MnBn measured in vivo by the transportable NAA system would serve as an excellent biomarker of Mn exposure in occupational and environmental research.
This study has limitations. First, the study as designed does not allow us to investigate the regional distribution and deposition of Mn within bone. Current studies in the lab are investigating the differences in distribution of Mn between cortical and trabecular bone. At the time of writing, our preliminary data from animals exposed to 6 mg Mn/kg as MnCl2 via ip injection five days per week for four weeks suggests that Mn accumulates in the trabecular bone of control animals, but in the cortical bone of Mn-exposed animals. Further work by synchrotron X-ray fluorescent technique to depict regional distribution of Mn in bone is desirable. Second, our current study does not address how Mn ions gain access to bone tissues, what subcellular ligands in bone tissues Mn ions are bound with, and whether Mn transporters, such as divalent metal transporter-1 (DMT1) and transferrin receptor (TfR), play any roles in Mn deposition and its toxicity to other metals. Additionally, due to the limited budget, the current study was not able to investigate the percentage of Mn in bone with regards to the total body burden, although such percentages have been reported in literature (see Introduction). Finally, this study did not investigate the contribution of bone marrow to overall Mn accumulation in bone. To the best of our knowledge, this has also not yet been reported elsewhere in published literature. Our future studies will be directed toward these unsolved issues.
In summary, the data presented in this report suggest that a 4-week Mn oral exposure can lead to a significant accumulation of Mn in bone tissues. The half-lives of Mn in rat bone are in the range of 77–690 days with an average of 143 days. Moreover, the weight-bearing bones such as femur appear to have a shorter t1/2 than non-weight bearing bones. Since brain Mn levels change as a function of MnBn, we propose that the MnBn may be an effective biomarker for assessment of Mn exposure and health risk.
Supplementary Material
Supplemental Figure I. Time-dependent accumulation of Mn in selected brain regions following chronic oral Mn exposure. Rats received 50 mg Mn/kg as MnCl2 by oral gavage once daily, five days per week for the time indicated. Mn concentrations in brain were determined by AAS. Data represent mean ± S.D., n = 5–6; *: p < 0.05, **: p < 0.01.
Highlights.
We examine the steady-state level and half-life of Mn in bone after oral exposure.
Average t1/2 of Mn in bone approximates 143 days in rats and 8.5 years in humans.
Mn concentrations in bone correlate with Mn levels in brain tissues and CSF.
We conclude that bone Mn is potentially a reliable biomarker for risk assessment.
Acknowledgments
FUNDING
The research reported in this manuscript was supported by National Institutes of Health/National Institute of Environmental Health Sciences grant RO1-ES008146 and National Institute of Occupational Safety Health R21-OH010044.
Abbreviation
- Mn
manganese
- MnBn
Mn concentration in bone
- MnM
Mn concentration in muscle
- CSF
cerebrospinal fluid
- BBB
blood-brain barrier
- BCB
blood-cerebrospinal fluid barrier
- Tss
steady state concentration
- t1/2
half life
Footnotes
Publisher's Disclaimer: This is a PDF file of an unedited manuscript that has been accepted for publication. As a service to our customers we are providing this early version of the manuscript. The manuscript will undergo copyediting, typesetting, and review of the resulting proof before it is published in its final citable form. Please note that during the production process errors may be discovered which could affect the content, and all legal disclaimers that apply to the journal pertain.
References
- Andersen ME, Gearhart JM, Clewell HJ., 3rd Pharmacokinetic data needs to support risk assessments for inhaled and ingested manganese. NeuroToxicology. 1999;20:161–171. [PubMed] [Google Scholar]
- Apostoli P, Lucchini R, Alessio L. Are current biomarkers suitable for the assessment of manganese exposure in individual workers? Am J Ind Med. 2000;37:283–290. doi: 10.1002/(sici)1097-0274(200003)37:3<283::aid-ajim6>3.0.co;2-e. [DOI] [PubMed] [Google Scholar]
- Aschner M, Guilarte TR, Schneider JS, Zheng W. Manganese: Recent advances in understanding its transport and neurotoxicity. Toxicology and Applied Pharmacology. 2007;221:131–147. doi: 10.1016/j.taap.2007.03.001. [DOI] [PMC free article] [PubMed] [Google Scholar]
- Agency for Toxic Substances and Disease Registry (ATSDR) Toxicological Profile for Manganese. Atlanta, GA: U.S. Department of Health and Human Services, Public Health Service; 2012. [PubMed] [Google Scholar]
- Bancroft GN, Sikavitsas VI, van den Dolder J, Sheffield TL, Ambrose CG, Jansen JA, Mikos AG. Fluid flow increases mineralized matrix deposition in 3D perfusion culture of marrow stromal osteoblasts in a dose-dependent manner. PNAS. 2002;99(20):12600–12605. doi: 10.1073/pnas.202296599. [DOI] [PMC free article] [PubMed] [Google Scholar]
- Barbeau A, Inoué N, Cloutier T. Role of manganese in dystonia. Adv Neurol. 1976;14:339–352. [PubMed] [Google Scholar]
- Bouchard MF, Sauve S, Barbeau B, Legrand M, Brodeur ME, Bouffard T, et al. Intellectual impairment in school-age children exposed to manganese from drinking water. Environ Health Perspect. 2011;119:138–143. doi: 10.1289/ehp.1002321. [DOI] [PMC free article] [PubMed] [Google Scholar]
- Butcher DJ, Zybin A, Bolshov MA, Niemax K. Speciation of methylcyclopentadienyl manganese tricarbonyl by high-performance liquid chromatography-diode laser atomic absorption spectrometry. Analytical Chemistry. 1999;71:5379–5385. doi: 10.1021/ac990570l. [DOI] [PubMed] [Google Scholar]
- Chandra SV, Shukla GS, Srivastawa RS, Singh H, Gupta VP. An exploratory study of manganese exposure to welders. Clin Toxicol. 1981;18:407–418. doi: 10.3109/15563658108990264. [DOI] [PubMed] [Google Scholar]
- Crossgrove J, Zheng W. Manganese toxicity upon overexposure. NMR Biomed. 2004;17:544–553. doi: 10.1002/nbm.931. [DOI] [PMC free article] [PubMed] [Google Scholar]
- DeWitt MR, Chen P, Aschner M. Manganese efflux in parkinsonism: Insights from newly characterized slc30a10 mutations. Biochem Biophys Res Commun. 2013;432:1–4. doi: 10.1016/j.bbrc.2013.01.058. [DOI] [PMC free article] [PubMed] [Google Scholar]
- Dorman DC, McElveen AM, Marshall MW, Parkinson CU, Arden James R, Struve MF, et al. Maternal-fetal distribution of manganese in the rat following inhalation exposure to manganese sulfate. NeuroToxicology. 2005;26:625–632. doi: 10.1016/j.neuro.2004.08.004. [DOI] [PubMed] [Google Scholar]
- Dydak U, Jiang YM, Long LL, Zhu H, Chen J, Li WM, Edden RAE, Hu S, Fu X, Long ZY, Mo XA, Meier D, Harezlak J, Aschner M, Murdoch JB, Zheng W. In vivo measurement of brain gaba concentrations by magnetic resonance spectroscopy in smelters occupationally exposed to manganese. Environ Health Perspect. 2011;119:219–224. doi: 10.1289/ehp.1002192. [DOI] [PMC free article] [PubMed] [Google Scholar]
- Fujioka M, Taoka T, Matsuo Y, Mishima K, Ogoshi K, Kondo Y, Tsuda M, Fujiwara M, Asano T, Sakaki T, Miyasaki A, Park D, Siesjö BK. Magnetic resonance imaging shows delayed ischemic striatal neurodegeneration. Ann Neurol. 2003;54(6):732–47. doi: 10.1002/ana.10751. [DOI] [PubMed] [Google Scholar]
- Furchner JE, Richmond CR, Drake GA. Comparative metabolism of radionuclides in mammals. 3. Retention of manganese-54 in the mouse, rat, monkey and dog. Health Phys. 1966;12:1415–1423. doi: 10.1097/00004032-196610000-00003. [DOI] [PubMed] [Google Scholar]
- Gibaldi M, Perrier D. Pharmacokinetics. Marcel Dekker; New York: 1982. pp. 84–109.pp. 433–444. [Google Scholar]
- Hafeman D, Factor-Litvak P, Cheng Z, van Geen A, Ahsan H. Association between manganese exposure through drinking water and infant mortality in Bangladesh. Environmental Health Perspectives. 2007;115(7):1107–1112. doi: 10.1289/ehp.10051. [DOI] [PMC free article] [PubMed] [Google Scholar]
- ICRP. Publication no.23, international commission on radiological protection. New York: 1972. Report of the task group on reference man. [Google Scholar]
- Inoue N, Makita Y. Neurological aspects in human exposures to manganese. In: Chang LW, editor. Toxicology of Metals. CRC Press; Boca Raton: 1996. pp. 415–421. [Google Scholar]
- Jiang Y, Zheng W, Long L, Zhao W, Li X, Mo X, Lu JP, Fu X, Li WM, Liu SF, Long QY, Huang JL, Pira E. Brain magnetic resonance imaging and manganese concentrations in red blood cells of smelting workers: Search for biomarkers of manganese exposure. NeuroToxicology. 2007;28:126–135. doi: 10.1016/j.neuro.2006.08.005. [DOI] [PMC free article] [PubMed] [Google Scholar]
- Jiang YM, Mo XA, Du FQ, Fu X, Zhu XY, Gao HY, Xie JL, Liao FL, Pira E, Zheng W. Effective treatment of manganese-induced occupational parkinsonism with p-aminosalicylic acid: A case of 17-year follow-up study. J Occup Environ Med. 2006;48:644–649. doi: 10.1097/01.jom.0000204114.01893.3e. [DOI] [PMC free article] [PubMed] [Google Scholar]
- Kondakis XG, Makris N, Leotsinidis M, Prinou M, Papapetropoulos T. Possible health effects of high manganese concentration in drinking water. Arch Environ Health. 1989;44(3):175–178. doi: 10.1080/00039896.1989.9935883. [DOI] [PubMed] [Google Scholar]
- Liu Y, Koltick D, Byrne P, Wang H, Zheng W, Nie LH. Development of a transportable neutron activation analysis system to quantify manganese in bone in vivo: Feasibility and methodology. Physiol Meas. 2013;34:1593–1609. doi: 10.1088/0967-3334/34/12/1593. [DOI] [PMC free article] [PubMed] [Google Scholar]
- Lucchini RG, Albini E, Benedetti L, Borghesi S, Coccaglio R, Malara EC, et al. High prevalence of parkinsonian disorders associated to manganese exposure in the vicinities of ferroalloy industries. Am J Ind Med. 2007;50:788–800. doi: 10.1002/ajim.20494. [DOI] [PubMed] [Google Scholar]
- McMillian DE. A brief history of the neurobehavioral toxicity of Mn: some unanswered questions. NeuroToxicology. 1999;20(2–3):499–508. [PubMed] [Google Scholar]
- Newland MC, Cox C, Hamada R, Oberdorster G, Weiss B. The clearance of manganese chloride in the primate. Fundam Appl Toxicol. 1987;9:314–328. doi: 10.1016/0272-0590(87)90054-6. [DOI] [PubMed] [Google Scholar]
- O’Neal S, Lee J-W, Zheng W, Cannon JR. Subchronic manganese exposure in rats is a neurochemical model of early manganese toxicity. Neurotoxicology. 2014 doi: 10.1016/j.neuro.2014.08.001. (in revision) [DOI] [PMC free article] [PubMed] [Google Scholar]
- Pejovic-Milic A, Chettle DR, Oudyk J, Pysklywec MW, Haines T. Bone manganese as a biomarker of manganese exposure: A feasibility study. Am J Ind Med. 2009;52:742–750. doi: 10.1002/ajim.20737. [DOI] [PubMed] [Google Scholar]
- Racette BA, Aschner M, Guilarte TR, Dydak U, Criswell SR, Zheng W. Pathophysiology of manganese-associated neurotoxicity. Neurotoxicology. 2012;33(4):881–886. doi: 10.1016/j.neuro.2011.12.010. [DOI] [PMC free article] [PubMed] [Google Scholar]
- Schroeder HA, Balassa JJ, Tipton IH. Essential trace metals in man: Manganese. A study in homeostasis. J Chronic Dis. 1966;19:545–571. doi: 10.1016/0021-9681(66)90094-4. [DOI] [PubMed] [Google Scholar]
- Seaborn CD, Nielsen FH. Dietary silicon and arginine affect mineral element composition of rat femur and vertebra. Biol Trace Elem Res. 2002;89:239–250. doi: 10.1385/bter:89:3:239. [DOI] [PubMed] [Google Scholar]
- Sengupta P. A scientific review of age determination for a laboratory rat: How old is it in comparison with human age? Biomedicine International. 2011;2:81–89. [Google Scholar]
- Serrat MA, Reno PL, McCollum MA, Meindl RS, Lovejoy CO. Variation in mammalian proximal femoral development: Comparative analysis of two distinct ossification patterns. J Anat. 2007;210:249–258. doi: 10.1111/j.1469-7580.2007.00694.x. [DOI] [PMC free article] [PubMed] [Google Scholar]
- Sierra P, Loranger S, Kennedy G, Zayed J. Occupational and environmental exposure of automobile mechanics and nonautomotive workers to airborne manganese arising from the combustion of methylcyclopentadienyl manganese tricarbonyl (MMT) Am Ind Hyg Assoc J. 1995;56:713–716. doi: 10.1080/15428119591016746. [DOI] [PubMed] [Google Scholar]
- Sikk K, Haldre S, Aquilonius SM, Taba P. Manganese-induced Parkinsonism due to Ephedrone abuse. Parkinson’s Disease. 2011;2011:865319. doi: 10.4061/2011/865319. [DOI] [PMC free article] [PubMed] [Google Scholar]
- Tøndevold E, Eliasen P. Blood flow rates in canine cortical and cancellous bone measured with 99Tcm-labeled human albumin microspheres. Acta Orthop Scand. 1982;53:7–11. doi: 10.3109/17453678208992171. [DOI] [PubMed] [Google Scholar]
- Vezer T, Kurunczi A, Naray M, Papp A, Nagymajtenyi L. Behavioral Effects of subchronic inorganic manganese exposure in rats. American Journal of Industrial Medicine. 2007;50:841–852. doi: 10.1002/ajim.20485. [DOI] [PubMed] [Google Scholar]
- Wang L, Ohishi T, Shiraki A, Morita R, Akane H, Ikarashi Y, Mitsumori K, Shibutani M. Developmental exposure to manganese chloride induces sustained aberration of neurogenesis in the hippocampal dentate gyrus of mice. Toxicol Sci. 2012;127(2):508–521. doi: 10.1093/toxsci/kfs110. [DOI] [PubMed] [Google Scholar]
- Zaichick S, Zaichick V, Karandashev VK, Moskvina IR. The effect of age and gender on 59 trace-element contents in human rib bone investigated by inductively coupled plasma mass spectrometry. Biological Trace Element Research. 2011;143:41–57. doi: 10.1007/s12011-010-8837-4. [DOI] [PubMed] [Google Scholar]
- Zheng W, Ren S, Graziano JH. Manganese inhibits mitochondrial aconitase: A mechanism of manganese neurotoxicity. Brain Res. 1998;799:334–342. doi: 10.1016/s0006-8993(98)00481-8. [DOI] [PMC free article] [PubMed] [Google Scholar]
- Zheng, et al. 1999 [Google Scholar]
- Zheng W, Kim H, Zhao Q. Comparative toxicokinetics of manganese chloride and methylcyclo-pentadienyl Mn tricarbonyl in male Sprague-Dawley rats. Toxicol Sci. 2000;54:295–301. doi: 10.1093/toxsci/54.2.295. [DOI] [PMC free article] [PubMed] [Google Scholar]
- Zheng W. Neurotoxicology of the brain barrier system: New implications. J Toxicol - Clin Toxicol. 2001;39(7):711–719. doi: 10.1081/clt-100108512. [DOI] [PMC free article] [PubMed] [Google Scholar]
- Zheng W, Aschner M, Ghersi-Egea JF. Brain barrier systems: a new frontier in metal neurotoxicological research. Invited Review, Toxicol Appl Pharmacol. 2003;192:1–11. doi: 10.1016/s0041-008x(03)00251-5. [DOI] [PMC free article] [PubMed] [Google Scholar]
- Zheng W, Jiang YM, Zhang YS, Jiang W, Wang X, Cowan DM. Chelation therapy of manganese intoxication by para-aminosalicylic acid (PAS) in Sprague-Dawley rats. NeuroToxicology. 2009;30:240–248. doi: 10.1016/j.neuro.2008.12.007. [DOI] [PMC free article] [PubMed] [Google Scholar]
- Zheng W, Fu SX, Dydak U, Cowan DM. Biomarkers of manganese intoxication. NeuroToxicology. 2011;32:1–8. doi: 10.1016/j.neuro.2010.10.002. [DOI] [PMC free article] [PubMed] [Google Scholar]
- Zheng W, Monnot AD. Regulation of brain iron and copper homeostasis by brain barrier systems: Implication in neurodegenerative diseases. Pharmacol Ther. 2012;133:177–188. doi: 10.1016/j.pharmthera.2011.10.006. [DOI] [PMC free article] [PubMed] [Google Scholar]
Associated Data
This section collects any data citations, data availability statements, or supplementary materials included in this article.
Supplementary Materials
Supplemental Figure I. Time-dependent accumulation of Mn in selected brain regions following chronic oral Mn exposure. Rats received 50 mg Mn/kg as MnCl2 by oral gavage once daily, five days per week for the time indicated. Mn concentrations in brain were determined by AAS. Data represent mean ± S.D., n = 5–6; *: p < 0.05, **: p < 0.01.


