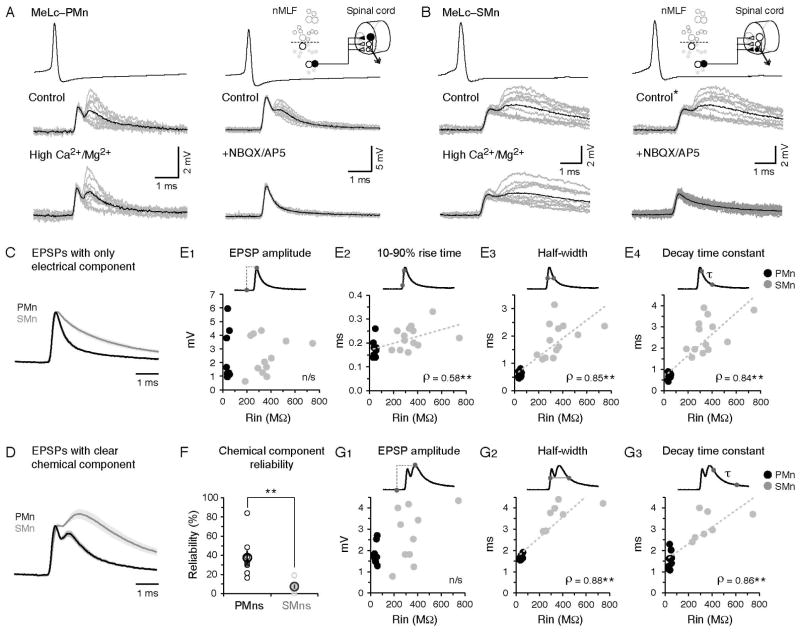
Figure 3. Differences in the Waveforms of MeLc-Evoked EPSPs Related to Motoneuron Input Resistance.
(A) Example of direct connections between the MeLc neuron and a larger, dorsal PMn (see schematic in upper right corner) in control solution, high-divalent cation solution (Ca2+/Mg2+), or in the presence of the glutamate receptor antagonists NBQX/AP5. Superimposed EPSPs (gray lines, n = 10) and their averaged trace (black line) are shown in each example.
(B) As in A, but direct connections between a MeLc neuron and a smaller, ventral SMn. Note, in this example the control panels and spikes are the same because the hi-divalent and NBQX/AP5 perfusions were performed in the same fish (*).
(C) Comparison of MeLc-evoked EPSPs that contain only the early, electrical component in PMns and SMns. Standard error is indicated by the shading. EPSP waveforms have been scaled and aligned to peaks to illustrate the slower decay in the SMns compared to the PMns.
(D) As in C, but for EPSPs that contain a clear chemical component in PMns and SMns.
(E) Properties of MeLc-elicited EPSPs that contain only the early component versus input resistance (Rin) of spinal motoneurons. These include EPSP amplitude (E1), rise time (E2), half-width (E3), and decay time constant (E4). Trend line is a linear fit. **: p<0.05 following Spearman’s rank test (ρ).
(F) Reliability of the later, chemical component of MeLc-elicited EPSPs in PMns and SMns (PMn, 38 ± 7%, n = 8; SMn, 7 ± 2%, n = 11; Student’s t-test, **p<0.05)
(G) As in E, but for EPSP amplitude (G1), half-width (G2) and decay time constant (G3) with clear chemical components.

