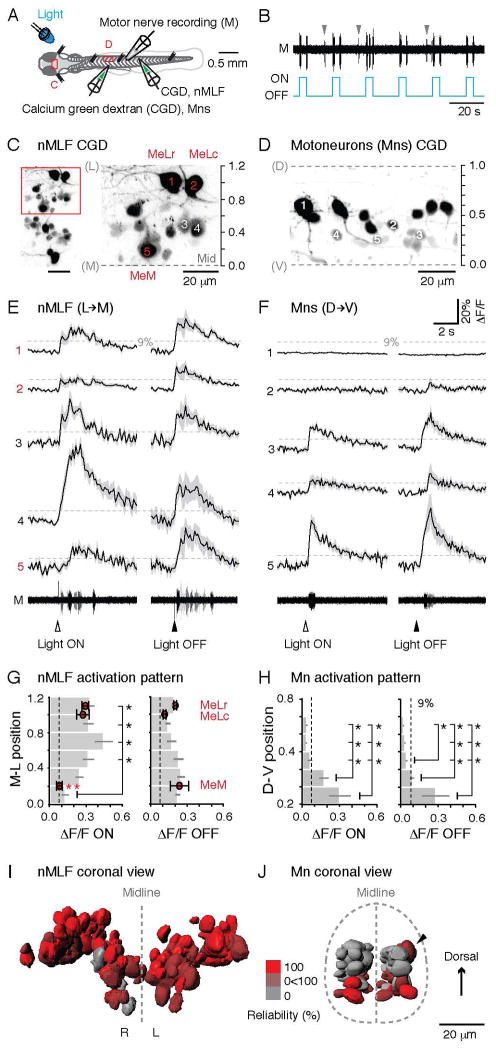
Figure 5. nMLF Neurons Reliably Respond to Changes in Illumination.
(A) Schematic showing the preparation for calcium imaging of the nMLF neurons (C) or spinal motoneurons (D) using calcium green dextran (CGD) injections, and a simultaneous motor nerve (M) recording. LED, light emitting diode.
(B) The onset/offset of the LED reliably elicits ‘fictive’ motor output, which can be recorded from the motor nerve in α-bungarotoxin immobilized preparations. Spontaneous motor output is marked by gray arrowheads.
(C) View of the nMLF neurons backfilled with CGD from above (left), with a higher magnification of the area boxed in red (right). The midline (Mid) of the brain and the center of the MeLr soma were used as references for normalizing the medio-lateral (M-L) locations of nMLF neurons (midline = 0, MeLr soma = 1).
(D) A subset of spinal motoneurons backfilled with CGD. Retrograde filling reliably labels motoneurons throughout the full dorso-ventral (D-V) range of the spinal motor column. Dashed lines mark dorsal (D) and ventral (V) boundaries of the spinal cord, normalized as 1 and 0.
(E) Calcium transients associated with motor output for nMLF neurons at different M-L locations (marked in C) in response to light onset and offset (black line = averaged response; shaded area = standard error; n = 5 trials for each neuron). The dashed line marks 9% ΔF/F, the threshold for determining whether a neuron is active. For both E and F, arrowheads indicate time of the light stimuli. Motor nerve activity (M) for each of the five trials is superimposed in different shades of gray. E and F share the same scale bars.
(F) Example calcium transients for motoneurons at different D-V locations (marked in D) in response to light onset and offset. The dashed line marks 9% ΔF/F.
(G) Averaged calcium response amplitudes of nMLF neurons at different M-L locations in the midbrain. Light ON, n = 91 cells; light OFF, n = 52 cells; both from 8 fish. *: p<0.05 following Mann-Whitney U test and Bonferroni correction for multiple comparisons. Response amplitude of the three identified nMLF neurons are shown as red circles at their relative M-L locations. Light ON, n = 25 cells; light OFF, n = 18 cells; both from 8 fish. *: p<0.05 following Mann-Whitney U-test and Bonferroni correction for multiple comparisons. In G and H, dashed line marks the 9% ΔF/F.
(H) Calcium response amplitude to light onset and offset of spinal motoneurons at different D-V locations in the spinal cord. Light ON, n = 127 cells from 11 fish; light OFF, n = 78 cells from 7 fish. *: p<0.05 following Mann-Whitney U test and Bonferroni correction for multiple comparisons.
(I) 3D-registration of soma surfaces of nMLF neurons from 8 fish. The neuron surfaces are color-coded according to their reliability of response to light (100%, bright red, always responds to light; 0%, gray, never responds to light). Light onset and offset responses are pooled. R, right side; L, left side.
(J) 3D-registration of soma surfaces of spinal motoneurons from 8 fish. The motoneuron surfaces are color-coded according to their reliability of response to light as described in J. A black arrowhead marks a more dorsal motoneuron that responded on the upper side of the side-lying fish.

