

Abstract
Team‐based care can improve hypertension control. The purpose of the present study was to evaluate blood pressure (BP) control 18 months following the discontinuation of a physician‐pharmacist collaborative intervention. This was a retrospective analysis of patients who had previously participated in a prospective, cluster randomized, controlled clinical trial. Six community‐based family medicine offices were randomized to control or intervention groups. Research nurses measured BPs using an automated device during the prospective trial. The research nurses then abstracted data from medical records, including BPs, medications, changes in therapy, and laboratory values for 18 months following the discontinuation of the 6‐month prospective trial. The study included 228 patients in the control (n=146) or intervention (n=82) groups. The control group contained more patients with diabetes or chronic kidney disease (P<.013), were older (P=.047), and had more coexisting conditions (P<.001) than the intervention group. Systolic BP 9 months following discontinuation of the physician‐pharmacist intervention was 137.2±18.2 mm Hg and 129.8±13.3 mm Hg in the control and intervention groups, respectively (P=.0015). BP control was maintained in 61 (41.8%) control patients and 55 (67.1%) intervention patients (P=.0003). At 18 months post‐intervention, systolic BP was 138.1±20.4 mm Hg and 130.0±16.0 mm Hg in the control and intervention groups, respectively (P=.023). BP control was maintained in 53 (36.3%) control patients and 55 (67.1%) intervention patients at 18 months post‐intervention (P<.0001). A sensitivity analysis was conducted to address the uneven distribution of patients with diabetes or chronic kidney disease, and the differences between groups were still significant. BP control rates remained significantly higher following a physician‐pharmacist intervention compared with usual care for 18 months after discontinuation of the intervention. This model has the potential value as a useful long‐term strategy to benefit patients with hypertension. J Clin Hypertens (Greenwich). 2011;13:431–437. ©2011 Wiley Periodicals, Inc.
Hypertension is a major cause of morbidity and mortality. 1 , 2 A recent evaluation from the National Health and Nutrition Examination Survey (NHANES) found that blood pressure (BP) control increased from 27% in 1988–1994 to 50% in 2007–2008. 3 Although these results show a major improvement, BP is still uncontrolled in 50% of the US population with hypertension. One of the most successful strategies for controlling BP is a team‐based approach. 4 , 5 , 6 , 7 , 8 , 9 , 10 Studies have demonstrated the positive effects of a physician‐pharmacist collaborative model to improve BP control. 6 , 11 The results of a prospective, cluster randomized, controlled clinical trial conducted in 6 clinics within the state of Iowa was recently published. 6 Clinics were randomized to either usual care or a physician‐pharmacist intervention to assist with BP management within the office. At the end of the 6‐month clinical trial, BP control was achieved in 64% of the intervention group compared with 30% in the control group. 6
Few studies have evaluated whether the effect of team‐based care is sustained following discontinuation of the intervention. The goal of the present study was to assess BP control following discontinuation of a 6‐month physician‐pharmacist intervention. We hypothesized that BP control would deteriorate in both the control and intervention groups. We further hypothesized that some residual benefit would remain at 18 months after discontinuation of the intervention and BP would continue to be lower in the intervention group compared with the control group.
Methods
This study included patients from the prospective, intervention trial who agreed to participate in a retrospective, comparative analysis of their medical record data 18 months following the 6‐month intervention study (Figure 1). 6 The study was a cluster randomized, controlled clinical trial conducted in 6 community‐based family medicine residency programs in Iowa. Three medical offices were randomized to a control group where physicians provided usual BP management and 3 to an intervention group where BP management was provided by physician‐pharmacist collaboration. All 6 medical offices employed clinical pharmacists to provide physician education and patient care. The study was approved by the University of Iowa institutional review board and by the local review boards for the 6 clinics.
Figure 1.
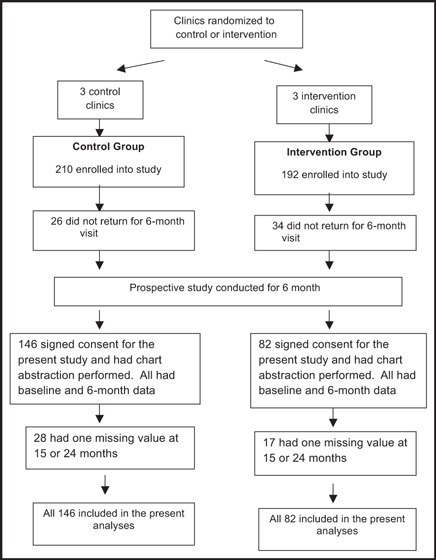
Flow of patients through the study protocol.
The design of the prospective study was previously published in 2009. 6 Briefly, men and women older than 21 years with a diagnosis of essential hypertension taking 0 to 3 antihypertensive medications were eligible if their systolic BP was between 140 mm Hg and 179 mm Hg or their diastolic BP was between 90 mm Hg and 100 mm Hg and they did not have diabetes or chronic kidney disease (CKD). Patients with diabetes or CKD were eligible if their systolic BP was between 130 mm Hg and 179 mm Hg or their diastolic BP was between 80 mm Hg and 109 mm Hg. Exclusion criteria included dementia, pregnancy, unstable angina, cognitive impairment, serious renal or hepatic disease, BP ≥180/110 mm Hg, poor prognosis (life expectancy <3 years), evidence of hypertensive urgency or emergency, New York Heart Association class III or IV heart failure, myocardial infarction or stroke (6 months before screening), and antihypertensive medication or dosage change within 4 weeks of the baseline visit.
Research nurses at each site collected baseline patient data and were trained to measure BP using standardized guidelines. 12 , 13 BP was measured 3 times at each visit using an automated device (HEM 907‐XL; Omron Corporation, Schaumburg, IL) at baseline and at 3‐ and 6‐month time points. The second and third values at each study visit were averaged and used to determine the research BP value. The following data were collected at the baseline visit: patient age, height, weight, sex, race, educational degree, insurance status, household income, marital status, smoking status, alcohol intake, and history of coexisting conditions. Race and ethnicity were self‐declared by the patient. The nurse personally administered a validated self‐reported questionnaire of medication adherence. 14 , 15 The questions on the adherence questionnaire included: “Do you ever forget to take your BP medication?”“Are you careless at times about taking your BP medication?”“When you feel better do you sometimes stop taking your medication?”“Sometimes if you feel worse when you take your BP medication, do you stop taking it?”“Do you ever miss taking your high BP medication for any reason?” 13 , 14
Intervention physicians and pharmacists participated in team‐building exercises using previously described strategies. 4 , 6 Pharmacists at the 3 intervention sites were given 2 initial 90‐minute training sessions to ensure consistent interventions. Physicians at all 6 sites received educational lectures, published national guidelines, and clinical trial evidence regarding hypertension. Pharmacists at the intervention sites were encouraged to assess medications and BP at baseline, at 1 month, by telephone at 3 months, and more frequently as necessary. The pharmacist then made recommendations to the physician to adjust the antihypertensive medication whenever BP was not controlled. Pharmacists at control sites answered general treatment questions from physicians, but did not provide additional care for study patients. The parent study intervention was discontinued at 6 months. Pharmacists in the intervention offices were free to continue working with study patients and physicians after the formal intervention ended.
Patients from the prospective study, who wished to participate, signed informed consent. Since some patients for the present study had to provide a second signed informed consent, not all patients from the parent study were included. Research nurses abstracted data from intervention and control patients’ medical records for the 18 months following completion of the 6‐month clinical trial (24 months total). The abstracted data included new cardiovascular risk factors, new compelling indications, new target organ damage, BPs, weight, number of office visits, interventions taken to improve BP, laboratory values, and medications. If there were multiple BP readings abstracted, the BP measurement closest to each index date (eg, the 15‐ and 24‐month dates) was chosen for data analyses.
Physician adherence to BP guidelines was determined at baseline and at 6, 15, and 24 months using a previously validated adherence tool developed by the investigators and a 3‐member panel of national experts in hypertension, 16 , 17 , 18 based on the Seventh Report of the Joint National Committee on the Prevention, Detection, Evaluation, and Treatment of High Blood Pressure (JNC 7). 2 The tool used 22 weighted criteria within 3 major domains: treatment for patients with comorbidities, laboratory monitoring, and follow‐up intensity. The present study reports the percent of applicable criteria that were met. Scores could range from zero (none of the applicable criteria were met) to 100 (100% of the applicable criteria were met). The guideline adherence score for each physician was then averaged within each group to determine the overall guideline adherence score.
Data Analysis
This study used an intent‐to‐treat analysis design. All patients had data at baseline and 6 months. There were 28 patients in the control group and 17 in the intervention group who had missing BP data at 15 or 24 months. Missing BP data were imputed based on an algorithm for BP trends for the group to which the patient was assigned. Means, standard deviations, and percentages were determined for patient demographics and health‐related variables at baseline for the population of patients who participated in the retrospective data abstraction. The Student t test and Fisher exact test were used to make comparisons between groups at each time period. A P value <.05 was considered a statistically significant difference.
Results
Patients in the prospective trial were enrolled from August 16, 2005, until April 9, 2008. Of the 402 participants who completed the parent study, 228 signed consent for the present study, had prospective data at both baseline and 6 months, and had data abstracted from their medical record. There were 146 patients in the control group and 82 in the intervention group. All patients had data at baseline and 6 months. There were 28 patients in the control group and 17 in the intervention group who had missing BP data at 15 or 24 months, and data were imputed for these values. The baseline patient demographics are shown in Table I. The control group had significantly more patients with comorbidities (P<.0001), specifically diabetes mellitus and CKD (P=.0013). Patients in the control group were also older than patients in the intervention group (P=.047).
Table I.
Baseline Patient Demographics and Clinical Characteristics
| Characteristics | Control (n=146) | Intervention (n=82) | P Value |
|---|---|---|---|
| No. (%) of Patients | |||
| Sex | |||
| Male | 64 (43.8) | 27 (32.9) | .12 |
| Female | 82 (56.2) | 55 (67.1) | |
| Race | |||
| Caucasian | 119 (81.5) | 74 (90.2) | .13 |
| Non‐Caucasian | 27 (18.5) | 8 (9.8) | |
| Coexisting conditions | |||
| DM and/or CKD | 58 (39.7) | 19 (23.2) | .013 |
| Mean±SD | |||
| Age, y | 59.8±13.2 | 56.07±14.3 | .047 |
| Medication adherencea | 0.94 | 0.91 | .87 |
| Coexisting conditions, No. | 3.66±2.0 | 2.53±1.6 | <.0001 |
| Antihypertensive medications, No. | 1.8±1.1 | 1.1±1.1 | <.0001 |
Abbreviations: CKD, chronic kidney disease; DM, diabetes mellitus, SD, standard deviation. aValues are based on the number of items answered “yes” out of 5 questions. The higher the number, the greater the medication nonadherence.
At baseline, systolic BP was 149.8±14.0 mm Hg in the control group and 152.6±13.2 mm Hg in the intervention group (P=.14). At the end of the 6‐month prospective study, systolic BP had decreased to 144.5±20.1 mm Hg in the control group and 133.4±16.8 mm Hg in the intervention group (P<.0001; Table II; Figure 2). Controlled BP was achieved in 42 (28.7%) patients in the control group, and 53 (64.6%) in the intervention group at the end of the prospective study (P<.0001; Table II; Figure 3). BP at 15 months (9 months after completion of the prospective trial) continued to drop to 137.2±18.2 mm Hg in the control group and 129.8±13.3 mm Hg in the intervention group (P=.0015; Table II; Figure 2). At 15 months, BP was controlled in 61 (41.8%) patients in the control group and 55 (67.1%) patients in the intervention group (P=.0003; Table II; Figure 3). At the 24‐month time point (18 months post‐intervention), systolic BP was 138.1±20.4 mm Hg in the control group and 130±16.0 mm Hg in the intervention group (P=.0023; Table II; Figure 2). At 24 months, 53 (36.3%) patients in the control group and 55 (67.1%) patients in the intervention group had controlled BP (P<.0001; Table II; Figure 3). Diastolic BP was significantly lower at baseline in the control group (P=.01), but was not significantly different at any other time points (Table II).
Table II.
Blood Pressure Values and Adherence Values
| Baseline | 6 Months | 15 Months | 24 Months | |
|---|---|---|---|---|
| Systolic BP, mm Hg | ||||
| Control | 149.8±14.0 | 144.5±20.1 | 137.2±18.2 | 138.1±20.4 |
| Intervention | 152.6±13.2 | 133.4±16.8a | 129.8±13.3b | 130.0±16.0c |
| Diastolic BP, mm Hg | ||||
| Control | 83.0±11.9 | 79.9±14.4 | 79.3±12.1 | 78.8±11.6 |
| Intervention | 87.3±12.5d | 78.5±11.6 | 79.3±10.0 | 77.4±10.4 |
| No. (%) achieving BP control | ||||
| Control | 0 | 42 (28.7) | 61 (41.8) | 53 (36.3) |
| Intervention | 0 | 53 (64.6)a | 55 (67.1)e | 55 (67.1)a |
| Physician Adherence Scores (% criteria met) | ||||
| Control | 49.9±18.9 | 54.8±17.3 | 48.0±21.0 | 46.5±21.4 |
| Intervention | 40.3±22.4f | 63.7±12.4a | 48.6±23.0 | 48.4±23.2 |
| No. of BP medications | ||||
| Control | 1.8±1.0 | 2.1±1.1 | ND | 2.2±1.1 |
| Intervention | 1.1±1.1a | 2.0±0.9 | ND | 2.0±1.0 |
| No. of hypertension visits | ||||
| Control | 2.0±1.9 | 2.2±2.0 | 1.9±2.1 | 1.9±2.1 |
| Intervention | 1.8±1.3 | 5.2±2.4a | 1.7±1.9 | 1.5±1.7 |
| No. (%) of patients with a goal BP documented | ||||
| Control | 7 (4.8) | 6 (4.1) | 12 (8.2) | 12 (8.2) |
| Intervention | 2 (2.4) | 76 (92.7)a | 76 (92.7)a | 76 (92.7)a |
| No. (%) of patients provided with their goal BP | ||||
| Control | 1 (0.7) | 3 (2.1) | 3 (2.1) | 3 (2.1) |
| Intervention | 1 (1.2) | 71 (86.6)a | 71 (86.6)a | 71 (86.6)a |
Abbreviation: BP, blood pressure. Blood pressure control was defined as <140/90 mm Hg for uncomplicated hypertension and <130/80 mm Hg for patients with diabetes or chronic kidney disease. Hypertension visits included all contacts with the clinical pharmacists. Only statistically significant differences between groups are indicated: a<.0001. b.0015. c.0023. d.010. e.0003. f.0008.
Figure 2.
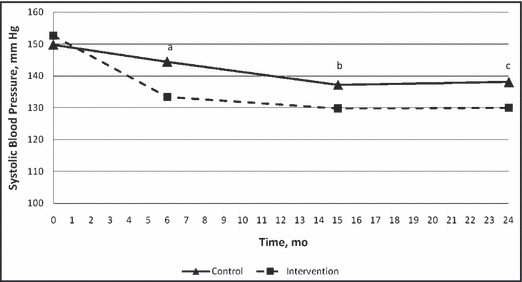
Mean systolic blood pressures. a, P<.001; b, P=.0015; c, P=.0023.
Figure 3.
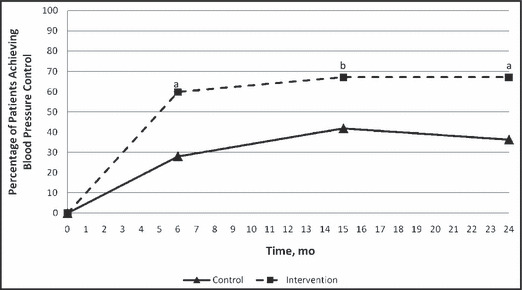
Blood pressure control. a, P<.0001; b, P=.0003.
Because there was an imbalance in number of patients with diabetes or CKD between groups, and because BP goals are more aggressive for such patients, we evaluated BP only in those groups (Table III). Table III displays that mean BPs and BP control was also much better in the intervention group when compared with the control group. Controlled BP was achieved in 24.1% of patients with diabetes or CKD in the control group and 47.4% in the intervention group at the end of the prospective study (P=.049; Table III). At 15 months, BP was controlled in 25.9% patients who had diabetes or CKD in the control group and in 42.1% in the intervention group (P=not significant [NS]; Table III). At the 24‐month time point (18 months post‐intervention), 17.2% of patients in the control group and 57.9% patients in the intervention group had controlled BP (P=.01; Table III).
Table III.
BP Control in Patients With Diabetes or Chronic Kidney Disease
| Baseline | 6 Months | 15 Months | 24 Months | |
|---|---|---|---|---|
| Systolic BP, mm Hg | ||||
| Control (n=58) | 146.8±16.0 | 142.1±21.5 | 136.7±18.7 | 139.1±17.6 |
| Intervention (n=19) | 153.6±16.2 | 131.0±19.7a | 128.2±13.6 | 127.6±14.6b |
| Diastolic BP, mm Hg | ||||
| Control | 81.2±10.9 | 77.6±13.2 | 77.2±10.6 | 79.0±11.4 |
| Intervention | 84.6±15.8 | 73.5±13.9 | 79.1±9.9 | 75.1±9.3 |
| No. (%) achieving BP control | ||||
| Control | 0 | 14 (24.1) | 15 (25.9) | 10 (17.2) |
| Intervention | 0 | 9 (47.4)c | 8 (42.1) | 11 (57.9)d |
Blood pressure (BP) control was defined as <130/80 mm Hg. a.049. b.013. c.054. d.010.
We conducted sensitivity analysis in order to make the most conservative evaluation possible because of the uneven patient distribution. This analysis provided the most favorable assumption for patients in the control group who had diabetes or CKD, where 100% were assumed to have achieved BP control. In this analysis, the intervention group was left unchanged. Under this unlikely scenario, BP was controlled in 58% of all patients at 6 months in the control group (n=146) and 64.6% in the intervention group (n=82) (NS). By 15 months, the BP control rates in the sensitivity analysis was 41.8% in the control group and 67.1% in the intervention group (P=.0002). At the 24‐month period, the BP control rates were 36.3% in the control group and 67.1% in the intervention group (P<.0001).
Physician guideline adherence scores at baseline prior to the intervention were significantly higher in the control group compared with the intervention group, 49.9±18.9 vs 40.3±22.4, respectively (P=.0008; Table II). After the 6‐month intervention, scores in both groups increased to 54.8±17.3 in the control group and 63.7±12.4 in the intervention group (P<.0001). Physician adherence to guidelines decreased in both groups at the 15‐ and 24‐month time points compared with the end of the 6‐month intervention, and there was no difference between groups at these time points (Table II).
Examination of individual adherence criteria at baseline revealed that a goal BP was documented for 7 (4.8%) and 2 (2.4%) patients in the control and intervention groups at baseline, respectively (P=.49). Credit was given for documenting goal BP if it was documented either at baseline or during the specified follow‐up period. By 6 months, a goal BP was documented in 6 (4.1%) control patients vs 76 (92.7%) intervention patients (P<.0001). Following discontinuation of the prospective trial, documentation increased in the control group (12 [8.2%] patients), and remained constant in the intervention group (76 [92.7%] patients), at both the 15‐ and 24‐month time points (P<.0001). Another individual adherence score criterion evaluated whether patients were provided with their BP goals. At baseline, only 1 patient in both the control and intervention groups were provided with their goal BP (P=.5). At 6 months, 3 (2.1%) patients in the control group and 71 (86.6%) patients in the intervention group were provided with their goal BP (P<.0001). These percentages remained constant at 15 and 24 months in both groups: 3 (2.1%) and 71 (86.6%) patients in the control and intervention, respectively (P<.0001). The vast majority of the documented goal BPs and documentation that patients were provided with their goal BP was recorded in the medical record by the pharmacist.
Following the end of the retrospective study, the 3 intervention pharmacists were questioned in an open‐ended survey to determine their degree of contact with study patients once the intervention ended. Each was asked the degree to which they continued to intervene in patients’ BP care following discontinuation of the 6‐month study. The pharmacists indicated they had minimal interaction with study patients once the 6‐month intervention ended. Review of the medical records indicated that between the 6‐ and 15‐month time periods, two patients in the control group had contacts with the pharmacist or pharmacy students for medication reviews. Six patients in the intervention group were seen by a pharmacist between 6 and 15 months, 2 patients had one visit each for hypertension, while 4 other patients had 19 visits for anticoagulation management. One patient in the intervention group had 13 visits between 15 and 24 months, all for anticoagulation management, although BP treatment was sometimes discussed. Five patients in the control group each had one visit with pharmacy students for medication review between the 15‐ and 24‐month period.
Discussion
This study found that BP control was maintained for 18 months after the 6‐month collaborative, team‐based intervention was discontinued. BP in both groups declined even further at the 15‐month period and plateaued at 24 months compared with baseline. However, the overall difference in BP control between groups was 32% at the end of the 6‐month parent trial, and the difference remained 31% even 18 months after the discontinuation of the intervention (24‐month time point). We are unsure as to the reason BP continued to improve between 6 and 15 months. We theorize that because the intervention period was short and many patients still had uncontrolled BP, providers in both groups may have made medication additions at the 6‐month visit since this was a final milestone visit in the prospective study. The effects of any medication adjustments at 6 months may not have been manifested until the 15‐month visit.
The findings from this study are similar to findings from two smaller studies in which BP control deteriorated following discontinuation of a physician‐pharmacist intervention. 19 , 20 The first was a retrospective pilot analysis in 104 patients that evaluated BP control at 9 and 18 months following a 9‐month physician‐pharmacist intervention. 19 At the end of the 9‐month intervention, BP was controlled in 79% of patients in the intervention group and 49% of patients in the control group. At 9 months post‐intervention, BP control had deteriorated to 54% in the intervention group and 31% in the control group, with similar values at the 18‐month time point. Although BP deteriorated in both groups, BP control remained significantly higher in the intervention group than in the control group at all time periods post‐intervention (P<.001 at 9 months, and P<.001 at 18 months post‐intervention).
The parent study also evaluated provider adherence to BP guidelines at baseline and 6 months. 6 Adherence scores in the control and intervention groups improved 8% and 55%, respectively. In an unadjusted analysis, these values were significantly different (P=.04); however, after adjusting for covariates, a between‐group comparison showed that the results were not significant (P=.09). 6 Scores in both groups showed a need for improvement, where about one third of the eligible criteria were not met in the intervention group and almost half were unmet in the control group. After the intervention was stopped, overall adherence scores decreased in both groups, with no significant difference between groups at 15 or 24 months (Table II). This is similar to another study that found a nonsignificant increase in guideline adherence following data abstraction from patients’ medical charts comparing successive calendar quarters. 16
The present study found significantly better guideline adherence scores at 6 months in the intervention group. This finding, in large measure, was due to medication adjustments and follow‐up within 1 month whenever BP was not controlled in the physician‐pharmacist–managed group. Examination of the specific adherence criteria in the present study showed that a BP goal was documented significantly more in the intervention group than in the control group at 15 and 24 months (P<.0001), which is one of the follow‐up intensity measures in the adherence tool. 17 Patients in the intervention group were also much more likely to have been informed of their goal BP at both the 15‐ and 24‐month time points (P<.0001 at 15 and 24 months), which is another criterion in the tool. 17 These criteria may not directly relate to BP control, but they do illustrate that involvement from a pharmacist can significantly improve goal‐directed therapy.
Unlike the previous studies mentioned, the present study found that BP control improved in both the control and intervention groups following discontinuation of the prospective study. In both groups, the average systolic BP was lower at 15 and 24 months than at 6 months when the prospective study and intervention ended. Systolic BP did begin to deteriorate slightly in the control group but not the intervention group (Table II; Figure 2). These findings were also observed in patients with diabetes or CKD (Table III). Overall BP control followed this same pattern, where it improved in both groups following the discontinuation of the parent study and deteriorated slightly in the control group but not in the intervention group. These findings suggest that an effect of the intervention continued following discontinuation of the intervention. It is not known why BP control seemed to be maintained in the intervention group when compared with the two previous studies that found control quickly deteriorated following removal of the intervention. 19 , 20 We do not believe these findings were due to a more potent intervention. One of the previous studies mentioned was conducted by some of the same investigators as the present report and, if anything, that intervention was more intensive than the present study. 4 It does not appear that the sustained BP control in either the control or intervention group were due to continued visits with the pharmacist after the intervention stopped since such visits were rare. These results might be explained by a sustained influence of the intervention, continued efforts on the part of physicians to maintain control, or a combination of these effects. An ongoing prospective, cluster randomized trial in 27 medical offices around the United States is evaluating a 9‐month and 24‐month intervention compared with a control group to answer some of these questions. 21
Another possible reason for the continued improvement in BP control is increased patient motivation. After being in the study, patients may have been more motivated to improve their BP. It is also possible that any medication changes that took place toward the end of the intervention may not have had time to produce a full effect and continued to improve BP after the 6‐month trial period was complete.
Limitations
During the prospective clinical trial, research nurses were trained on proper measurement techniques using an automated device. The BP values abstracted from patient medical records at 15 and 24 months were recorded by office nurses or physicians. Therefore, BP values in the prospective study and the BPs abstracted at 15 and 24 months may not be directly comparable. However, since our analyses involved comparisons between groups, the findings are likely clinically important. Typical BP measurements made in the medical office are often measured inaccurately and can have significant variability and error. 22 Since most of the measurement errors such as failure to achieve adequate rest, improper positioning, and too small of a cuff, lead to inappropriately high BPs, we believe the 15‐ and 24‐month values could have been lower if BP had been measured using rigorous research BP measurements.
Another limitation in this study is the relatively small sample size with few minorities. However, BP control rates at 6 months were very similar in the 402 patients in the parent study as the smaller numbers in the present trial. For instance, BP control at 6 months in the parent study was 29.9% and 63.9% in the control and intervention group compared with 28.7% and 64.6%, respectively, in the present study. Likewise, guideline adherence scores in the parent study increased from 49.4% criteria met to 53.4% in the control group, and from 40.4% to 62.8%, respectively, in the intervention group. These percentages are within 0.1% to 1.4% points of the scores in the present study. These findings suggest that the smaller sample was still representative of the larger population in the parent study.
The study section at the National Institutes of Health that reviewed the grant application for this study encouraged the use of randomization by clinic rather than by physician or patient to avoid contamination. This approach led to uneven patient characteristics especially with more patients with diabetes and CKD in the control group. However, we conducted a sensitivity analysis to prove the findings were not due to more patients in the control group with lower BP goals. The sensitivity analysis assumed that 100% of patients in the control group with diabetes or CKD achieved BP control. Even under this extremely unlikely scenario, the BP control rates at 15 and 24 months remained highly significantly different in favor of the intervention group. The sensitivity analysis suggests that the findings were not due to greater numbers of patients with diabetes or CKD in the control group.
Cluster randomized designs should include at least 6 or 7 clinics per study arm and ideally more to limit uneven patient distribution. To overcome these limitations, increase the number of minorities, and prospectively evaluate discontinuation of the intervention, the previously mentioned trial is being conducted. 21 This study involves 27 primary care clinics around the United States and will recruit large numbers of Hispanics and African Americans. Results can be expected in 2013–2014. 21
Conclusions
This study found significantly higher BP control in the intervention group than the control group after 18 months following discontinuation of a 6‐month physician‐pharmacist intervention. Unlike previous studies, BP continued to improve in both groups after the intervention was discontinued, although BP control eventually did deteriorate in the control group by 18 months. This study suggests that there is prolonged benefit on BP from a pharmacist intervention. More research is needed to determine the most effective strategy for maintaining BP control following team‐based care.
Acknowledgments
Disclosures: Funding for this project was supported by the Agency for Healthcare Research and Quality (AHRQ) Centers for Education and Research on Therapeutics Cooperative Agreement #5U18HSO16094 and the National Heart, Lung, and Blood Institute, RO1 HL69801. Dr Carter and Ms Franciscus are also supported by the Center for Research in Implementation in Innovative Strategies in Practice (CRIISP), Department of Veterans Affairs, Veterans Health Administration, Health Services Research and Development Service (HFP 04‐149). The views expressed in this article are those of the authors and do not necessarily reflect the position or policy of the Department of Veterans Affairs.
References
- 1. Kannel WB. Hypertension: reflections on risks and prognostication. Med Clin North Am. 2009;93:541–558. [DOI] [PMC free article] [PubMed] [Google Scholar]
- 2. Chobanian AV, Bakris GL, Black HR, et al. The Seventh Report of the Joint National Committee on Prevention, Detection, Evaluation, and Treatment of High Blood Pressure: the JNC 7 report. JAMA. 2003;289:2560–2572. [DOI] [PubMed] [Google Scholar]
- 3. Egan BM, Zhao Y, Axon RN. US trends in prevalence, awareness, treatment, and control of hypertension, 1988–2008. JAMA. 2010;303:2043–2050. [DOI] [PubMed] [Google Scholar]
- 4. Carter BL, Bergus GR, Dawson JD, et al. A cluster randomized trial to evaluate physician/pharmacist collaboration to improve blood pressure control. J Clin Hypertens (Greenwich). 2008;10:260–271. [DOI] [PMC free article] [PubMed] [Google Scholar]
- 5. Hunt JS, Siemienczuk J, Pape G, et al. A randomized controlled trial of team‐based care: impact of physician–pharmacist collaboration on uncontrolled hypertension. J Gen Intern Med. 2008;23:1966–1972. [DOI] [PMC free article] [PubMed] [Google Scholar]
- 6. Carter BL, Ardery G, Dawson JD, et al. Physician and pharmacist collaboration to improve blood pressure control. Arch Intern Med. 2009;169:1996–2002. [DOI] [PMC free article] [PubMed] [Google Scholar]
- 7. Borenstein JE, Graber G, Saltiel E, et al. Physician–pharmacist comanagement of hypertension: a randomized, comparative trial. Pharmacotherapy. 2003;23:209–216. [DOI] [PubMed] [Google Scholar]
- 8. Von Muenster SJ, Carter BL, Weber CA, et al. Description of pharmacist interventions during physician–pharmacist co‐management of hypertension. Pharm World Sci. 2008;30:128–135. [DOI] [PubMed] [Google Scholar]
- 9. Green BB, Cook AJ, Ralston JD, et al. Effectiveness of home blood pressure monitoring, Web communication, and pharmacist care on hypertension control: a randomized controlled trial. JAMA. 2008;299:2857–2867. [DOI] [PMC free article] [PubMed] [Google Scholar]
- 10. Robinson JD, Segal R, Lopez LM, et al. Impact of a pharmaceutical care intervention on blood pressure control in a chain pharmacy practice. Ann Pharmacother. 2010;44:88–96. [DOI] [PubMed] [Google Scholar]
- 11. Carter BL, Rogers M, Daly J, et al. The potency of team‐based care interventions for hypertension: a meta‐analysis. Arch Intern Med. 2009;169:1748–1755. [DOI] [PMC free article] [PubMed] [Google Scholar]
- 12. Pickering TG, Hall JE, Appel LJ, et al. Recommendations for blood pressure measurement in humans and experimental animals: Part 1: blood pressure measurement in humans: a statement for professionals from the Subcommittee of Professional and Public Education of the American Heart Association Council on High Blood Pressure Research. Hypertension. 2005;45:142–161. [DOI] [PubMed] [Google Scholar]
- 13. Wright JT Jr, Bakris G, et al. Effect of blood pressure lowering and antihypertensive drug class on progression of hypertensive kidney disease: results from the AASK trial. JAMA. 2002;288:2421–2431. [DOI] [PubMed] [Google Scholar]
- 14. Morisky DE, Green LW, Levine DM. Concurrent and predictive validity of a self‐reported measure of medication adherence. Med Care. 1986;24:67–74. [DOI] [PubMed] [Google Scholar]
- 15. Morisky DE, Levine DM, Green LW, et al. Five‐year blood pressure control and mortality following health education for hypertensive patients. Am J Public Health. 1983;73:153–162. [DOI] [PMC free article] [PubMed] [Google Scholar]
- 16. Ardery G, Carter BL, Milchak JL, et al. Explicit and implicit evaluation of physician adherence to hypertension guidelines. J Clin Hypertens (Greenwich). 2007;9:113–119. [DOI] [PMC free article] [PubMed] [Google Scholar]
- 17. Milchak JL, Carter BL, Ardery G, et al. Development of explicit criteria to measure adherence to hypertension guidelines. J Hum Hypertens. 2006;20:426–433. [DOI] [PMC free article] [PubMed] [Google Scholar]
- 18. Milchak JL, Carter BL, Ardery G, et al. Physician adherence to blood pressure guidelines and its effect on seniors. Pharmacotherapy. 2008;28:843–851. [DOI] [PubMed] [Google Scholar]
- 19. Carter BL, Doucette WR, Franciscus CL, et al. Deterioration of blood pressure control after discontinuation of a physician–pharmacist collaborative intervention. Pharmacotherapy. 2010;30:228–235. [DOI] [PMC free article] [PubMed] [Google Scholar]
- 20. McKenney JM, Slining JM, Henderson HR, et al. The effect of clinical pharmacy services on patients with essential hypertension. Circulation. 1973;48:1104–1111. [DOI] [PubMed] [Google Scholar]
- 21. Carter BL, Clarke W, Ardery G, et al. A cluster‐randomized effectiveness trial of a physician–pharmacist collaborative model to improve blood pressure control. Circ Cardiovasc Qual Outcomes. 2010;3:418–423. [DOI] [PMC free article] [PubMed] [Google Scholar]
- 22. Villegas I, Arias IC, Botero A, et al. Evaluation of the technique used by health‐care workers for taking blood pressure. Hypertension. 1995;26:1204–1206. [DOI] [PubMed] [Google Scholar]