

Abstract
Rationale and Objectives
Cerebral oxygen extraction, defined as the difference between arterial and venous oxygen saturations (SaO2 and SvO2), is a critical parameter for managing intensive care patients at risk for neurological collapse. Although quantification of SaO2 is easily performed with pulse oximetry or moderately invasive arterial blood draws in peripheral vessels, cerebral SvO2 is frequently not monitored because of the invasiveness and risk associated with obtaining jugular bulb or super vena cava (SVC) blood samples.
Materials and Methods
In this study, near-infrared spectroscopy (NIRS) was used to noninvasively measure cerebral SvO2 in anesthetized and mechanically ventilated pediatric patients (n = 10). To quantify SvO2, the NIRS signal component that fluctuates at the respiration frequency is isolated. This respiratory component is dominated by the venous portion of the interrogated vasculature. The NIRS measurements of SvO2 were validated against the clinical gold standard: invasively measured oxygen saturations from SVC blood samples. This technique was also applied in healthy volunteers (n = 5) without mechanical ventilation to illustrate its potential for use in healthy populations with natural airways.
Results
Ten pediatric patients with pulmonary hypertension were studied. In these patients, SvO2 in the SVC exhibited good agreement with NIRS-measured SvO2 (R2 = 0.80, P = .001, slope = 1.16 ± 0.48). Furthermore, in the healthy adult volunteers, mean (standard deviation) NIRS-measured SvO2 was 79.4 (6.8)%. This value is in good agreement with the expected average central venous saturation reported in literature.
Conclusion
Respiration frequency-selected NIRS can noninvasively quantify cerebral SvO2. This bedside technique can be used to help assess brain health in neurologically unstable patients.
Keywords: Near-infrared spectroscopy, cerebral venous oxygenation, pediatrics, validation, noninvasive
Oxygen extraction is an important parameter for assessment of brain tissue health in many critically ill patient populations at risk for altered cerebral hemodynamics. Knowledge of cerebral oxygen extraction helps the clinician balance oxygen delivery with cerebral demand thus preventing cell death secondary to metabolic failure. This quantity can be approximated from the difference between the saturation of arterial blood received by the brain and saturation of the venous blood leaving the brain. However, the gold standard for measurement of cerebral venous saturation remains a highly invasive procedure: central venous catheterization followed by direct measurement of oxygen saturation in the jugular bulb by oximetry (1). Although jugular catheters are commonly placed in adult critical care patients, these catheters pose substantial challenges in younger/smaller patients. Smaller, shorter necks make placement of these catheters difficult, and in-dwelling catheters can lead to complications such as line-associated thrombosis and an increased risk of line-associated infection (2,3). Thus, an easy-to-acquire, noninvasive measurement of central venous oxygen saturation (SvO2) would potentially enable continuous assessment of cerebral oxygen extraction. Further, this development would provide an opportunity for the clinician to make informed decisions in balancing systemic hemodynamics to achieve optimal cerebral oxygen delivery.
Near-infrared spectroscopy (NIRS) is a widely accepted noninvasive modality for quantifying blood volume and oxygen saturation (4–6). Although it is mostly used to measure tissue oxygen saturation, a handful of publications have shown that NIRS can measure venous oxygen saturation. Typically, such schemes require a functional perturbation of cerebral blood volume to isolate the venous component of the optical signal, such as tilting of the head or venous occlusion (7–9). However, these measurements are feasible only during perturbation and thus do not offer the possibility of continuous monitoring of SvO2. Furthermore, the potential to use such perturbations in clinical settings is limited. Postural manipulation in preterm infants, for example, has been shown to cause changes in intracranial pressure, increasing the risk of intracranial hemorrhage (10).
As an alternative to functional perturbation methods for quantification of SvO2, isolation of the venous component of the NIRS signal using the oscillations of venous blood volume caused by respiratory excursions is possible (11–14). Briefly, the method we use relies on the fact that blood volume in the veins oscillates at the respiration rate. This sensitivity to the venous portion of the vasculature arises because of the relatively large compliance of veins; pressure oscillations thus affect the venous components of the vasculature more than the rest of the vasculature (14,15). This method has been used in neonates (14) and adults (11,13,12) and it has been validated against the gold standard venous blood draw in the hind leg of piglets (12). Although encouraging, the total number of studies is still limited and rigorous validation of this method in humans has not been performed. To this end, we validate the respiratory frequency–locked NIRS method in humans against gold standard invasive measurements of central venous saturation. The investigation was carried opportunistically as part of a larger observational study of a human pediatric population with pulmonary hypertension undergoing cardiac catheterization. This population is attractive for validation because all subjects are mechanically ventilated at a constant respiration rate and because superior vena cava (SVC) saturations are measured as part of the clinical protocol. In addition, the method is applied to five healthy volunteers to demonstrate that it can be generalized to populations whose respiration rate is volitionally, not mechanically, controlled.
MATERIALS AND METHODS
Population
The pulmonary hypertension team at the Children’s Hospital of Philadelphia identified and screened for study inclusion all patients undergoing cardiac catheterization to diagnose or treat pulmonary hypertension and who were approached for participation. All subjects had pulmonary hypertension and were receiving an intravascular catheterization procedure for clinical purposes. SVC blood samples were obtained as part of the clinical procedure.
In addition to this validation study, five healthy adult volunteers were recruited to test the method feasibility for use in other populations.
This study was approved by the Children’s Hospital of Philadelphia Institutional Review Board.
Study Protocol
All subjects in the validation study were placed under general anesthesia (via sevo- and isoflurane and pancuronium) and mechanically ventilated on room air. After sedation, a flexible black rubber optical probe was placed on the right or left side of the subject’s forehead and secured with an elastic bandage. As part of routine clinical care, a central venous catheter was placed using access from the right internal jugular vein (n = 3) or a femoral vein (n = 7). Access to the SVC, between the right subclavian and left innominate veins, was thus obtained and confirmed with fluoroscopy. After hemodynamic stability was confirmed, a blood sample from the SVC was obtained and a measurement of cerebral venous oxygen saturation ( ) was quantified using a whole blood oximeter (Avoximeter 1000E, International Technidyne Corporation, Edison, NJ). Immediately after obtaining the SVC blood sample, NIRS data were acquired continuously at 6 Hz for 2 minutes to get an optical estimate of SvO2. Vital signs, including blood pressure and heart rate, were monitored continuously.
To demonstrate the feasibility of the frequency-filtered, noninvasive NIRS method in other populations (e.g., non-ventilated healthy humans), we acquired optical data from five healthy volunteers. The same optical probe was secured to the volunteer’s forehead with an elastic bandage. NIRS data were acquired for 10 minutes at approximately 6 Hz. During data acquisition, the subject was instructed to inhale to the beat of a metronome set at the subject’s resting state respiration (approximately 0.18 Hz) in order to maintain a steady respiration rate.
NIRS: Theory, Instrumentation, and Analysis
NIRS employs near-infrared light to probe the blood oxygenation state of deep tissues (6). NIRS is a well-established modality that measures the concentration of the major chromophores in brain tissue in situ, namely oxy- and deoxyhemoglobin ([HbO2] and [Hb]). The NIRS device used in this study is a frequency domain system (Imagent, ISS Inc., Champaign, IL) operating at 110 MHz and employing two wavelengths (λ = 688 and 830 nm). It uses heterodyne detection to quantify diffusive wave (AC) amplitude attenuation. A schematic of our data acquisition setup is shown in Figure 1. From changes in the AC amplitude of the detected light at the two wavelengths, we derive changes in the wavelength-dependent tissue absorption coefficient, Δμa(λ, t), relative to the first 30 seconds of data acquisition using the modified Beer-Lambert law, i.e.,
Figure 1.
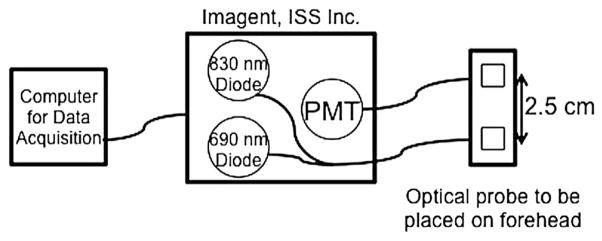
A schematic diagram of the aspects of the data acquisition setup used in this study. PMT, photomultiplier tubes.
| (1) |
In this equation, I(l) is the AC light intensity at wave-length l at time t, Io(l ) is the mean AC light intensity during the first 30 seconds of the data acquisition period, DPF(L) is the differential path length factor that accounts for the increased distance that light travels in tissue because of scattering (16), and r is the distance between the source and detector optical fiber on the skin surface. In this experiment, r = 2.5 cm. The change in the absorption coefficient, Δμa(l, t), is linearly dependent on the change of [HbO2] and [Hb]; thus, differential (Δ) transmission data at the two wavelengths yields Δ[HbO2] and Δ[Hb]. Figures 1b and 2a show a sample time series of Δ[Hb] and Δ[HbO2] obtained from this experiment.
Figure 2.

Sample time series of differential (Δ) oxyhemoglobin (Δ[Hb]) (a) and deoxyhemoglobin ([ΔHbO2]) (b). Fast Fourier transform (FFT) of the Δ[Hb] time series (c) and the Δ[HbO2] time series (d). The dashed lines indicate the respiration rate, the second harmonic of the respiration rate, and the heart rate. The bottom two plots show sample time series of Δ[Hb] (e) and Δ[HbO2] (f) after bandpass filtering at the respiration rate/frequency.
Using the time series of Δ[HbO2] and Δ[Hb] and following the method outlined elsewhere (12), we derive a measure of venous oxygen saturation with NIRS, which we denote herein as , that represents the microvasculature underneath the optical probe that is secured to the subject’s forehead. Briefly, this method quantifies the changes in [HbO2] and [Hb] that occur at the respiration frequency and makes the assumption that these changes are happening mostly in the veins.
Specifically, we apply a narrow bandpass frequency filter (filter.m, Mathworks) to the signal that selects contributions only from frequencies within 1% of the subject’s known respiration rate. The resultant times series of [HbO2] and [Hb] variation (i.e., with frequencies within 1% of the respiration rate) is due to mostly venous blood, because the venous blood volume will be oscillating predominantly at this frequency. This resultant filtered time series is exhibited in Figures 2e and 2f. We assume that the saturation of the blood that is displaced from the veins during respiration is representative of the saturation of all venous blood. We calculate the saturation of the displaced blood by first quantifying the amplitudes for each period of these filtered time series, denoted here as AD[Hb]resp and AΔ[HbO2]resp. Then is calculated for each period as
| (2) |
A value of for each subject is obtained by averaging over all periods.
The data quality of this measurement is related to the signal strength at the respiration rate/frequency. To evaluate this signal strength, we compare the peak of the fast Fourier transform (FFT) component of the signal at the respiration rate/frequency to the standard deviation of the Fourier components of the signal at nearby frequencies. Specifically, we define a signal-to-noise ratio (SNR) for the for both Δ[Hb] and Δ[HbO2] to be and , respectively. Here (FFT(Hb))freq=resp is the peak of the Fourier signal of Δ[Hb] at the respiration frequency (Fig 2c) and σfreq<resp is the standard deviation of the Fourier signals at frequencies between the respiration rate/frequency and 32.5 MHz less than the respiration rate/frequency. In practice, we only use the standard deviation at lower frequencies because the variance in the Fourier signal of the lower frequencies is large compared to that at the higher frequencies. All data with SNRHbO2 <2.5 and/or SNRHb<2.5 are excluded from the subsequent analysis. This process is summarized in Figure 3.
Figure 3.

Flowchart of data processing. Δμa(λ), change in the wavelength-dependent absorption property of tissue; Δ[Hb], change in deoxyhemoglobin; ΔHbO2, change in oxyhemoglobin; SNR, signal-to-noise ratio; , venous saturation measured noninvasively with near-infrared spectroscopy.
Statistical Analysis
All statistical analyses were performed using R 2.11 software (17). Statistical significance was declared for P values <.05. To quantify the relationship between venous saturation measured non-invasively with NIRS and , we fit a simple linear regression model. We report the Pearson’s correlation coefficient, R, which varies from 0 to 1.0 to estimate the extent to which a linear model explains variability in the data. Note that R gives only a measure of linear correlation. To quantify the agreement between and , we report Lin’s concordance correlation coefficient, which combines a measure of precision and accuracy (18). A Bland-Altman plot was constructed to visualize the extent of agreement between the two methods (19).
RESULTS
Validation Study
Twenty-two patients were consented for this study. Of this population, 10 patients (ages between 2 months and 14 years) had both SVC blood samples obtained during the catheterization and usable optical data (i.e., based on the criteria stated in the NIRS: Theory, Instrumentation, and Analysis section). Patient characteristics are summarized in Table 1.
TABLE 1.
Median (IQR) of Patient Demographics
| Median (IQR) | |
|---|---|
| Age (y) | 5.3 (1.3, 9.7) |
| Weight (kg) | 15.3 (8.7, 24.1) |
| Height (cm) | 99.9 (69.9, 124.8) |
| Sex (male:female) | 5:5 |
IQR, interquartile range.
Table 2 shows median (interquartile range) SvO2 measured with both NIRS and cooximetry. As shown in Figure 4, we see a strong and significant linear relationship (R2 = 0.80, P < .001) between optically measured and the , with a slope (95% confidence interval) of 1.16 (0.68–1.64). The Bland-Altman plot (Fig 5) for these two measurements suggests good agreement, with a mean difference of 2.61 (−4.56 to 9.77). The concordance coefficient of 0.80 is high.
TABLE 2.
Median (IQR) of Patient Measurements during Cardiac Catheterization
| Median (IQR) | ||
|---|---|---|
| Respiration rate (breaths/min) | 20 (17, 20) | |
| Heart rate (beats/min) | 103 (87, 134) | |
|
|
64 (62, 67) | |
|
|
59.6 (56.4, 65.9) | |
| SNRHb | 50.0 (16.5, 111.0) | |
| SNRHbO2 | 25.5 (18.4, 51.8) |
IQR, interquartile range; SNRHb, signal-to-noise ratio of the deoxyhemoglobin signal; SNRHbO2, signal-to-noise ratio of the oxyhemoglobin signal; , venous saturation measured noninvasively with near-infrared spectroscopy; , cerebral venous oxygen saturation from a superior vena cava blood sample.
Figure 4.

Cerebral venous saturation measured with near-infrared spectroscopy compared to venous saturation measured from a blood sample invasively taken from the super vena cava (SVC). The solid line represents the best-fit line to the data (R2 = 0.80, P < .001); the dashed line indicates the line of perfect concordance; and the gray ribbon denotes the 95% confidence interval for the mean venous saturation (SvO2) measured noninvasively with near-infrared spectroscopy.
Figure 5.

Bland-Altman plot of the difference in and versus the mean of these two parameters. The solid horizontal line indicates the mean difference between these two parameters; the dotted lines indicate the 95% limits of agreement. , venous saturation measured noninvasively with near-infrared spectroscopy; , venous saturation measured from a blood sample from the superior vena cava.
Healthy Volunteers
To demonstrate feasibility in other populations, was measured in five healthy volunteers. The average (standard deviation) calculated over a 10-minute period in each healthy subject was 79.4 (6.8)%. This value is in good agreement with the expected average central venous saturation for a healthy adult of 76.8 ± 1.0% (20). Importantly, even though these subjects were awake and not using a respirator, the data quality was sufficient for accurate determination of in each subject, with an average (standard deviation) SNRHbO2 of 57.6 (33.8) and SNRHb of 31.9 (27.5).
DISCUSSION
Significant (R2 = 0.80, P < .001) correlation and agreement (slope = 1.16 ± 0.48) was observed between cerebral venous saturations determined by respiration-frequency filtered NIRS and by the gold standard measurement of central venous saturation (i.e., oximetry of blood samples taken from the SVC). is a measure of the venous saturation in the microvasculature underneath the optical probe that is secured to the subject forehead. is a measure of central venous saturation, which includes venous saturation of the brain and upper extremities. Roughly speaking, we would expect these values to be similar in anesthetized patients, in which the vast majority of oxygen consumption occurs in the brain. Thus, even though the two methods derive venous saturation from two different vasculatures, the agreement between them is encouraging.
We measured in free-breathing volunteers to demonstrate the feasibility of this technique in subjects who are not mechanically ventilated. The measured in the healthy volunteers is in good agreement with the average central venous saturation for a healthy adult of 76.8 ± 1.0% (20), illustrating feasibility of this method in other (less-controlled) populations.
One of the main limitations of the optical method derives from use of a bandpass filter for isolating the respiration frequency. Optical data were acquired on 20 subjects; however was only calculated for 10 of these subjects because poor SNRHbO2 or SNRHb (see the NIRS: Theory, Instrumentation, and Analysis section). We found that lowering this SNR cutoff to below two in this patient group introduces significantly more scatter into the total population data; thus, it is imperative to maintain a high SNR for this measurement. Many factors can contribute to poor SNR, all of which indicate a less pronounced signal peak at the respiration rate in the frequency domain. These factors include motion artifacts, low amplitude of detected light, and irregular respiration. To minimize motion artifacts, we found that it is imperative to secure the optical probe with an elastic bandage (e.g., instead of manually holding the probe during measurement). This adjustment in our measurement protocol yielded improved data quality in later recruited subjects. We also observed that SNR can be improved by acquiring data for longer than 2 minutes, but because of the restraints of the clinical setting this was not possible in this study. In future studies, these SNR criteria can provide a useful new filter for data quality for this measurement.
Despite the caveats noted here, the method proved to work quite well in this patient population. Our worst deviation from was less than 10%, which we find encouraging given the approximate nature of the models used in the analysis. We note that is a measure of the local venous saturation of the vasculature probed by the NIRS light. In many cases of injury or impairment in which heterogeneity of cerebral saturations may exist (e.g., stroke, hemorrhage), the optical method need not yield a quantity that is representative of the global cerebral SvO2 and thus should not be expected to agree with . These deviations, however, could find use for monitoring local injury and therapy responses.
CONCLUSIONS
We have validated respiratory-frequency filtered diffuse optical spectroscopy (NIRS) as a measure of cerebral venous oxygen saturation against a gold standard measurement in humans. Specifically, we employed NIRS to measure immediately after the clinicians measured and found good agreement between these two methods. We also demonstrated the feasibility for generalizing this method to other populations by measuring in healthy volunteers. Validation of this technique against the clinical gold standard in humans is the first step toward its wide use in clinical setting. Further work is needed to realize the potential of this noninvasive monitor of cerebral SvO2 for management of critically ill patients with high risk of ischemic brain injury.
Acknowledgments
We acknowledge invaluable assistance from Steven Schenkel, Madeline Winters, Jeanie Acampora, Heather Meluskey, and the cardiac anesthesiologists and staff of the cardiac catheterization laboratories at Children’s Hospital of Philadelphia. This work was supported by National Institutes of Health Grant Nos. HL-007953, NS-060653, P41-EB015893, PS30-HD026979, HL-007915, and NS-072338; the Thrasher Research Foundation; and the June and Steve Wolfson Family Foundation.
References
- 1.Schell RM. Cerebral monitoring: jugular venous oximetry. Anesthes Analg. 2000;90:559–566. doi: 10.1097/00000539-200003000-00012. [DOI] [PubMed] [Google Scholar]
- 2.Raad I. Intravascular-catheter-related infections. Lancet. 1998;351:893–898. doi: 10.1016/S0140-6736(97)10006-X. [DOI] [PubMed] [Google Scholar]
- 3.Ruesch S, Walder B, Tramer MR. Complications of central venous catheters: internal jugular versus subclavian access–a systematic review. Crit Care Med. 2002;30:454–460. doi: 10.1097/00003246-200202000-00031. [DOI] [PubMed] [Google Scholar]
- 4.Yodh A, Chance B. Spectroscopy and imaging with diffusing light. Phys Today. 1995;48:34–40. [Google Scholar]
- 5.Owen-Reece H, Smith M, Elwell CE, et al. Near infrared spectroscopy. Br J Anesth. 1999;82:418–426. doi: 10.1093/bja/82.3.418. [DOI] [PubMed] [Google Scholar]
- 6.Durduran T, Choe R, Baker WB, et al. Diffuse optics for tissue monitoring and tomography. Rep Progr Phys. 2010:73. doi: 10.1088/0034-4885/73/7/076701. [DOI] [PMC free article] [PubMed] [Google Scholar]
- 7.Nitzan M, Babchenko A, Khanokh B, et al. Measurement of oxygen saturation in venous blood by dynamic near infrared spectroscopy. J Biomed Opt. 2000;5:155–162. doi: 10.1117/1.429982. [DOI] [PubMed] [Google Scholar]
- 8.Skov L, Pryds O, Greisen G, et al. Estimation of cerebral venous saturation in newborn infants by near infrared spectroscopy. Pediatr Res. 1993;33:52–55. doi: 10.1203/00006450-199301000-00011. [DOI] [PubMed] [Google Scholar]
- 9.Yoxall CW, Weindling AM, Dawani NH, et al. Measurement of cerebral venous oxyhemoglobin saturation in children by near-infrared spectroscopy and partial jugular venous occlusion. Pediatr Res. 1995;38:319–323. doi: 10.1203/00006450-199509000-00008. [DOI] [PubMed] [Google Scholar]
- 10.Goldberg RN, Joshi A, Moscoso P, et al. The effect of head position on intracranial pressure in the neonate. Crit Care Med. 1983;11:428–430. doi: 10.1097/00003246-198306000-00006. [DOI] [PubMed] [Google Scholar]
- 11.Brown D, Haensse D, Bauschatz A, et al. NIRS measurement of venous oxygen saturation in the adult human head. Adv Exp Med Biol. 2006;578:251–256. doi: 10.1007/0-387-29540-2_40. [DOI] [PubMed] [Google Scholar]
- 12.Franceschini MA, Boas DA, Zourabian A, et al. Near-infrared spiroximetry: noninvasive measurements of venous saturation in piglets and human subjects. J Appl Physiol. 2002;92:372–384. doi: 10.1152/jappl.2002.92.1.372. [DOI] [PMC free article] [PubMed] [Google Scholar]
- 13.Leung TS, Tisdall MM, Tachtsidis I, et al. Cerebral tissue oxygen saturation calculated using low frequency haemoglobin oscillations measured by near infrared spectroscopy in adult ventilated patients. Adv Exp Med Biol. 2008;614:235–244. doi: 10.1007/978-0-387-74911-2_27. [DOI] [PubMed] [Google Scholar]
- 14.Wolf M, Duc G, Keel M, et al. Continuous noninvasive measurement of cerebral arterial and venous oxygen saturation at the bedside in mechanically ventilated neonates. Cri Care Med. 1997;25:1579–1582. doi: 10.1097/00003246-199709000-00028. [DOI] [PubMed] [Google Scholar]
- 15.Klabunde E. Cardiovascular physiology concepts. 2. Baltimore, MD: Lippincott Williams & Wilkins; 2011. [Google Scholar]
- 16.Duncan A, Meek JH, Clemence M, et al. Measurement of cranial optical path length as a function of age using phase resolved near infrared spectroscopy. Pediatr Res. 1996;39:889–894. doi: 10.1203/00006450-199605000-00025. [DOI] [PubMed] [Google Scholar]
- 17.R Development Core Team. R: A Language and Environment for Statistical Computing. Vienna, Austria: R Foundation for Statistical Computing; 2011. [Google Scholar]
- 18.Lin LI. A concordance correlation coefficient to evaluate reproducibility. Biometrics. 1989;45:255–268. [PubMed] [Google Scholar]
- 19.Bland JM, Altman DG. Statistical methods for assessing agreement between two methods of clinical measurement. Lancet. 1986;1:307. [PubMed] [Google Scholar]
- 20.Barratt-Boyes BG, Wood EH. The oxygen saturation of blood in the venae cavae, right-heart chambers, and pulmonary vessels of healthy subjects. J Lab Clin Med. 1957;50:93–106. [PubMed] [Google Scholar]