

Abstract
No concrete, causal, mechanistic theory is available to explain how different hepatic zonation patterns of P450 isozyme levels and hepatotoxicity emerge following dosing with different compounds. We used the synthetic method of modeling and simulation to discover, explore, and experimentally challenge concrete mechanisms that show how and why biomimetic zonation patterns can emerge and change within agent-based analogues, expecting that those mechanisms may have counterparts in rats. Mobile objects map to compounds. One analogue represents a cross-section through a lobule. It is comprised of 460 identical, quasi-autonomous functional units called sinusoidal segments (SSs). SSs detect and respond to compound-generated response signals and the local level of an endogenous gradient. Each SS adapts by using those signals to adjust (or not) the probability that it will clear a detected compound during the next simulation cycle. The adjustment decision is based on the value of a biomimetic algorithm that is based on an assumed, evolution imposed, genetic mandate that normal hepatocytes resist increasing the cost of their actions. The algorithm estimates the long-term, discounted cost to a given SS of continuing to use its current clearance effort. Upon compound exposure, lobular analogues developed a variety of clearance and hepatotoxicity patterns that were strikingly similar to those reported in the literature. A degree of quantitative validation was achieved against data on hepatic zonation of CYP1A2 mRNA expression caused by three different doses of TCDD (2,3,7,8-tetracholorodibenzo-p-dioxone).
Keywords: Hepatic zonation, Hepatotoxicity, Computational biology, Modeling, Simulation
1. Introduction
Hepatic zonation is a conspicuous periportal (afferent) to perivenous (efferent) gradient of an attribute within lobules. Zonal differences occur in the clearance of a variety of endogenous compounds and xenobiotics (Gebhardt, 1992; Jungermann, 1995). Zonation is also evident for a number of normal hepatic functions, absent xenobiotic or toxin exposure. There is also differential sensitivity to the induction of cytochrome P450 isozymes (Oinonen and Lindros, 1998). Toxin caused hepatic injury can also exhibit zonal patterns. Such phenomena are most often ascribed to having a multifactorial basis, in which oxygen gradients, other blood-borne signals, and blood flow itself may play prominent roles (Camp and Capitano, 2007; Christoffels et al., 1999; Jungermann and Kietzmann, 2000; Lindros, 1997). Recent evidence supports the hypothesis that components of the Wnt-β-catenin pathway may play an important role (Benhamouche et al., 2006; Hailfinger, et al., 2006; Sekine et al., 2006; Burke et al., 2009). Braeuning (2009) reviews the role of several pathways including Ras–Raf–MAPK (mitogen-activated, protein kinase) and Wnt-β-catenin. However, no concrete, causal, mechanistic theory has yet been offered for how different types of hepatic zonation phenomena emerge following dosing with different compounds. For this study, we focused on zonation patterns of P450 isozymes and the hepatic damage that can develop following treatment of rats with xenobiotics. We used the synthetic method of modeling and simulation (Hunt et al., 2009) to discover, explore, and experimentally challenge concrete mechanisms that show how and why biomimetic zonation patterns can emerge and change within an agent-based analogue of a hepatic lobule in response to compound dosing. The in silico mechanism may have counterparts in rats.
Christoffels et al. (1999) demonstrated the plausibility of a molecular level mechanism for periportal-to-perivenous gradients of gene expression. Expanding upon the zonation ideas offered in (Gebhardt, 1992), they hypothesized that interaction between two or more, different signal gradients is necessary to enable development of periportal-to-perivenous gene expression patterns that mimic those gradients and are stable under different conditions. They provided support for the hypothesis using both an inductive, mathematical model and a transgenic mouse model into which hepatocyte-specific DNA-response units had been integrated. They stated that, “if a hypothesis like the one presented … is to be tested, we need simple and strictly defined model systems.” They discuss the formidable issues of constructing such model systems using transgenic mice.
Ohno et al. (2008) constructed sophisticated, single-hepatocyte based lobular models that focus on ammonia metabolism with the long-range objective of elucidating how molecular and cellular level properties modify higher-level phenomena. Xenobiotic metabolism and enzyme induction mechanisms were not a focus. They posit that heterogeneous gene expression evolved to optimize energy efficiency. They specify histological structure and zone-specific gene expression of major enzymes, and include the biochemical kinetics of enzymes and transporters. Ierapetritou et al. (2009) recently reviewed the models of Ohno et al. along with a variety of additional computational liver models. Several specified features of zonation but not how those features may emerge. All but one of the models reviewed was an inductive mathematical model. The computational modeling and simulation (M&S) approach used herein (Fig. 1a) and the resulting models are fundamentally different from those inductive mathematical models and so are not directly comparable. Hunt et al. (2009) explain those differences and how the two different M&S approaches complement each other. The approach used herein was developed specifically to enable construction of biomimetic mechanisms that are real (not conceptual) and strictly defined. They are designed for use under conditions that are less supportive of inductive modeling methods (Fig. 1b). Even though abstract, the mechanisms and their spatial context are flexible and sufficiently concrete to instantiate mechanistic hypotheses and test their plausibility experimentally.
Fig. 1.

Features of the synthetic method of modeling and simulation. (a) Shown are relationships between observations made on rat liver lobules following xenobiotic treatments and the in silico, zonally responsive lobular analogues (ZoRLA) in Fig. 2 following simulated treatments with xenobiotics. Left: the referent systems are experimental observations made on rat livers following various treatments with xenobiotics. During experiments, lobular components interact with administered xenobiotics causing the compound to be cleared (metabolized or excreted in bile). The compound may also generate tissue responses, both intra- and extrahepatic. The consequences of localized mechanistic events cause systemic effects. Systemic behaviors at all levels are reflected in the recorded data. Right: abstract, software components are designed, coded, verified, assembled, and connected. The product of the process is a ZoRLA (as in Fig. 2) within an extrahepatic space. Concretizable mappings (1) exist between components and how they plug together, and lobular physiological and functional detail at the level of a sinusoid, as illustrated in Fig. 2. Execution gives rise to a working analogue; measures of events provide results. Dynamics during execution (mappings 2) are intended to represent abstractly plausible corresponding dynamics (believed to occur) within the rat during an experiment. Measures of dynamics – patterns of zonation, in this case – provide data that may or may not mimic wet-lab counterparts. Achieving measurable similarities makes mappings 3 quantitative. (b) Conditions supportive of both the synthetic method of M&S along with the familiar inductive method of M&S are sketched. Obviously, toxicologists and pharmacologists would like explanatory knowledge about hepatic phenomena and zonation to be rich and detailed, and for uncertainties to be limited. Such conditions (toward the far right side), which are common for non-biological, engineered systems, favor developing inductive models that are increasingly precise and predictive. However, as discussed in (Hunt et al., 2009), absent detailed knowledge of the causes of hepatic zonation, we are on the left side, where frequent abduction is needed and synthetic M&S methods can be most useful.
Following cycles of model construction, evaluation and selection, and refinement, we arrived at a hybrid discrete event, discrete time system that maps to a cross-section through a hepatic lobule having periportal-to-perivenous (P-to-P) flow and a connection to extrahepatic tissue. The hepatic lobule component is comprised of 460 identical, quasi-autonomous functional units called sinusoidal segments (SSs). Each SS maps to a small portion of a sinusoid (Fig. 2). During a simulation cycle, each SS contributes to establishment of an endogenous gradient signal, and it has an opportunity to clear a detected compound administered at the start of the simulation. There is a cost associated with each clearance event. There is also a cost associated with responding to the compound. We consider response signals generated in one of three ways. (1) A compound that exits the lobule enters an extrahepatic tissue space and causes release of a response signal, proportional to potency. (2) Compound causes response signal release within SSs. (3) Or, the compound itself functions as response signal. Herein we focus more on (1). Each simulation cycle, each SS adapts to clearance events and any changes in the two signal types by adjusting (or not) the probability that it will clear a detected compound during the next simulation cycle. That decision is based on an assumed, evolution imposed, genetic mandate to resist increasing the cost of its actions. It can try to reduce future costs in one of the two ways. If few or no response signals were detected, reduce compound clearance during the next simulation cycle. If response signals were detected, reduce the cost of their subsequent detection by increasing compound clearance during the next simulation cycle. Each SS makes use of a biomimetic algorithm to estimate long-term, discounted cost of continuing to use its current clearance effort. The outcome determines which action is selected.
Fig. 2.
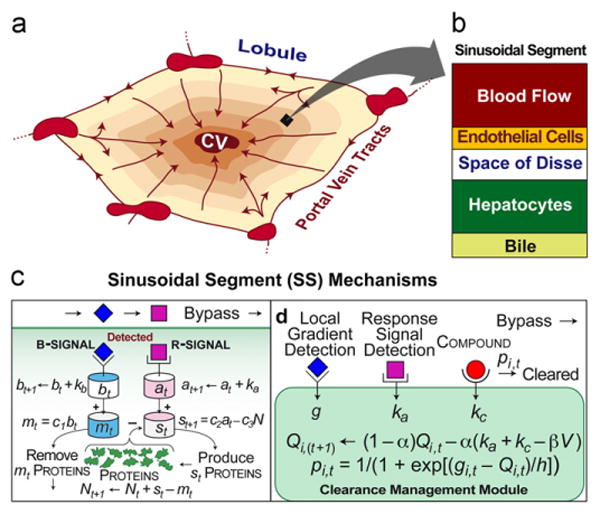
Referent and analogue features and mechanisms. (a) An illustration of a cross-section through a hepatic lobule showing sinusoidal flow paths from portal vein tracts to the central vein (CV) and a functional periportal-to-perivenous zonation pattern. (b) A ZoRLA is an arrangement of sinusoidal segments (SSs). An SS is a quasi-autonomous agent. As illustrated here, it maps to small portion of a lobule that includes portions of the sinusoidal blood flow and space of Disse, along with one or more endothelial cells and hepatocytes. (c) Illustrated is a simple mechanism to create functional zonation across the 20-SS preZoRLA1. Each SS uses a copy of the illustrated mechanism. Mobile objects (r-signal, b-signal, and xenobiotic if present) move from left (periportal) to right (perivenous). Each simulation cycle, each SS determines if each mobile object present will or will not exit. That process creates mobile object gradients. Subscript t indexes the value for the current simulation cycle. Subscript t+1 indexes the value for the next simulation cycle. When the b subsystem detects a b-signal, it increases bt and that causes the removal of mt proteins and possible elimination of the b-signal. Proteins map to the enzymes that metabolize compound. When the a subsystem detects an r-signal, it increases at causing the production of Nt proteins coupled with the illustrated negative feedback on the a subsystem and possible elimination of the r-signal. (d) An SS can detect and act on collocated mobile objects and signals. Three object/signal types are used: those that comprise the local gradient, response signals (generated by a compound's extrahepatic response), and a compound. The local value of the gradient is g. ka is the compound's potency. To reach the CV, a compound must pass through a sequence of SS and escape being cleared. If a compound is undetected, it exits (bypass). Upon detection, the compound is cleared with probability pi,t (simulation cycle t). If not cleared, it exits. The value of Q used by SSi during simulation cycle t is an estimate of its long-term, discounted cost of continuing to use its current clearance effort, pt, which is updated each simulation cycle using that location's g value along with Qi,t. Qi,(t+1) is the value to be used during the next simulation cycle. h, kc, α, β, and V are defined in the text and Table 2.
Upon compound exposure, the simulated lobule developed a variety of compound-specific gradients in P-to-P clearance effort. Several gradient patterns were strikingly similar to those reported in the literature for P450 isozymes following xenobiotic dosing (for convenience, examples are provided in Supplementary Fig. S5). Zonal patterns of clearance effort and SS damage changed depending on compound dose and potency. We called the system a zonally responsive lobular analogue (ZoRLA). A ZoRLA was used to achieve a degree of quantitative validation against data on hepatic zonation of CYP1A2 mRNA expression caused by three different doses of TCDD (2,3,7,8-tetracholorodibenzo-p-dioxone).
2. Methods
To distinguish clearly in silico components and processes from corresponding rat counterparts, we use SMALL CAPS when referring to the former. Parameter names are italicized.
2.1. The attributes targeted
The first consideration in any modeling effort is to determine why the models are being created, and identify situations in which they will be used (Zeigler et al., 2000). For this project, we sought spatially organized, biomimetic mechanisms that could produce phenomena similar to attributes listed in Box 1. Unlisted hepatic phenomena are, for the time being, outside the scope of this project. However, a requirement was that the models and their components be sufficiently flexible so that during a future extension of this project, or when other investigators use the models, they could be easily modified to account for an expanding list of attributes. Clear statements about use and targeted attributes facilitate selecting specifications. Specifications, paired with attributes, are provided in Box 1. Clear specifications guide model design and development and help one to avoid potentially unproductive tangents. Each attribute achieved provides a degree of validation.
Box 1. Targeted attributes and specifications.
Hepatic lobules are the referent. The model system is called a zonally responsive lobular analogue (ZoRLA). A: a targeted attribute and S: a ZoRLA specification. Attributes 1–10 are targeted for this report.
-
A: Lobules are comprised of cells, which are typically autonomous functional units.
S: Each ZoRLA is comprised of autonomous functional units called sinusoidal segments (SS) that map to a portion of a sinusoid containing one or more hepatocytes (Fig. 2).
-
A: Hepatocyte function is location dependent. Cells can respond based on local information.
S: A SS can do the same.
-
A: Upon interaction with hepatic cells, blood-borne material (such as O2), which function as signals, form periportal-to-perivenous (P-to-P) gradients. Those gradients provide information to hepatocytes about their relative location.
S: An SS should be capable of forming and responding to various trans-lobular signal gradients.
-
A: Upon administration via blood, compounds, alone or in combination, having different potencies and different affinities for hepatic functions, percolate through lobules exhibiting P-to-P movement.
S: Mobile objects carrying identification information map to small fractions of a xenobiotic dose. When a compound generates a response, there is a ZoRLA counterpart to potency. It must be easy to change compound dose, potency, movement, and affinity characteristics.
-
A: Hepatocytes clear xenobiotics from blood (metabolism and biliary elimination). A standard measure hepatic removal of a xenobiotic is intrinsic clearance (CLint), the clearance rate absent blood flow. It depends in part on the relative amounts of enzymes and transporters expressed by each hepatocyte. Location-dependent CLint can change following exposure to a xenobiotic.
S: The ZoRLA counterpart to CLint is clearance effort. Each SS can change its clearance effort upon exposure to compounds.
-
A: Hepatocytes often exhibit location-dependent expression of enzymes and transporters.
S: SSs can exhibit location-dependent clearance effort.
-
A: Zonation of xenobiotic metabolism occurs at both the cell and lobule level, implicating cell–cell cooperation at some level. It changes adaptively.
S: Individual SSs can improve efficiency by adapting their clearance effort to changing compound exposures and to actions of other SS.
-
A: Xenobiotic dosing, using a variety of experimental conditions, produces different P-to-P induction patterns for different members of the CYP family. Examples (provided for convenience in Supplementary Fig. S5) include:
Induction patterns of CYP1A1, -1A2 and -1B1 by TCDD (Tritscher et al., 1992; Walker et al., 1998; Birnbaum et al., 1999).
Induction of CYP2B1/2 by octamethylcyclotetrasiloxane (Sarangapani et al., 2002).
The CYP1A1 mRNA induction pattern caused by β-naphthoflavone is opposite to that caused by 3-methylcholanthrene (Oinonen et al., 1994).
Effects of hypophysectomy, growth hormone, and tri-iodothyronine on the lobular mRNA distribution of various CYP forms (Oinonen and Lindros, 1998) (not yet achieved).
Perivenous induction of CYP2A1, -2B1, -2C11, -2E1 and -3A1 by acetone, ethanol, or phenobarbital (Buhler et al., 1992).
Periportal induction of CYPEtOH2 by ethanol or phenobarbital (Buhler et al., 1992).
Dose-dependent zonation of enzyme induction: perivenous induction with low-dose, and periportal induction with high-dose phenobarbital treatment (Buhler et al., 1992) (not yet achieved).
S: A ZoRLA should be capable of producing patterns of clearance effort that mimic those observed in vivo over variety of experimental conditions. A degree of validation is achieved by using a simple transformation to achieve quantitative similarity.
-
A: Most histological zonation data is in the form of stained, 2D sections through liver samples that also provide evidence of unique sinusoidal flow paths.
S: ZoRLAs consist of 2D SS arrangements that enable mobile objects to follow multiple, different P-to-P paths.
-
A: Compound dosing can cause dose-dependent zonal patterns of cell damage. Examples (provided for convenience in Supplementary Fig. S5) include
Cell necrosis patterns by anterograde infusion of CBrCl3 (Masuda and Yamamori, 1991).
Perivenous damage by CCl4 and bromobenzene (Pink, 2001).
-
Periportal damage by digitonin (Pink, 2001).
S: A ZoRLA can produce dose-dependent damage patterns that mimic those above.
-
A: When retrograde infusion is used, different clearance/damage patterns emerge (see (Masuda and Yamamori, 1991) for a CBrCl3 example).
S: ZoRLA produce similar patterns when movement of mobile objects is reversed.
-
A: Histological micrographs show zonation patterns extending over several adjacent lobules.
S: 2D multi-lobular ZoRLA arrangements that mimic such cross-sections produce similar patterns of clearance effort.
-
A: Cell response depends in part on the physicochemical properties of compounds.
S: A ZoRLA is able to use physicochemical property information of a compound to which a mobile object maps in place of a potency value to produce zonation patterns that cross-validate.
-
A: Several liver factions exhibit zonation concurrently (e.g. protein synthesis, fatty acid degradation, xenobiotic metabolism, etc.).
S: ZoRLA zonation mechanisms are scalable to produce concurrent zonation of various functions.
To achieve targeted attributes, we followed an iterative construction and refinement protocol similar to that detailed most recently in (Hunt et al., 2009) and (Lam and Hunt, 2009). The objective was to discover CELL level mechanisms that would make patterns of clearance effort (defined below) following compound dosing, increasingly biomimetic, with the long-term goal of achieving ZoRLAs that exhibit all Box 1 attributes, and do so while adhering to a strong parsimony guideline. For this project, we focused on the first ten attributes. For each attribute targeted, we provided a ZoRLA specification that would be commensurate with the other specifications in enabling eventual achievement of all Box 1 attributes. The iterative refinement protocol cycles through the following eight steps:
Choose an initial, small subset of attributes to target, e.g., 1–3 in Box 1.
Select a granularity level that will enable comparing measures of simulated and targeted attributes. We selected the level illustrated in Figs. 2 and 3.
For each attribute targeted, specify a desired level of phenomenal similarity (e.g., within ±25% or exhibit the same P-to-P gradient trend). Approach in stages: begins with relaxed similarity measures.
Posit coarse-grained, discrete mechanisms that may generate analogous phenomena while requiring as few components as is reasonable.
Create logic to be used by each component. Instantiate components and mechanisms. Update specifications.
Conduct many, simulation experiments. Measure a variety of phenomena to establish in silico to wet-lab similarity and lack thereof.
Tune (parameterize) to achieve analogue similarity specified at step 3. When the effort fails, return to step 4. When successful, return to step 3 and increase the stringency of the similarity measure.
Add one or more new attributes until the current analogue is falsified. Return to step 2. Strive to achieve the expanded attribute list with as little component reengineering as possible.
Fig. 3.
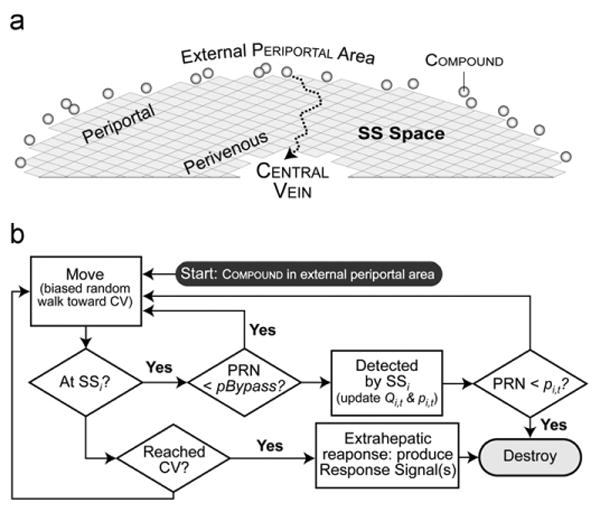
Events occurring within simulation cycle t. (a) Illustrated is a portion of a ZoRLA; SS agents (gray squares) are arranged into the illustrated 2D semi-circular grid pattern. The external periportal area maps to portal vein tracts. At the start of each simulation cycle, the compound dose is placed outside. Each compound enters at a randomly assigned SS on the outside edge. During each simulation cycle, compound move towards the CENTRAL VEIN (CV: the central, vacant region; it maps to both central vein and extrahepatic tissues) using the biased random walk described in Methods. The dotted arrow is an example of a compound'S path. When a compound (ka>0) reaches the CENTRAL VEIN it is removed, a response occurs, and r-signals are generated in proportion to ka. (b) The flowchart shows event logic from a compound'S perspective. During simulation cycle t, the clearance management module detects a collocated compound with probability=1–pBypass. Upon detection, it is cleared (removed) with probability pi,t. At the end of each simulation cycle, each SSi updates its Qi,t (to Qi,(t+1)) and clearance strategy – clearance effort – (pi,t) based on the number of compound cleared and the number of r-signals received. PRN: pseudo random number in [0,1].
2.2. The synthetic method of modeling and simulation
The method used herein is a relatively new experimental approach to discover and challenge plausible, biomimetic mechanisms. It acts on the dictum of the great physicist Richard Feynman “what I cannot create, I do not understand.” To gain insight into plausible generative mechanisms that may be responsible for biological phenomena of interest, such as hepatic zonation patterns, when uncertainty is large and detailed data are limited, the method involves building extant – real, actually existing, and observable – working mechanisms that exhibit some of those same phenomena, and thus may be biomimetic. The approach is based on the scientific principle (Darden, 2002) illustrated in Fig. 1a. When two systems, hepatic lobules of laboratory rats and a model – a ZoRLA – are composed of interacting components for which similarities can be established at some level of abstraction (mappings 1 in Fig. 1a), and the two systems exhibit several measurable, phenotypic attributes (mappings 3), for which some degree of similarity exists, then there may also be similarities in the generative mechanisms responsible for those attributes (mappings 2). We cannot yet build hierarchical mechanisms out of biochemicals. However, as described herein and recently reviewed (An et al., 2009; Fisher and Henzinger, 2007; Grimm et al., 2005; Hunt et al., 2009), we can build extant biomimetic mechanisms using object-oriented software tools. In doing so, as Fig. 1 illustrates, we are not following the traditional, inductive approach of modeling the data. Nor are we describing mathematically the behaviors of a hypothetical, conceptual mechanism. Rather, we explore the space of relatively simple, plausible, biomimetic, mechanisms, for concrete instances, which upon instantiation, verification, and simulation exhibit phenomena, which when measured produce data that are essentially indistinguishable from comparable wet-lab data. Because the MECHANISMS are intended to be analogous to biological mechanisms, we refer to the in silico system as an analogue. To emphasize their concrete, constructive nature (a whole assembled from stand alone parts), we call them synthetic analogues. The approach provides an important, scientific and experimental means to explore and test in silico plausible, biomimetic mechanistic hypotheses, when it would be too difficult, too expensive, infeasible, or unethical to do so in animals or in vitro.
2.3. ZoRLA design considerations
In related work, we built in silico liver analogues to challenge mechanistic hypotheses and gain improved insight into plausible micromechanistic details of xenobiotic clearance (Hunt et al., 2006; Yan et al., 2008a,b), hepatic drug interactions (Lam and Hunt, 2009), diseased-caused differences in spatiotemporal micro-mechanisms influencing hepatic drug disposition (Park et al., 2009), and heterogeneities in intralobular enzyme induction (Ropella et al., 2008). At the start of this project, we drew on these methods and their validated components to instantiate and experiment on lobular analogues targeting subsets of attributes 1–10 in Box 1.
All ZoRLA system components and processes are discrete. Time advances discretely by simulation cycles and steps within cycles. Each simulation cycle, every component updates its state based on changes since the last update opportunity. Each SS is a software agent. An agent is a quasi-autonomous software object that can schedule its own events. SSs can be connected together in different ways. Within a simulation cycle, SS components interact with mobile compound percolating through a sequence of SS. The process maps to absorbed xenobiotics percolating through sinusoids and interacting (or not) with spaces and cells as described in (Park et al., 2009; Yan et al., 2008a). Most events are stochastic. During a simulation cycle, when an event opportunity for a given component occurs, there is a parameter-specified probability for each, prespecified outcome.
A specific ZoRLA instantiates a mechanistic hypothesis (Fisher and Henzinger, 2007; Hunt et al., 2009): these component arrangements and operating principles will, upon execution, produce phenomena similar to targeted attributes. Execution followed by comparison of results to referent data tests the hypothesis. The process is directly analogous to constructing and then experimenting on a wet-lab model to test hypotheses. We adhered to a parsimony guideline and strove to keep ZoRLA components as simple as feasible, while achieving the attributes in Box 1.
Inductive models are typically grounded to metric spaces. ZoRLAs use relational grounding. Grounding is defined as the units, dimensions, and/or objects to which a variable or model constituent refers. Each ZoRLA component is grounded to a subset of the other components. The merits and limitations of relational grounding are discussed in (Hunt et al., 2009). Using relational grounding means that a separate mapping (transformation of data) model is needed to quantitatively relate measures of ZoRLA phenomena, such as clearance effort, to corresponding wet-lab phenomena, such as a measure of P450 isozyme levels within a tissue sample or isolated cells.
2.4. SS intrinsic clearance
The primary phenomena in Box 1 are intralobular changes in compound clearance and the intracellular levels of P450 isozymes (or their mRNA) responsible for compound clearance. We needed an SS counterpart to intrinsic clearance. We can see from Fig. 2b that some of the compounds entering an SS can exit without entering hepatocytes. A compound that is detected by an SS maps to compound entering hepatocytes. A compound that is undetected exits that SS; we say it bypassed that SS. We specified a bypass probability (pBypass) for each SS that could be adjusted for each compound; with one exception, for the ZoRLA experiments described herein, we arbitrarily set pBypass=0.8. A compound maps to a small fraction of the xenobiotic dose used in one of the experiments cited in Box 1. We specified that if detected, the compound would be cleared with probability p; that maps to the intrinsic clearance by hepatocytes within a sinusoidal segment for the time interval to which a simulation cycle maps. We define pi,t to be the clearance effort of SSi during simulation cycle t. Within hepatocytes, an increase in intrinsic clearance typically correlates with an increase in P450 isozymes. For this report, we limit attention to those cases. That increase comes at a cost to the cell. In SSs that use the mechanism in Fig. 2d, the cost of a compound clearance event is kc. Given the many functions carried out by hepatocytes, we assumed that hepatocytes have an evolution imposed, genetic mandate to avoid unnecessary costs.
2.5. Signals and methods needed and used by SS
Gebhardt argued that two classes of signals are necessary and essential for creating zonation (Gebhardt, 1992). An early task was to discover and demonstrate a discretized mechanism that would enable an SS to adjust its clearance effort based on local levels of two signals. Further, within a ZoRLA, when needed, these signals could correspond to amounts of two different mobile objects, RESPONSE (R-) and b-signals. We specified that r-signals be connected to compound, dose, and potency. We identified three options: (1) a compound or its metabolite is the r-signal; (2) a compound or its metabolite initiates a response within an SS and that response (or an object generated by that response) functions as a r-signal that is also detectable subsequently by other SS; and (3) a compound or its metabolite that escapes HEPATIC clearance initiates an extrahepatic response, and that response (or an object generated by that response) is an r-signal that is SS detectable. We could achieve our objective if any of the three options worked. Early exploratory simulations indicated that the third option would be the simplest to implement. Consequently, we focused on that option. Option three may map to a xenobiotic that causes extrahepatic tissue toxicity. Our attention is on interactions between a tissue and an active xenobiotic (or its active metabolite) that cause observable toxic or pharmacological responses. We conjectured that some of those interactions would cause the release of factors that are carried by blood to the liver where they function similar to alarm signals (Matzinger, 2002). Such factors could be detected by hepatocyte Toll-like (Liu et al., 2000) or other receptors. The algorithm in Fig. 2d can be modified to give the same clearance effort change for the second option, as well. In the early SS in preZoRLA1, discussed below, mobile objects served as r-signals. In the final, 2D ZoRLA, also discussed below, we specified that each SS receives a specified r-signal at the end of each simulation cycle. We made that change to reduce the duration of each simulation cycle and thus simplify ZoRLA function.
For simplicity, we specified that b-signals, which are unrelated to xenobiotic, map to something external to the liver and that they are carried to the liver by blood. It could, for example, map to O2 levels. Again, for simplicity, we specified that its hepatic input rate be constant. We gave each SS the ability to respond to b-signal objects exactly as they respond to a compound. There was a bypass probability and a non-zero probability of being cleared when detected. For a single sequence of SS, the detected level of b-signals would provide information about relative location in the sequence. In preZoRLA1, mobile objects, entering the ZoRLA on the periportal side and flowing in the P-to-P direction, functioned as b-signals. In the final, 2D ZoRLA, we specified that a fixed P-to-P b-signal gradient exists so that the b-signal for each SSi is constant for the duration of the simulation experiment. We made that change to reduce the duration of each simulation cycle and thus simplify ZoRLA function. We used an equation (defined below) to specify the value, gi, for each SSi.
2.6. The linear preZoRLA systems
Before constructing the 2D ZoRLA, we explored a simple linear SS arrangement in which one of two types of SS mechanism was used. We called them preZoRLA1 and preZoRLA2. A preZoRLA was composed of n=20 spatially fixed SS embedded within an extrahepatic space. The arrangement maps abstractly to a single sinusoid track. PreZoRLA1 uses the mechanism in Fig. 2c; its parameters are listed in Table 1. PreZoRLA2 used the mechanism in Fig. 2d; its parameters are listed in Table 2. There are three mobile objects: b-signals, xenobiotics, and r-signals. A source container for each object type was located just prior to SS1. The special case where xenobiotics also function as the r-signals was allowed. Total signals were specified by aDose and bDose.
Table 1.
Parameters of preZoRLA1.
| Symbol | Description | Range | Used |
|---|---|---|---|
| N | Amount of protein generated | [0, ∞) | 0–500a |
| pbBypass | Probability that a b-signal bypasses an SS undetected | [0,1] | 0.1 |
| paBypass | Probability that an r-signal bypasses an SS undetected | [0,1] | 0.1 |
| pbRemove | Probability that a b-signal is removed following detection | [0,1] | 0.03–0.1 |
| paRemove | Probability that an r-signal is removed following detection | [0,1] | 0.01–0.15 |
| bt | The value of b-subsystem at simulation cycle t: has an effect on down-regulation of proteins | [0, ∞) | 0–6000a |
| at | The value of a-subsystem at simulation cycle t: has an effect on up-regulation of proteins | [0, ∞) | 0–6000a |
| mt | proteins degraded during cycle t | [0, ∞) | 0–6000a |
| st | proteins expressed during cycle t | [0, ∞) | 0–5000a |
| kb | Increment of b following detection of a b-signal | [0, ∞) | 1–2 |
| ka | Increment of a following detection of an r-signal | [0, ∞) | 1–2 |
| c1 | Proportionality constant which relates b to m | [0, ∞) | 1–30 |
| c2 | Constant that regulates positive influence of a on s (Fig. 2c) | [0, ∞) | 1–10 |
| c3 | Constant that regulates negative influence of N on s (Fig. 2c) | [0, ∞) | 0.5–1 |
Simulation result.
Table 2.
Parameters of ZoRLA and preZoRLA2.
| Symbol | Description | Range | Used |
|---|---|---|---|
| pi,t | Clearance effort of SSi during simulation cycle t: the probability that SSi clears a detected compound | [0,1] | 0–1a |
| Qi,t | Estimate of SSi's long-term, discounted cost as of events during simulation cycle t | (−∞,∞) | 0–3500 ZoRLAa |
| 0–1.2 preZoRLA2a | |||
| gi | The value of the P-to-P b-signal gradient used by SSi | [0, ∞) | 0–200 ZoRLA |
| 0–1 preZoRLA2 | |||
| pBypass | Probability that a toxin bypasses an SS without being detected | [0,1] | 0.6–0.99 ZoRLA |
| 0.9 preZoRLA2 | |||
| h | A constant that adjusts the randomness of decisions | [0, ∞) | −70 ZoRLA |
| 0.1 preZoRLA2 | |||
| α | Learning rate: determines the weight of newly observed costs in calculation of Q | [0,1] | 0.1 |
| β | Discount factor: determines the current importance of future costs | [0,1] | 0.5 ZoRLA |
| 0 preZoRLA2 | |||
| ka | Cost of detecting one r-signal | [0, ∞) | 0–150 ZoRLA |
| 0–20 preZoRLA2 | |||
| kc | Cost of clearing one compound | [0, ∞) | 1 |
| Additional parameters for ZoRLA, only | |||
| (Xi,Yi) | Coordinates of SSi with respect to the center of the grid space | ℜ2 | (4,4) – (28,28) |
| η | Uniform random noise (Eq. (3)) | [0, grid radius] | [0, 15.5] |
Simulation result.
Typically, there was no zonation at the start of a simulation. To create measurable, clearance-related zonation, something within each SS needed to map to metabolic enzymes. To meet that need in preZoRLA1, we used the protein objects illustrated in Fig. 2c. Proteins can map to any measurable, xenobiotic-inducible gene product including xenobiotic metabolizing enzymes. The number (N) of proteins available during a simulation cycle or a measure of their use could establish if zonation had or had not occurred. Each SS also needed a gradient of detectable mobile objects to provide relative location information; SSs working independently should be able to create whatever mobile object gradients are needed. The SS mechanism in Fig. 2c used two subsystems to create (or activate) and remove (or deactivate) proteins.
Signals were metered into SS1 at a constant rate from the signal source container, typically one of each type each simulation cycle. Both object types could bypass a SS without being detected; the bypass probabilities were pbBypass and paBypass, for b- and r-signals, respectively. Signal detection, as illustrated in Fig. 2c, triggered two events in sequence and the signal was then either removed (with probabilities pbRemove and paRemove) or released to enter the next SS.
In Fig. 2c, two subsystems regulate protein levels. It is too early to speculate on the subcellular networks to which they map. However, we identify candidates in the Introduction. The current subsystems are inductive models serving as placeholders for future sets of concrete interacting components having behaviors that will cross-validate with the current subsystems. A detected b-signal causes an event in the b-subsystem: variable b is increased by a constant value kb; bAVG is the average value of variable b over Navg simulation cycles ending with the last. For the results presented in Fig. 4, Navg=100. Subscript t indexes the value for the current simulation cycle. Subscript t+1 indexes the value for the next simulation cycle. The b event is followed immediately by another event in the m-subsystem that results in removal (or deactivation) of mt protein objects: mt is proportional to bt; c1 is the adjustable proportionality constant; larger c1 values increase the rate of protein removal.
Fig. 4.

Six preZoRLA1patterns of protein expression. The mechanism used (Fig. 2c) is capable of generating various expression patterns: perivenous expression (a, c, e), periportal expression (g,i), and mid-zonal expression (k) are shown after an infusion (one compound per simulation cycle) lasting 2000 simulation cycles. In panels b−l, parameter values that were different from those listed in a are provided. Average gradients of a-signal (aAVG, blue) and b-signal (bAVG, red) are shown on the right side for each expression pattern (b, d, f, h, j, l). Parameters are listed in Table 1. For interpretation of the references to colour in this figure legend, the reader is referred to the web version of this article.
A detected r-signal causes an event in the a-subsystem: variable a is increased by a constant value ka; aAVG is the average value over Navg simulation cycles ending with the last. The at event is followed immediately by creation (or activation) of st proteins: st is linearly related to at and Nt; c2 and c3 are tunable constants, which adjust the influence of aAVG and Navg on s. Larger c2 values increase protein production; c3 modulates negative feedback on protein production by already existing proteins, dampening the impact of a change in r-signals on protein levels. Independent of all preceding events, at and bt are reduced by one at the end of each simulation cycle. That reduction can map to normal turnover and/or the involvement of those pathways in other cell processes.
A xenobiotic that enters a SS can pass through (bypass) undetected with a probability pBypass. The probability of clearance following detection is pt. If the xenobiotic is not cleared, it will enter the next SS at the start of the next simulation cycle. If cleared, it is removed from the simulation. We specified that pt be a function of Nt and that it be positively correlated with Nt. When proteins are responsible for xenobiotic clearance, pt=1−(1−pRemove)Nt, and pRemove is the probability of a xenobiotic being removed by one protein.
2.7. Enabling SS to adapt their clearance effort in response to dosing with different compounds
Christoffels et al. (1999) and others have posited that zonation is linked to the adaptive ability of the liver and hepatocytes specifically. The SS that use the mechanism in Fig. 2c are very simple agents. Each SS has three actions: detect b-signals, detect r-signals, and clear compound. We conjectured that if a cost were associated to each action, then when given a simple learning algorithm, a SS could use it to resist increasing costs, and that would result in location dependent clearance efforts. Consequently, a mandate of each SS was to alter clearance effort to avoid rising costs. Because b-signals are independent of compound and, once the gradient stabilizes, they are constant for each SS, we elected to ignore them, unless we failed to achieve targeted attributes. We specified that the cost of clearing one compound is kc. We specified that the cost of detecting and responding to one r-signal is ka. We conjectured that if a xenobiotic disrupts normal tissue function or causes tissue damage, the consequences of such an event could cause hepatocytes to alter their behaviors, and so doing would come at a cost to the hepatocytes. The relationship is more clear when it is the hepatocyte itself that is disrupted or damaged. Increasing p increases costs. Costs are lowest when a SS chooses p=0. However, if the compound is a toxin, then with p=0, all compound would exit the lobule causing extrahepatic responses. Subsequent r-signal detection by all SS would increase costs. If there is a direct relation between toxin potency and the number of r-signals detected (or their value), then it is clear that P-to-P patterns of clearance effort would change as compound dose and potency are changed. We explored those changes. Based on recent observations about simulated hepatocyte learning (Sheikh-Bahaei et al., 2009), we anticipated that, given a simple learning mechanism (an algorithm in this case), a SS at the end of simulation cycle t−1 could find a new pt that would be expected to lower costs during subsequent simulation cycles.
The SS mechanism in Fig. 2d provides the preceding capabilities and is simple enough so that there may be one or more yet to be identified hepatocyte counterparts. The figure shows an SS with a quasi-autonomous subsystem, the clearance management module. It maps to all hepatocyte resources and subsystems associated with enzyme induction and xenobiotic clearance. The actions taken by the clearance management module are dictated by an inductive model (Eqs. (1) and (2)) of biological logic. It is serving as placeholder for future sets of concrete interacting components having behaviors that will cross-validate with identified characteristics of the algorithm. The clearance management module has one mandate: adjust pt up or down or keep it the same to lower future costs. A function in the form of a Boltzmann distribution is provided that adjusts pi,t.
| (1) |
Qi,t is based on the well-known Q-learning algorithm (Watkins and Dayan, 1992). The value of Q used by SSi during simulation cycle t is an estimate of its long-term, discounted cost of continuing to use its current clearance effort, pt. At the start of each simulation cycle, pt is calculated using the Qt value carried-forward from the previous (t−1) simulation cycle (Eq. (1)). At the end of the current simulation cycle, Qi,t is updated using Eq. (2). Qt+1 is then carried forward for use in the next simulation cycle. h is a constant; it acts as a gain: it amplifies and/or dampens the difference: g−Q. A large value of h eliminates zonation completely; a small value magnifies it. When h is very large, pi,t is constant at 0.5. When h is very small, pi,t essentially takes one of two location dependent values.
| (2) |
where V=min(Qi,t, gi) (see Supplementary Material for derivation details and simulation examples). β is known in the Q-learning literature as the discount factor; it determines the current importance of future costs. For the SS in Fig. 2, as β→0, the difference between periportal and perivenous pi,t values increases. ka=potency. α is a constant in [0,1] that controls the clearance management module's learning rate. For the results presented, β=05, kc=1, α=0.1, and h=0.01, 5, 10, or 70, depending on the experiment. As specified above, gi is the value of the P-to-P b-signal gradient used by SSi. We used a simple equation,
| (3) |
where Xi and Yi are coordinates of agent SSi with respect to the center of the grid space, and η the uniform random noise in the interval [0,m/2]; we used m=31; that is the number of spaces per grid edge.
At the end of each simulation cycle, there are two types of SS: those that (1) did and (2) did not detect a compound. In the first case, the SS performed an action: it either ignored or cleared the compound. Only SSs of the first type update their Q value. If a SS detected one compound during the simulation cycle, it updated Q once. If it detected n compounds during the simulation cycle, it updated Q n times.
When a SS detects a compound, it is either cleared or not. When a compound has been cleared, kc=1, else kc=0. When an r-signal is detected, ka (a measure of potency) takes a value > 0, else ka=0. The latter still applies in the special case where the compound is the r-signal. The term (ka+kc) represents the per-compound cost to each SS for the actions taken during simulation cycle t.
2.8. SS arrangement and compound movement
A lobule is a system of SSs arranged to mimic a cross-section through a hepatic lobule. The 2D square grid shown in Fig. 3a maps to a 2D view of a cross section through a hepatic lobule. The parameters of the 2D ZoRLA are listed in Table 2. Located at each grid space is an SS agent. Compounds enter from the external periportal area, which maps to portal vein tracts. If not cleared, compounds move in discrete steps, from the exit of one SS to the entrance of an adjacent SS. Event logic from the compound's perspective is diagrammed in Fig. 3b. Compounds move stochastically toward the central ZoRLA space, which maps to a lobule's central vein. The process mimics blood flow through sinusoids. Sinusoid interconnections enable some lateral periportal flow. There is no lateral flow in perivenous sinusoids. We implemented and verified a movement algorithm to enable compounds to follow a biomimetic one-grid-space-at-a-time path toward the central vein. Each simulation cycle, the algorithm below specifies a move direction θ for each compound. The compound then uses θ to select, move to, and then enter an adjacent SS. All neighboring grid locations were numbered counter clock wise, starting with 1 at 0° and ending with 9 at 360° (see Supplementary Fig. S1A). We used a Normally distributed random variable (x) for which the mean (μ∈[1,9]) corresponds to the effective flow direction, θ. For example, μ=4 corresponds to θ=135° and μ=1.5 to θ=22.5°. More formally, x∼N(⌊θ/45⌋+1, σ2), where 0° ≤ θ < 360° is the effective angle of movement (illustrated in Supplementary Fig. S1A) and σ is the standard deviation of x; σ controls each compound's lateral movement.
A compound moves stochastically to an adjacent SS in an adjacent space at the start of a simulation cycle. The adjacent space, nextSpace, is stochastically chosen as: nextSpace=⌊x 0.5⌋(modulo 8)+1. Distributions are shown in Supplementary Fig. S1 for θ=135° and three values of σ. The motion converges to Brownian motion for large values of σ (because the x distribution becomes effectively uniform). We used three σ values: σ1, σ2, and σ3, for periportal, middle and perivenous zones, respectively. Because the sinusoid interconnections and therefore the lateral movement is greater periportal, we arbitrarily set σ1=1.2, σ2=1.0, and σ3=0.7 (illustrated in Supplementary Fig. S1).
As a simulation progresses, we can observe how the P-to-P pt patterns change and when they stabilize. The hypothesis being tested is that upon sustained compound dosing, use of the mechanism in Fig. 2d can produce stable pt values that exhibit P-to-P patterns. We cannot rule out that some patterns may have no observed biological counterpart. Our interest herein is in patterns that are biomimetic.
2.9. Initial conditions
Given any pre-existing pattern of clearance effort (pt,i) and a specific Eq. (2) parameterization, the same new pattern will eventually emerge upon sustained exposure to a new compound. However, the number of simulation cycles required can vary considerably depending on the pre-existing pattern. For simplicity, Qi values were initialized at the start of all simulations such that Eq. 1 produced random values of clearance effort, as follows. Qi=gi+h ln(1/PRN-1), where h is an adjustable parameter (the same as h in Eq. (1)), gi is calculated using Eq. (3) and prn is a pseudo-random number between 0 and 1. Thereafter, each SS used Eq. (2) to calculate Qi,t+1, which was then used in Eq. (1) to calculate pi,t+1.
3. Results
3.1. Results from preZoRLA1
Each SS in preZoRLA1 used the mechanism in Fig. 2c to form and respond to gradients of r- and b-signals (targeted attribute 3). The mechanism also produced and removed proteins. Clearance effort (p) for each SS was proportional to its current number of proteins. The mechanism was capable of forming a variety of P-to-P b-signal and clearance effort gradient patterns that were both dose and potency dependent. Examples are presented in Fig. 4. Various parameterizations (Table 1) enabled achieving targeted attributes 1–6. However, inclusion of attribute 7 in the set of currently targeted attributes falsified preZoRLA1.
One measure of zonation is the number of proteins. We explored large regions of preZoRLA1 parameter space and the patterns produced. Six examples are shown in Fig. 4. The first three (Fig. 4a–f) are biomimetic in that the increasing P-to-P level of protein is similar to zonation patterns frequently reported for P450 isozymes. Note that bavg values decline approximately linearly from SS1 to SS20. Detection and removal of b-signals leads to the equilibrium values of bavg; detection and removal of r-signals leads to the equilibrium values of aavg. By changing values of c1–c3, paRemove, and pbRemove the mechanism creates a wide variety of protein patterns.
Three types of patterns were observed: (1) perivenous expression (Fig. 4a–f); (2) periportal expression (Fig. 4g–j); and (3) mid-zone expression (Fig. 4k–l). To obtain the first pattern, we specified paRemove<pbRemove. Doing so caused a steeper gradient of b-signal (bAVG) than that of r-signal (aAVG). Consequently, it created a larger perivenous protein expression rate relative to periportal expression (Fig. 4b, d, and f). The extent of expression can be controlled by parameter c2. Fig. 4a and e shows the results for small and large c2 values. Fig. 4a and c shows the consequences of different c1 values.
The second pattern was achieved by specifying paRemove> pbRemove. In that case the aAVG gradient was steeper than that of bAVG (Fig. 4h and j), and as a result, the rate of protein expression was larger periportal. The extent of expression was again controlled by parameters c1 and c2. Fig. 4g and i shows the results for c2=10 and c2=20, respectively.
The third behavior was not easily attained. One example is shown in Fig. 4k, for which paRemove<pbRemove; additionally, pRemove was greater than zero but very small. Doing so made r-signal>b-signal in the mid-zonal region; but r-signal<b-signal in the other two regions. Unlike the above two patterns, aAVG and bAVG values were unstable and kept increasing as long as the simulation was running (Fig. 4l). Such instability is abiotic. We took that instability as evidence that preZoRLA1 should be falsified. We posited that a somewhat more complicated mechanism would be needed to achieve patterns like those in Fig. 4a–k, while avoiding instability. Switching to the somewhat more complicated Q learning mechanisms in Fig. 2d enabled preZoRLA2 to avoid pattern instabilities while also being adaptive.
3.2. Results from preZoRLA2
For preZoRLA2, the administered compound was a toxin. This system was also comprised of a linear sequence of 20 SS that used the mechanism illustrated in Fig. 2d. It too was capable of forming a variety of P-to-P b-signal and clearance effort gradient patterns that were both dose and potency dependent, plus it achieved attribute 7. The patterns produced were always stable. Parameter values used are listed in Table 2. The five example results in Fig. 5 used the same parameterization, but the three toxins had different potencies (ka values). The duration of repetitive exposure to the same toxin dose was long enough to achieve pattern stability. Values of repeat experiments were not identical, but the patterns were identical. Prior to toxin dosing, each SS's Q value was initialized to zero. We used two measures of zonation. One was the value of pAVG (it maps to intrinsic clearance), which is the probability that a SS cleared a toxin if it was detected, averaged over the past Navg=500 simulation cycles. The second was toxin elimination count; it was the number of toxins cleared by a SS. We can reasonably infer that hepatocyte exposure is directly correlated with total amount of compound cleared by that hepatocyte. Given that, we specified that the number of toxins cleared by a preZoRLA2 was directly correlated with hepatotoxicity. Toxins that were not cleared still caused extrahepatic responses. We also specified that SS damage would ensue when a SS lost the ability to detect (and clear) toxins, an event that was set to occur when the number of cleared toxins passed an arbitrary threshold (e.g., 100). Hepatotoxicity can map to severe hepatotoxicity or even to localized necrosis. Note that when potency changes, each SS's Q value also changes, and that causes its pAVG and toxin elimination count to change.
Fig. 5.
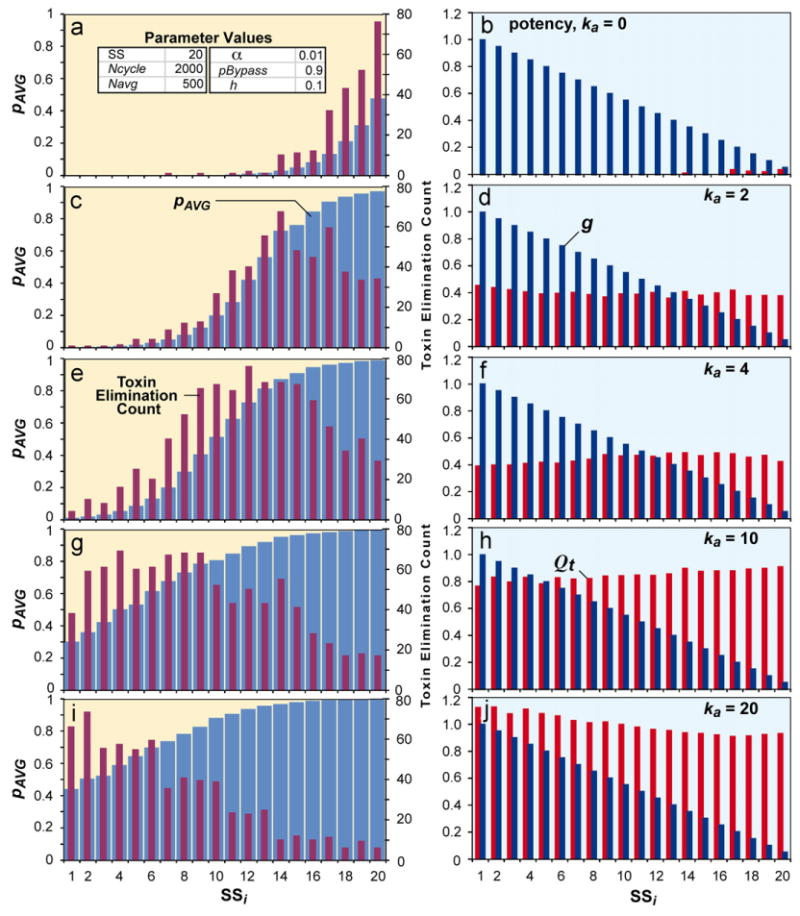
PreZoRLA2 clearance patterns for five toxins having different potencies. Running the mechanism in Fig. 2d created the SS patterns. In the left side panels, average clearance efforts, pAVG (blue bars), as well as toxin elimination count (red bars) for each SS are plotted. pAVG is the probability that an SS will clear a detected toxin, averaged over the past Navg=500 simulation cycles. toxin elimination count is the number of toxins cleared by SSi. In the right-side panels, corresponding g and Qt values are graphed. The apparent oscillations in toxin elimination count are a consequence of multiple random events; they begin to vanish as values from several simulations are averaged. For interpretation of the references to colour in this figure legend, the reader is referred to the web version of this article.
Fig. 5 shows patterns of clearance effort produced by preZoRLA2 for five different ka values. The average clearance efforts, pAVG (blue bars), as well as toxin elimination count (red bars) are shown in Fig. 5a, c, e, g, and i. Corresponding g and Q values are also shown (Fig. 5b, d, f, h, and j). When ka=0, only perivenous SSs expended clearance effort (Fig. 5a). As ka increased, the response expanded toward the periportal region. The peak toxin elimination count also moved toward the periportal region as well.
3.3. Zonation patterns during 2D ZoRLA experiments depend on compound potency
To explore emergence of stable zonation patterns, we conducted two sets of experiments using somewhat different ZoRLAs, one using h=5, and the other using h=70. Both used the same prespecified P-to-P g gradient for all five experiments. Parameter ranges are listed in Table 2. In both cases, ZoRLAs were dosed at the start of each simulation cycle with 50 compound having the same potency. A simulation cycle continued until all compound exited or were cleared. Several experiments were conducted for each ka. In all experiments, at t=0, random p values were assigned to each SS. Values at early t for repeat experiments (same ka) were not identical, but they became identical by the end of the experiment.
In the first set of experiments (Fig. 6) h=5, and compound potency spanned a 20-fold range. Experiments terminated at t=1000. SSs were assigned to ten equal width zones. Values of pi, Qi, and the cumulative number of compound cleared by each SS in a given zone (compound elimination count) were averaged at t=1000. The value of Q used by SSi during simulation cycle t is an estimate of its long-term, discounted cost of continuing to use its current clearance effort, pt. The results graphed in Fig. 6 show that increasing potency caused values of pavg for periportal zones to increase; it also caused the peak compound elimination count (which maps to measurable hepatotoxicity) to shift from PERIVENOUS to periportal. Within each zone, Qavg increased with increasing potency.
Fig. 6.

Zonation following dosing one ZoRLA with each of five compound having different potencies (ka). For simplicity, pBypass for each SS and each compound was held constant at 0.8. At the start (t=0), a random p value was assigned to each SSi. A dose of 50 compound was administered for each of 1000 simulation cycles. By then, stable patterns had emerged. A simulation cycle continued until all compound exited or were cleared. Values at early t during repeat experiments were not identical, but by t=1000 they became identical. X-axis: the distance from periportal edge to central vein exit was subdivided into ten regions. For each ka experiment, there are four bar graphs. The two on the left provide measures of zonation. pavg is the mean of all pi's in one of the ten zones; pi,t was updated using h=5. Using the default value h=70 used for Figs. 7–10, we were unable to clearly demonstrate the compound elimination shift effect. The clearance effort shift effect became more evident for smaller h values. We selected h=5 to demonstrate that peak compound elimination count can shift from PERIVENOUS to periportal as ka increases. Clearance effort, pavg, maps to average intrinsic clearance for a lobular tissue sample taken from the same relative location within a lobule. The cumulative total of compound eliminated by each SSi was recorded. compound elimination count is the mean of those values for each region. On the right g is plotted, the value of the local gradient (which is the same for each of the five ka experiments), and the mean, regional Q value.
In the second set of experiments (Fig. 7) h=70 and compound potency spanned a 10-fold range. Experiments were terminated after stable patterns were achieved at t=500. The different, individual SS clearance effort values are shown in Fig. 7b.
Fig. 7.
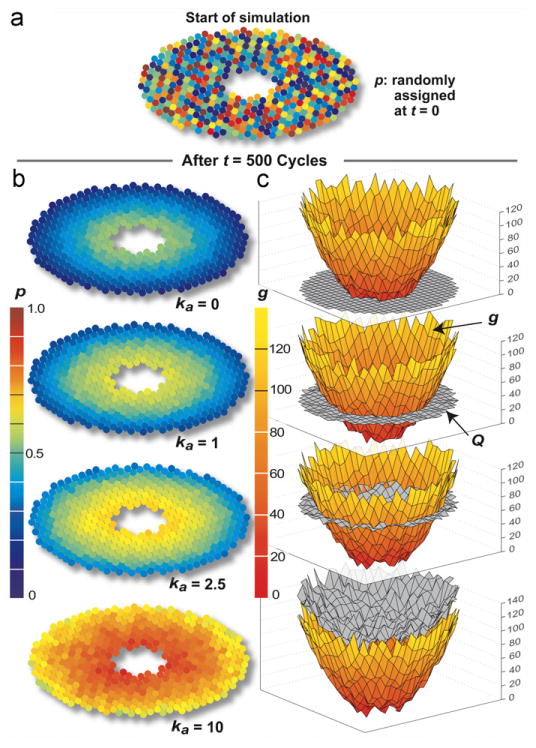
ZoRLA zonation patterns. The experiments are the same as for Fig. 6, except that h=70. The dose each simulation cycle was 50 compounds and pBypass=0.8 for all compounds. (a) At t=0, each SS was assigned a random p value (0–1 color scale). (b) The updated value of pi is shown at the conclusion of the 500th simulation cycle following dosing with one of four compounds having different potencies (ka). (c) Values of g (rust to yellow color scale) and Qi (gray) are graphed at t=500. For interpretation of the references to colour in this figure legend, the reader is referred to the web version of this article.
To explore plausible patterns of hepatotoxicity, we specified that SS damage occur (which can map to either severe hepatocyte damage or necrosis) when any SS in Fig. 7 cleared 50 compound. We conducted experiments for ka=0, 1, 2.5, and 10. For ka=1, consistent damage is evident after t=400. It is evident earlier for ka=5 and 10. Results are shown in Fig. 8 at t=500, t=550 (ka=5 and 10), and t=600 (ka=1). Patterns are similar to the compound elimination counts in Fig. 6. The low potency compound (ka=1) caused PERIVENOUS hepatotoxicity, whereas for the higher potency compound (ka=5 and 10), there was more periportal hepatotoxicity.
Fig. 8.
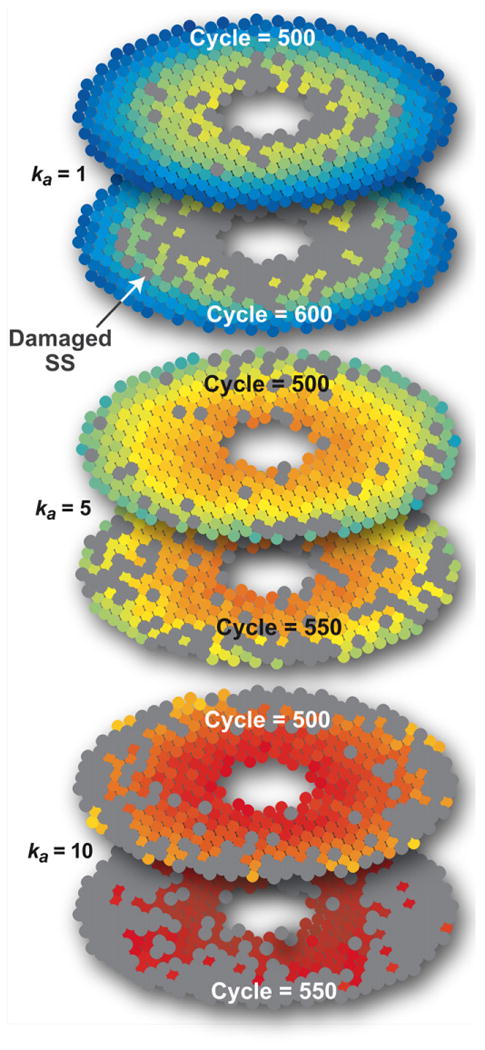
Patterns of SS damage. The ZoRLA experimental protocol and p color scale are the same as in Fig. 7. We specified that damage (which can map to either severe hepatocyte damage or necrosis) occurs after any SSi cleared 50 compounds. A damaged SS is gray. Following repeated dosing with one of the three compounds having potencies of ka=1, 5, and 10, the updated value of pi for an undamaged SS is shown after the indicated number of simulation cycles. The DOSE each simulation cycle was 50 compounds.
In addition to ka, changes in pBypass can dramatically influence zonation patterns. Examples are provided in Supplementary Fig. S6 for twenty different combinations of ka and pBypass values.
3.4. Quantitative validation for dose-dependent ZoRLA zonation patterns
The ZoRLA used for Fig. 7 was reused to explore the consequences of changing the dose per simulation cycle on zonal patterns of clearance effort. The results in Fig. 9 are for five different repetitive dosing experiments using a medium potency compound, ka=5. The dose per simulation cycle ranged from 10 to 1000 compounds. Shown is the pattern at the conclusion of the 500th cycle. Note that repetitive dosing with 50 compounds having ka=1 in Fig. 7 gave a pattern quite similar to repetitive dosing with 10 compounds having ka=5 in Fig. 9. Note also that repetitive dosing with 50 compounds having ka=10 in Fig. 7 gave a pattern quite similar to repetitive dosing with 100 compounds having ka=5 in Fig. 9.
Fig. 9.

Dose–response patterns. The ZoRLA, experimental protocol, and color scale are the same as in Fig. 7. The damage option is turned off. Five experiments were conducted. Each simulation cycle began with the indicated dose of a compound having ka=5. These data are used in Fig. 10b.
The data in Fig. 10a are redrawn from (Birnbaum et al., 1999). The data show CYP1A2 mRNA expression in periportal and perivenous hepatocytes obtained from rats three days after a single oral dose of 0.01, 0.3, or 10.0 μg [3H]TCDD/kg (2,3,7,8-tetrachlorodibenzo-p-dioixon); LD50=0.034 mg/kg, a potent toxin and a potent inducer of P450 isozymes. To what extent can the data in Fig. 9 be mapped to observations in Fig. 10a?
Fig. 10.
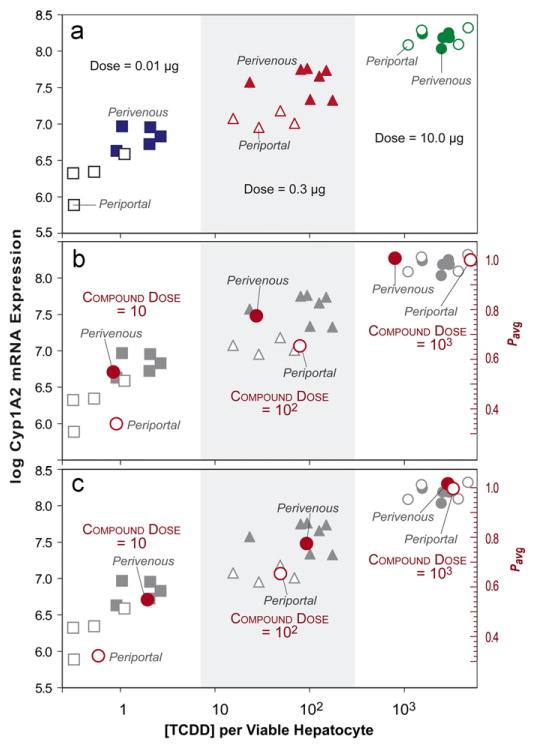
Wet-lab and ZoRLA data showing dose-dependent zonation. (a) Dose-dependent (x-axis) localization of [3H]TCDD (2,3,7,8-tetrachlorodibenzo-p-dioixon) and CYP1A2 mRNA expression (y-axis) in periportal and perivenous hepatocytes obtained from rats three days after a single oral dose of 0.01, 0.3, or 10.0 μg TCDD/kg; redrawn from Birnbaum et al. (1999). X-axis: levels of [3H]TCDD in the two-cell subpopulations expressed as attograms [3H]TCDD/viable hepatocyte; y-axis: log Cyp1A2 mRNA expression level. (b) The mean periportal and PERIVENOUS clearance effort values (pavg, right axis) from Fig. 9 are mapped to the wet-lab data using the transforms described in Results Section 3.4. The ZoRLA space was divided into two equal regions (zones) and the mean pi (pavg: right axis) along with mean compound elimination count within each region were calculated. The measurements were transformed to map quantitatively to the wet-lab data (both y- and x-axis placement) as described in Results. (c) The experiments that yielded Fig. 9 DOSE–response patterns were repeated using pBypass=0.99 rather than 0.8. pavg and mean compound elimination count were calculated as in (b). The measurements were transformed to map quantitatively to the wet-lab data as described in Results.
We needed two separate mappings: one from pavg to log Cyp1A2 mRNA expression levels, and the second from compound elimination count (CEC) at the end of the simulation (t=500) to [3H] counts – assumed to be TCDD – per viable hepatocyte isolated from periportal and perivenous tissue samples three days after dosing. We first explored simple linear mappings. In the case when that failed, we next explored log-linear mappings. We followed a three-step mapping process. First, as done with the wet-lab protocol, we divided the lobule into two regions and then averaged the clearance efforts in Fig. 9. Second, we specified that a simple linear correlation should exist between clearance efforts and log Cyp1A2 mRNA expression levels, and that the levels of induction for the high dose are close the maximum that can be achieved (they correspond to p≈1.0). Of the several mappings tried, the one for which y-axis similarity was closest was transformed data=3.8(pavg)+4.6. Those transformed values are graphed in Fig. 10b.
Step three was placement of the transformed ZoRLA data relative to wet-lab x-axis values. That mapping was not straightforward. SSs map to more than just hepatocytes. There is not a 1:1 mapping from a compound to an amount of TCDD. Further, a compound in low and high dose experiments can (and should) map to different amounts of TCDD. Finally, although we measured CECavg after 500 simulation cycles, we did not include processes that would map to either (1) elimination and removal of metabolites or (2) redistribution of TCDD and metabolites to tissues. Nevertheless, we sought a single transform that would provide similarities following quantitative mapping. None of the simple linear mappings were effective. The one used in Fig. 10b transformed CECavg according to the following log-linear equation: log(x)=2 log(CECavg)−9.
However, note that for the two lower doses, there was more TCDD per perivenous than periportal hepatocyte. For ZoRLA experiments in Fig. 9, there was little difference in the corresponding low dose transformed CECavg values. For the two larger doses, however, the periportal transformed CECavg values were largest. Adopting those observations as targeted attributes falsified the Fig. 9 mechanism. Changing pBypass can alter the trend in Fig. 10b. For Figs. 6–9, pBypass was arbitrarily set to 0.8. We increased pBypass to 0.99, which would map to compound that is extensively bound to blood proteins, and repeated the experiments in Fig. 9. The transformation of pavg to log Cyp1A2 mRNA expression levels (y-axis) was the same as for Fig. 10b. We again sought a single transform that would provide a reasonable quantitative mapping. The one used in Fig. 10c transformed CECavg as follows: log(x)=1.3 log(CECavg)+0.51. Note that the similarity between perivenous—periportal differences in transformed CECavg values for each dose and the corresponding wet-lab values has improved.
4. Discussion
4.1. Plausible mappings of SS mechanisms to hepatic counterparts
Braeuning recently presented arguments and supporting evidence for the Ras–Raf–MAPK and Wnt-β-catenin signaling pathways playing roles in both hepatocyte zonation as well as induction of P450 isozymes (2009). There are clear consistencies between the ideas presented in that paper and the more abstract preZoRLA1 mechanisms, and they are identified in Supplementary Material.
Braeuning also presents evidence of an overall deactivating or repressive effect of Ras–Raf–MAPK (mitogen-activated, protein kinase) signaling on expression of CYP enzymes. Because detection of local gradients (g-subsystem) by the clearance management module in Fig. 2d causes decrement of clearance effort, we conjecture that a mapping exists between that ZoRLA process and processes that include the Ras–Raf–MAPK signaling pathway. In addition, there is evidence for direct transcriptional activation of CYPs by Wnt-β-catenin signaling. The case is made that the β-catenin pathway can be regarded as a decisive factor in the regulation of the perivenous hepatocyte gene expression profile, including basal expression of CYPs and other xenobiotic-metabolizing enzymes. Because detection of response signals by the clearance management module causes increment of clearance effort, we conjecture that a mapping also exists between that process and hepatocyte processes that include the Wnt-β-catenin signaling pathway. With further iterative refinement of the clearance management module, those mappings can be made increasingly concrete.
When designing a synthetic analogue, there is a strong inclination to insert counterparts to specific biological features, such as including a component that directly represents the Wnt-β-catenin signaling pathway, simply because current evidence indicates that the component plays some role in generating the targeted phenomena. Doing so prematurely is a mistake when we are not yet confident of the component's putative role in causing the phenomena. So doing forces establishing groundings to other components at a specific level of granularity that may or may not be warranted for the attributes targeted coupled with the current levels of knowledge, ignorance, and uncertainty. The components in Fig. 2 are more abstract and coarse-grained than the Wnt-β-catenin signaling pathway. They were made only as complicated and specific as needed to achieve the patterns and attributes targeted. They can be made more fine-grained and specific iteratively, as the set of attributes targeted expands. Once a degree of validation has been achieved for coarse-grained components, their behaviors during simulation can be used for cross-model validation during refinement to more fine-grained (greater mechanistic detail) counterparts.
The current abstract micromechanisms map to a conflation of all fine-grained processes in lobules that contribute to the simulated events. If we do not have specific evidence on how some known signaling and/or metabolic pathway is contributing, then there is no scientific value in simply implementing some conceptual linkage simply for the sake of including it. So, how can one achieve such linkage?
Consider the following. We have observations from identical experiments on two different livers, one normal (wild type) and another from a mouse that has had one or more components within a signaling &/or metabolic pathway measurably altered, e.g., by genetic deletion. Wet-lab data from the knockout's liver (but not that from the normal liver) falsifies the current micromechanism. That evidence forces us to posit one or more new, more fine-grained micromechanisms that incorporate one or more features containing the knocked-out component. Such an approach was used by Tang and Hunt (2010) to falsify a coarse-grained micromechanism and replace it with one more fine-grained in which components mapped directly to individual macromolecules.
A related question is, how can one parse specific micromechanisms from the overall, systemic behaviors observed experimentally? An effective strategy is to expand the variety of systemic attributes targeted. Addition of a new attribute can falsify a micromechanism. To revalidate, it may be necessary to replace a coarse-grained micromechanism with one that is somewhat more fine-grained. Following that, a clearer mapping may exist between the more fine-grained micromechanism and the signaling and/or metabolic pathways of interest. Further iterative refinement can increase the concreteness of the mapping. Such a process was used by Lam and Hunt (2010) to move iteratively from coarser to more fine-grained micromechanistic hypotheses.
4.2. Inverse maps from phenomena to generators
The exploration of an inverse map from phenomena (patterns of zonation) to generators requires one to hypothesize and then build generators that may cause the phenomena. The question posed is this: given phenomena such as intralobular zonation, what plausible generators might cause their emergence over time? However, a generator-phenomenon map is not one-to-one. Many generator compositions (mechanisms) can produce phenomena, which when measured are indistinguishable. Nevertheless, the first step is to find and validate one, which is what we have done here. So doing opens the door to discovering others. When we find a hypothetical generator in the form of an extant biomimetic mechanism, we do not yet have new biological knowledge, but we do have a concrete instance of a strictly defined, plausible and observable mechanism within a system suitable for experimentation, as called for by Christoffels et al. (1999), whereas before we only had unchallenged concepts. Searching for and finding a grounding map of the type in Fig. 10c is an important part of the process of improving the plausibility of an inverse map. In the absence of other concrete, competing theories, that system and its mechanism can stand as the current best explanation of the phenomena's cause until falsified by evidence. A systematic, scientific study of any inverse map (phenomenon-to-generator) can only be done with concretizable hypotheses, either biological or in silico. It cannot be done with hypotheses that remain conceptual (Hunt et al., 2009).
As this new M&S method matures, we anticipate that the preferred approach will be to identify several somewhat different yet still plausible generator models and refine them in parallel against an expanding set of targeted attributes. We can expect that modest, selective expansions in the set of targeted attributes will eliminate some generator concepts but allow others to advance following refinement.
4.3. Objective achieved
In Methods, we specified that r-signals are compound dependent, and listed three mechanistic options: (1) a compound or its metabolite functions as a r-signal; (2) a compound or its metabolite initiates a response within a SS and that response (or an object generated by that response) functions as a r-signal that is detectable subsequently by other SS; and (3) a compound or its metabolite that escapes lobular clearance initiates an extrahepatic response, and that response (or an object generated by that response) is an r-signal that is SS detectable. We implemented the third option, because early exploratory simulations indicated that it would be the simplest to implement. Exploratory simulations showed that zonation does occur when using compounds as r-signals for single-pass dosing experiments. Examples are provided in Supplementary Figs. S3 and S4. However, those explorations did demonstrate that the first option could not achieve targeted attribute 7 because the r-signals generated stay within each SS and so cannot influence other SSs. Option two is more complicated than option three. Given the evidence presented herein, it merits exploration. It seems likely that there are several mechanisms by which zonation of hepatic cellular properties could occur. The approach used herein can be extended to discover and investigate those options.
Reports on regional hepatic CYP1A1 and CYP1A2 induction describe a “switch-like” hepatocyte response to TCDD: a sharp boundary between areas of induced and noninduced cells (Andersen et al., 1997; Andersen and Conolly, 1998; Broccardo et al., 2004). Although this phenomena was not among the ten attributes targeted, we discovered that decreasing h to very small values, e.g., 0.01 and smaller, caused ZoRLA to exhibit a clear-cut, switch-like behavior, in which the zonal location of the switch is dose dependent. An example is provided in Supplementary Fig. S2.
With the 2D ZoRLA design in Figs. 2 and 3, the abstract mechanism in Fig. 2d, and the results in Figs. 6–10, we achieved targeted attributes 1–10, with two exceptions, attributes 8d and g. The effects of hypophysectomy and other treatments on lobular mRNA distributions of various P450 isozymes (8d) is fascinating, but beyond the scope of simple ZoRLAs. Attribute 8c, cites an example of a xenobiotic inducing zonation patterns that are the reverse of those in Figs. 7 and 9. If gi in Eq. (1) is replaced by (gmax—gi), the patterns in Figs. 7 and 9 are reversed.
Based on the preceding evidence, we suggest that hepatic counterparts to the mechanism in Fig. 2d, along with the zonation patterns produced, exist in rats when treated with some xenobiotics. The implication of these ZoRLA experiments is that hepatocytes do learn from experience and can cooperate to remove xenobiotics, including some that produce significant response or toxicity.
The 2D ZoRLA provides value in three ways. (1) When a specific mechanism generates patterns different from those observed in wet-lab data, then the micromechanisms used in the model are likely incorrect and in need of modification. (2) Having achieved a degree of validation, the model's concrete micromechanisms can be challenged experimentally. (3) We have demonstrated the feasibility of predicting spatially heterogeneous induction (and toxicity) patterns in whole lobules for a new compound, given a validated ZoRLA and data that can be obtained in vitro. If the relative level of interaction of a new compound can be measured in a simple in vitro test, then that information may be sufficient to parameterize the ZoRLA and anticipate what dose, time, and zone dependent patterns that compound may generate and if toxicity is likely.
The results also demonstrate a new scientific method to experimentally explore and challenge mechanistic hypotheses about the causal nature of toxicological and pharmacological phenomena.
Supplementary Material
Acknowledgments
We thank members of the UCSF BioSystems Group (Sean Kim, Jon Tam, Teddy Lam, and Jesse Engelberg), Glen Ropella, Yoav Shoham, and Zbigniew Kmieç for helpful suggestions and discussions. The work was supported in part by a Computational and Systems Biology Fellowship (SSB) provided by the CDH Research Foundation (CDHRP-08-0044). The Foundation played no role in the design or conduct of the research.
Footnotes
Appendix A. Supplementary material: Supplementary data associated with this article, including figures and video clips, can be found in the online version at doi:10.1016/j.jtbi.2010.06.011.
References
- An G, Mi Q, Dutta-Moscato J, Vodovotz Y. Agent-based models in translational systems biology. Wiley Interdiscip Rev Syst Biol Med. 2009;1:159–171. doi: 10.1002/wsbm.45. [DOI] [PMC free article] [PubMed] [Google Scholar]
- Andersen ME, Birnbaum LS, Barton HA, Eklund CR. Regional hepatic CYP1A1 and CYP1A2 induction with 2, 3, 7, 8-tetrachlorodibenzo-p-dioxin evaluated with a multicompartment geometric model of hepatic zonation. Toxicol Appl Pharmacol. 1997;144:145–155. doi: 10.1006/taap.1996.8067. [DOI] [PubMed] [Google Scholar]
- Andersen ME, Conolly RB. Mechanistic modeling of rodent liver tumor promotion at low levels of exposure: an example related to dose–response relationships for 2, 3, 7, 8-tetrachlorodibenzo-p-dioxin. Hum Exp Toxicol. 1998;17:683–690. doi: 10.1177/096032719801701208. [DOI] [PubMed] [Google Scholar]
- Benhamouche S, Decaens T, Perret C, Colnot S. Wnt/β-catenin pathway and liver metabolic zonation: a new player for an old concept. Med Sci. 2006;22:904–906. doi: 10.1051/medsci/20062211904. [DOI] [PubMed] [Google Scholar]
- Birnbaum LS, Alcasey SK, Lucier GW, Lindros KO, Blanton J, Walker NJ, Richardson VM, Santostefano MJ. Dose-dependent localization of TCDD in isolated centrilobular and periportal hepatocytes. Toxicol Sci. 1999;52:9–19. doi: 10.1093/toxsci/52.1.9. [DOI] [PubMed] [Google Scholar]
- Braeuning A. Regulation of cytochrome P450 expression by Ras-and-Catenin-dependent signaling. Curr Drug Metab. 2009;10:138–158. doi: 10.2174/138920009787522160. [DOI] [PubMed] [Google Scholar]
- Broccardo CJ, Billings RE, Chubb LS, Andersen ME, Hanneman WH. Single cell analysis of switch-like induction of CYP1A1 in liver cell lines. Toxicol Sci. 2004;78:287–294. doi: 10.1093/toxsci/kfh077. [DOI] [PubMed] [Google Scholar]
- Buhler R, Lindros KO, Nordling A, Johansson I, Ingelman-Sundberg M. Zonation of cytochrome P 450 isozyme expression and induction in rat liver. Eur J Biochem. 1992;204:407–412. doi: 10.1111/j.1432-1033.1992.tb16650.x. [DOI] [PubMed] [Google Scholar]
- Burke ZD, Reed KR, Phesse TJ, Sansom OJ, Clarke AR, Tosh D. Liver zonation occurs through a β-Catenin-dependent, c-Myc-independent mechanism. Gastroenterology. 2009;136:2316–2324. doi: 10.1053/j.gastro.2009.02.063. [DOI] [PubMed] [Google Scholar]
- Camp JP, Capitano AT. Induction of zone-like liver function gradients in HepG2 cells by varying culture medium height. Biotechnol Prog. 2007;23:1485–1491. doi: 10.1021/bp070308v. [DOI] [PubMed] [Google Scholar]
- Christoffels VM, Sassi H, Ruijter JM, Moorman AF, Grange TLWH. A mechanistic model for the development and maintenance of portocentral gradients in gene expression in the liver. Hepatology. 1999;29:1180–1192. doi: 10.1002/hep.510290413. [DOI] [PubMed] [Google Scholar]
- Darden L. Strategies for discovering mechanisms: schema instantiation, modular subassembly, forward/backward chaining. Philos Sci. 2002;69:354–365. [Google Scholar]
- Fisher J, Henzinger TA. Executable cell biology. Nat Biotechnol. 2007;25:1239–1250. doi: 10.1038/nbt1356. [DOI] [PubMed] [Google Scholar]
- Gebhardt R. Metabolic zonation of the liver: regulation and implications for liver function. Pharmacol Ther. 1992;53:275–354. doi: 10.1016/0163-7258(92)90055-5. [DOI] [PubMed] [Google Scholar]
- Grimm V, Revilla E, Berger U, Jeltsch F, Mooij WM, Railsback SF, Thulke HH, Weiner J, Wiegand T, DeAngelis DL. Pattern-oriented modeling of agent-based complex systems: lessons from ecology. Science. 2005;310:987–991. doi: 10.1126/science.1116681. [DOI] [PubMed] [Google Scholar]
- Hailfinger S, Jaworski M, Braeuning A, Buchmann A, Schwarz M. Zonal gene expression in murine liver: lessons from tumors. Hepatology. 2006;43:407–414. doi: 10.1002/hep.21082. [DOI] [PubMed] [Google Scholar]
- Hunt CA, Ropella GEP, Lam TN, Tang J, Kim SHJ, Engelberg JA, Sheikh-Bahaei S. At the biological modeling and simulation frontier. Pharm Res. 2009;26:2369–2400. doi: 10.1007/s11095-009-9958-3. [DOI] [PMC free article] [PubMed] [Google Scholar]
- Hunt CA, Ropella GEP, Yan L, Hung DY, Roberts MS. Physiologically based synthetic models of hepatic disposition. J Pharmacokinet Pharmacodyn. 2006;33:737–772. doi: 10.1007/s10928-006-9031-3. [DOI] [PubMed] [Google Scholar]
- Ierapetritou MG, Georgopoulos PG, Roth CM, Androulakis LP. Tissue-level modeling of xenobiotic metabolism in liver: an emerging tool for enabling clinical translational research. Clin Transl Sci. 2009;2:228–237. doi: 10.1111/j.1752-8062.2009.00092.x. [DOI] [PMC free article] [PubMed] [Google Scholar]
- Jungermann K. Zonation of metabolism and gene expression in liver. Histochem Cell Biol. 1995;103:81–91. doi: 10.1007/BF01454004. [DOI] [PubMed] [Google Scholar]
- Jungermann K, Kietzmann T. Oxygen: modulator of metabolic zonation and disease of the liver. Hepatology. 2000;31:255–260. doi: 10.1002/hep.510310201. [DOI] [PubMed] [Google Scholar]
- Lam TN, Hunt CA. Discovering plausible mechanistic details of hepatic drug interactions. Drug Metab Dispos. 2009;37:237–246. doi: 10.1124/dmd.108.023820. [DOI] [PubMed] [Google Scholar]
- Lam TN, Hunt CA. Mechanistic insight from in silico pharmacokinetic experiments: roles of P-glycoprotein, Cyp3A4 enzymes, and microenvironments. J Pharmacol Exp Ther. 2010;332:398–412. doi: 10.1124/jpet.109.160739. [DOI] [PubMed] [Google Scholar]
- Lindros KO. Zonation of cytochrome P450 expression, drug metabolism and toxicity in liver. Gen Pharmacol. 1997;28:191–196. doi: 10.1016/s0306-3623(96)00183-8. [DOI] [PubMed] [Google Scholar]
- Liu S, Salyapongse AN, Geller DA, Vodovotz Y, Billiar TR. Hepatocyte toll-like receptor 2 expression in vivo and in vitro: role of cytokines in induction of rat TLR2 gene expression by lipopolysaccharide. Shock. 2000;14:361–365. doi: 10.1097/00024382-200014030-00021. [DOI] [PubMed] [Google Scholar]
- Masuda Y, Yamamori Y. Histological evidence for dissociation of lipid peroxidation and cell necrosis in bromotrichloromethane hepatotoxicity in the perfused rat liver. Jpn J Pharmacol. 1991;56:143–150. doi: 10.1254/jjp.56.143. [DOI] [PubMed] [Google Scholar]
- Matzinger P. The danger model: a renewed sense of self. Science. 2002;296:301–305. doi: 10.1126/science.1071059. [DOI] [PubMed] [Google Scholar]
- Ohno H, Naito Y, Nakajima H, Tomita M. Construction of a biological tissue model based on a single-cell model: a computer simulation of metabolic heterogeneity in the liver lobule. Artif Life. 2008;14:3–28. doi: 10.1162/artl.2008.14.1.3. [DOI] [PubMed] [Google Scholar]
- Oinonen T, Lindros KO. Zonation of hepatic cytochrome P-450 expression and regulation. Biochem J. 1998;329:17–35. doi: 10.1042/bj3290017. [DOI] [PMC free article] [PubMed] [Google Scholar]
- Oinonen T, Saarikoski S, Husgafvel-Pursiainen K, Hirvonen A, Lindros KO. Pretranslational induction of cytochrome P 4501 A enzymes by β-naphthoflavone and 3-methylcholanthrene occurs in different liver zones. Biochem Pharmacol. 1994;48:2189–2197. doi: 10.1016/0006-2952(94)00385-8. [DOI] [PubMed] [Google Scholar]
- Park S, Ropella GEP, Kim SHJ, Roberts MS, Hunt CA. Computational strategies unravel and trace how liver disease changes hepatic drug disposition. J Pharmacol Exp Ther. 2009;328:294–305. doi: 10.1124/jpet.108.142497. [DOI] [PubMed] [Google Scholar]
- Pink BSP. Hepatic Zonation of Δ1-pyrroline-5-carboxylate metabolism, Master of Science thesis. Department of Biochemistry, Memorial University of Newfoundland; St. John's, Newfoundland, Canada: 2001. [Google Scholar]
- Ropella GEP, Park S, Hunt CA. Evaluating an hepatic enzyme induction mechanism through coarse- and fine-grained measurements of an in silico liver. Complexity. 2008;14:28–34. [Google Scholar]
- Sarangapani R, Teeguarden J, Plotzke KP, McKim JM, Jr, Andersen ME. Dose–response modeling of cytochrome P450 induction in rats by octamethylcyclotetrasiloxane. Toxicol Sci. 2002;67:159–172. doi: 10.1093/toxsci/67.2.159. [DOI] [PubMed] [Google Scholar]
- Sekine S, Lan BYA, Bedolli M, Feng S, Hebrok M. Liver-specific loss of b-catenin blocks glutamine synthesis pathway activity and cytochrome p450 expression in mice. Hepatology. 2006;43:817–825. doi: 10.1002/hep.21131. [DOI] [PubMed] [Google Scholar]
- Sheikh-Bahaei S, Kim SHJ, Sheikhbahahaei S, Hunt CA. Understanding the role of liver zonation in toxin elimination. Int J Intell Control Syst. 2009;14:33–40. [Google Scholar]
- Tang J, Hunt CA. Identifying the rules of engagement enabling leukocyte rolling, activation, and adhesion. PLoS Comput Biol. 2010;6:e1000681. doi: 10.1371/journal.pcbi.1000681. [DOI] [PMC free article] [PubMed] [Google Scholar]
- Tritscher AM, Goldstein JA, Portier CJ, McCoy Z, Clark GC, Lucier GW. Dose–response relationships for chronic exposure to 2, 3, 7, 8-tetrachlorodibenzo-p-dioxin in a rat tumor promotion model: quantification and immunolocalization of CYP1A1 and CYP1A2 in the liver. Cancer Res. 1992;52:3436–3442. [PubMed] [Google Scholar]
- Walker NJ, Crofts FG, Li Y, Lax SF, Hayes CL, Strickland PT, Lucier GW, Sutter TR. Induction and localization of cytochrome P450 1B1 (CYP1B1) protein in the livers of TCDD-treated rats: detection using polyclonal antibodies raised to histidine-tagged fusion proteins produced and purified from bacteria. Carcinogenesis. 1998;19:395–402. doi: 10.1093/carcin/19.3.395. [DOI] [PubMed] [Google Scholar]
- Watkins CJCH, Dayan P. Technical note: Q-learning. Mach Learn. 1992;8:279–292. [Google Scholar]
- Yan L, Ropella GEP, Park S, Roberts MS, Hunt CA. Modeling and simulation of hepatic drug disposition using a physiologically based, multi-agent in silico liver. Pharm Res. 2008a;25:1023–1036. doi: 10.1007/s11095-007-9494-y. [DOI] [PubMed] [Google Scholar]
- Yan L, Sheihk-Bahaei S, Park S, Ropella GEP, Hunt CA. Predictions of hepatic disposition properties using a mechanistically realistic, physiologically based model. Drug Metab Dispos. 2008b;36:759–768. doi: 10.1124/dmd.107.019067. [DOI] [PubMed] [Google Scholar]
- Zeigler BP, Kim TG, Praehofer H. Theory of Modeling and Simulation. Academic Press Inc.; Orlando, FL, USA: 2000. [Google Scholar]
Associated Data
This section collects any data citations, data availability statements, or supplementary materials included in this article.