

Abstract
Lipopolysaccharide, known as endotoxin, can stimulate potent host immune responses through the complex of Toll-like-receptor 4 and myeloid differentiation protein 2; but its influence on Saccharomyces cerevisiae, a model organism for studying eukaryotes, is not clear. In this study, we found that lipopolysaccharide-treated S. cerevisiae cells could be stained by methylene blue, but did not die. Transcriptional profiling of the lipopolysaccharide-treated S. cerevisiae cells showed that 5745 genes were modulated: 2491 genes up-regulated and 3254 genes down-regulated. Significantly regulated genes (460 up-regulated genes and 135 down-regulated genes) in lipopolysaccharide-treated S. cerevisiae cells were analyzed on Gene Ontology, and used to establish physical protein-protein interaction network and protein phosphorylation network. Based on these analyses, most of the regulated genes in lipopolysaccharide-treated S. cerevisiae cells were related to cell wall, membrane, peroxisome and mitochondrion. Further experiments demonstrated that lipopolysaccharide stimulation caused the exposure of phosphatidylserine and the increase of mitochondrial membrane potential in S. cerevisiae cells, but levels of intracellular reactive oxygen species and metacaspase activation were not increased. This study demonstrated that lipopolysaccharide stimulation causes significant changes in S. cerevisiae cells, and the results would contribute to understand the response of eukaryotic cells to lipopolysaccharide stimulation.
Introduction
Saccharomyces cerevisiae is a model organism commonly used to study many obscure aspects of important human pathologies that are harder to elucidate using other more complex eukaryotic models [1], [2], [3]. Different stresses cause different responses in S. cerevisiae and usually result in cell death [3], [4]. For example, heat shock, oxidative stress and reagents such as formic acid and aspirin commit apoptosis in S. cerevisiae cells [5]–[8], while leucine starvation and the pharmacological reagent rapamycin cause autophagy [9]–[11].
Lipopolysaccharide (LPS), known as endotoxin, is an essential component of the outer membrane in most Gram-negative bacteria, and it consists of a hydrophobic moiety termed as lipid A and a large polysaccharide subdivided into the nonrepeating “core” oligosaccharide and the O-antigen repeats [12], [13]. LPS has profound effect on the mammalian immune system and great significance in the pathophysiology of many disease processes [14]–[16]. As a pathogen-associated antigen, LPS can be recognized by different immune cells through a protein complex consisting of Toll-like receptor 4 and myeloid differentiation protein 2, trigger the production and release of pro-inflammatory cytokines, and activate the immune cells in inflammatory systems [14].
Considering the similarity between yeast and mammalian cells, the response of yeast to LPS stimulation might provide important information on the signal transducing mechanisms underlying inflammatory responses in mammalian cells, and assist in the search and screening of new potential anti-inflammatory drugs. However, there are only a couple of papers published on the response of yeast to LPS. One study concluded that S. cerevisiae is able to respond to the presence of LPS and that Hog1 was phosphorylated and a few genes such as GPD1 were up-regulated in cells exposed to LPS [17]. To understand the detailed mechanism on the response of S. cerevisiae to LPS, we systematically investigated LPS-treated S. cerevisiae BY4742 cells using transcriptome analysis and different staining methods.
Material and Methods
Methylene blue staining and cell viability determination
S. cerevisiae BY4742 was grown in YPD media (2% tryptone, 1% yeast extract, 2% glucose) or SD media (0.67% yeast nitrogen base, 2% glucose) supplemented with appropriate amino acids at 30°C. S. cerevisiae cells were harvested at the pre-log phase, and resuspended in phosphate-buffered saline (PBS, pH7.4). LPS from Escherichia coli O111:B4 (Sigma-Aldrich) was dissolved in PBS at 2 mg/mL and mixed with the cell suspensions. The optical density at 600 nm (OD600) of the mixture was adjusted to 2.0. The mixture was incubated at 30°C. When SD media were used to replace PBS in some experiments, 0.5 mg/mL LPS was used, and OD600 of the mixture was adjusted to 1.0.
Methylene blue (Sinopharm Chemical Reagent) was used to stain S. cerevisiae cells after treated with different concentrations of LPS. Three different methylene blue solutions with different pH were prepared. The first solution contains 0.01% methylene blue and 2% sodium citrate [18]; the second solution was prepared by dissolving 0.3 g methylene blue in 30 mL 95% EtOH mixed with 70 mL 0.01% KOH [19]; the third solution contains 0.02% methylene blue, 2.72% KH2PO4, and 0.072‰ Na2HPO4 [20]. S. cerevisiae cell suspensions were mixed with equal volume of the methylene blue solution for 3 min [19] or 10 min [18], [20] and the stained cells were observed under light microscopy.
To quantify the number of viable yeast cells in the mixture of S. cerevisiae cells with or without LPS, serial dilutions of the mixture were dropped on YPD agar plate, and colonies were counted after 3-day's incubation at 30°C.
RNA preparation and the whole genome transcriptional analysis
The whole genome analysis of gene expression was established according to the published method [17]. A single colony of S. cerevisiae cells was inoculated in SD media supplemented with appropriate amino acids. When OD600 reached 1.0, cells were divided and incubated with or without 0.5 mg/mL LPS in SD media. After incubation at 30°C for 90 min or 180 min with gentle shaking, cells were harvested, and the total RNAs were extracted immediately [21]. The RNA extracts were treated with DNase I to remove DNA and isolate mRNA. Then cDNA was synthesized using the mRNA as templates. During the quantity control steps, Agilent 2100 Bioanaylzer (Agilent Technologies) and ABI StepOnePlus Real-Time PCR System (Life Technologies) were used in quantification and qualification of the sample library. The library was sequenced using Illumina HiSeq 2000 (BGI-Shenzhen, China) [22].
The physical protein-protein interactions (PPPI) networks in LPS-treated S. cerevisiae were constructed using Cytoscape software (http://www.cytoscape.org/) [23], in which related genes' PPPI data was extracted from Saccharomyces Genome Database (SGD, http://www.yeastgenome.org/) derived from BioGRID (http://thebiogrid.org/) with MiMIplugin software (http://apps.cytoscape.org/apps/mimiplugin) [24]. The PPPI networks obtained were analyzed with MCODE software (http://apps.cytoscape.org/apps/mcode) [25], [26] to detect clusters of proteins that represent distinct biologic processes. Major network centralities (node degree and betweenness) were calculated from these networks and clusters using the Cytoscape plugin CentiScaPe 1.0 (http://apps.cytoscape.org/apps/centiscape) [26], [27] to further identify the bottlenecks, which are nodes with values above the threshold and central points in controlling the communication between other nodes within the network [28]. Gene Ontology (GO) clustering analysis was performed using BiNGO software (http://apps.cytoscape.org/apps/bingo) [29] in order to obtain information about the nature and number of sub networks belonging to the network and their associated biological processes. Overrepresented biological process categories were generated after correction with a significance level of 0.05 [26].
Annexin V and Propidium iodide staining
Annexin V and Propidium iodide (PI) staining were performed according to the published method [7], [30]. S. cerevisiae cells were washed with sorbitol buffer (1.2 M sorbitol, 0.5 mM MgCl2, 35 mM potassium phosphate, pH 6.8), incubated at 30°C for 15 min in Tris/DTT buffer (100 mM Tris/Cl, pH 9.4, 10 mM DTT), washed again with sorbitol buffer, and digested at 30°C for 1 h with Zymolyase-20T (MP Biomedicals) in sorbitol buffer. After protoplast formation was observed under light microscopy, cells were harvested, washed with binding buffer (10 mM HEPES, pH 7.4, 140 mM NaCl, 2.5 mM CaCl2, 1.2 M sorbitol), and stained using Annexin-V-Fluos Staining Kit (Roche Diagnostics). To prepare the labeling solution, 20 µL Annexin-V-Fluos labeling reagent was diluted in 1 mL binding buffer and 20 µL PI solutions was added. Around 106 S. cerevisiae cells were centrifuged and resuspended in 100 µL Annexin-V-Fluos labeling solution. After incubation for 10∼15 min in dark at room temperature, 500 µL binding buffer was added for analysis using the BD flow cytometry (BD FACSCalibur, BD Biosciences). 488 nm excitation and 515 nm bandpass filter (FL1) for fluorescein detection and filter >560 nm (FL2) for PI detection were chosen. All assays were performed in triplicate. A mixture containing equal volumes of heat-treated cells and normal cells (50% heat-treated cells) were performed as positive control to assist the set of cross gate in the data analysis. The flow cytometry data were processed using Kaluza Flow Cytometry Software.
Detection of metacaspase activity
Metacaspase activity was detected using FITC-VAD-FMK (Promega) [31], [32]. After LPS treatment, S. cerevisiae cells were washed and resuspended in PBS. 100 µL yeast cells (106 cells) were incubated with 50 µM of FITC-VAD-FMK for 20 min at 30°C in darkness. Then cells were washed once, resuspended in PBS and subsequently analyzed by BD flow cytometer equipped with a 488-nm argon laser. The 525 nm emission signals were detected using the FL1 bandpass filter. The 100% heat-treated cells in PBS were chosen as positive control. Cells without dye addition were performed to set the gate for distinguish negative and positive groups in the data extraction. The flow cytometry data were processed using Kaluza Flow Cytometry Software.
Analysis of mitochondrial membrane potential and reactive oxygen species
Mitochondrial membrane potential (ΔΨm) was determined using Rhodamine 123 (Rh123) (Sigma-Aldrich) staining methods [33]. S. cerevisiae cells were washed twice with PBS, and 1 mL cell suspension (106 cells) was added 1 µL of Rh123 from 50 mM stock solution in ethanol and incubated for 10 min in darkness, and then analyzed using the BD flow cytometry equipped with a 488-nm argon laser. The 525 nm emission signals were detected using the FL1 bandpass filter. The 100% heat-treated cells were chosen here as positive control, and corresponding cells without dye addition was performed to set the gate for negative and positive groups in the data extraction. The flow cytometry data were processed using Kaluza Flow Cytometry Software.
For detecting reactive oxygen species (ROS) production, 1 mL pre-log phase yeast cells (107 cells) were incubated with 20 µM of the fluorescence probe, 2′,7′-dichlorofluorescin diacetate (H2DCFH-DA, Sigma-Aldrich) in YPD for 15 min at 30°C in darkness [8], [34]. The cells were then washed twice with PBS and treated with or without 1.0 mg/mL LPS in PBS (OD600 = 2.0) for 60 min at 30°C in darkness. The flow cytometry analysis was immediately carried out using the BD flow cytometry. 488 nm excitation and 520 nm emission by the FL1 bandpass filter was chosen for 2′,7′-dichlorofluorescein detection. Corresponding cells without dye loading were performed to set the gate for negative and positive groups in the data extraction. The flow cytometry data were processed using Kaluza Flow Cytometry Software.
Results
S. cerevisiae BY4742 cells could be stained by methylene blue after exposure to LPS
Methylene blue, a heterocyclic aromatic chemical compound, can be used as an indicator to determine if yeast cells are alive [18], [35]. Viable yeast cells usually cannot be stained by methylene blue because their membranes cannot be penetrated. The dead or injured yeast cells can be stained because their membranes are damaged and cannot keep the methylene blue from penetrating. In this study, three different methylene blue solutions [18]–[20] were used to stain S. cerevisiae BY4742 cells. At the same methylene blue concentration (3.0 mg/mL), none of the three methylene blue solutions could stain S. cerevisiae BY4742 cells; however, all three methylene blue solutions could stain the LPS-treated BY4742 cells. The staining was pH independent because pH values of the three methylene blue solutions are different. Fig. 1A showed the microscopic pictures of S. cerevisiae BY4742 cells exposed to different concentrations of LPS and stained by Loeffler's alkaline methylene blue solution. The proportion of the cells that could be stained by methylene blue increased with the increase of LPS concentration in the mixture. After exposure to 1.0 mg/mL LPS, around 5×10⁸ S. cerevisiae cells in 1 mL mixture (OD600 = 2.0) could be all stained by methylene blue. The staining of LPS-treated S. cerevisiae BY4742 cells suggests that the cells were either dead or injured after LPS treatment because methylene blue could not penetrate normal cell's membrane.
Figure 1. Effect of LPS stimualtion to S. cerevisiae BY4742.

A. Methylene blue staining of S. cerevisiae BY4742 cells treated with different concentrations of LPS and observed using light microscopy. The solid bars in the photos indicate 10 µm. The concentrations of LPS were listed on top of the photos. B. Drop test showed that S. cerevisiae BY4742 cells treated with 1.0 mg mg/mL LPS were not dead.
To assess the viability of LPS-treated S. cerevisiae BY4742 cells, the cells were serially diluted and dropped on YPD plates, using the untreated cells as control (Fig. 1B). After 3-day incubation, colonies were observed on plates where the LPS-treated cells were dropped, and their numbers were similar to the untreated cells, suggesting that S. cerevisiae BY4742 cells were still alive after exposure to LPS. Moreover, when S. cerevisiae BY4742 cells were incubated in liquid SD media, they could keep growing; the proportion of the cells which could be stained by methylene blue kept stable until 90 min, and then decreased with time. This suggests again that S. cerevisiae BY4742 cells exposed to LPS were not dead but injured, but the injury can be repaired.
LPS exposure caused significant changes in S. cerevisiae BY4742 cells
To gain the insight of LPS stimulation to S. cerevisiae, the transcriptional profling of the S. cerevisiae BY4742 cells with or without LPS treatment for 90 min were analyzed [22]. The transcriptome analysis detected 5431 and 5426 genes from S. cerevisiae BY4742 cells treated with or without LPS treatment, respectively. After exposure to LPS, 2491 genes were up-regulated in S. cerevisiae BY4742 cells and 3254 genes were down-regulated, and 595 genes (460 up-regulated genes and 135 down-regulated genes) were significantly modulated (FDR ≤0.001 and |Log2R| ≥1.0) (Fig. 2). GO analysis was performed to classify the main biological processes associated to these 595 genes. The probability values of the over-abundance of the GO groups compared to the genome average were assessed, and major GO groups with the statistical significance of overrepresented processes (p-value ≤0.05) are listed in Fig. 3. These major GO categories are closely related to cell wall, membrane, lipid, carbohydrate, and oxidation-reduction process. In the categories of antioxidant activity and lipid catabolic process, all related genes were up-regulated, while in categories of cell wall and membrane, both up-regulated and down-regulated genes were observed. These gene regulations related to cell wall and membrane might change the stability or permeability of the cell; therefore, methylene blue could penetrate and stain the cells (Fig. 1A). Regulations on cell wall, membrane, and antioxidant activity are usually related to stress response; therefore, transcriptional levels of genes in GO categories with less statistical significance (p-value >0.05) but closely related to stress responses are listed in Table S4. There are 69 genes involved in peroxisome, and 15 of them were up-regulated, suggesting that the function of peroxisome increased after LPS stimulation. Mitochondria were also affected after LPS stimulation, but more genes related to its outer membrane and intermembrane space were up-regulated than to its inner membrane (Table S4). Some genes related to protein folding, autophagy, endocytosis, and apoptosis were up-regulated after LPS stimulation, suggesting that cell injure might occur. Interestingly, 27 genes related to ribosome biogenesis were down-regulated after LPS stimulation, suggesting protein syntheses were repressed in the cells (Table S4). Autophagy usually involves degradation pathways including peroxisome degradation [10], while apoptosis always leads to cell death [3], [4]. Peroxisome and mitochondrial function are associated with antioxidant activity [36]. Apart from GO analysis, significantly enriched items of KEGG pathway also provided information about basal metabolism such as peroxisome metabolism (Fig. 3B). The data indicate that LPS stimulation caused a series of regulations in S. cerevisiae BY4742, involving cell wall, membrane, peroxisome and mitochondria.
Figure 2. Number of differentially expressed genes regulated in S. cerevisiae BY4742 cells treated with LPS (LPS+) according to transcriptome analysis.
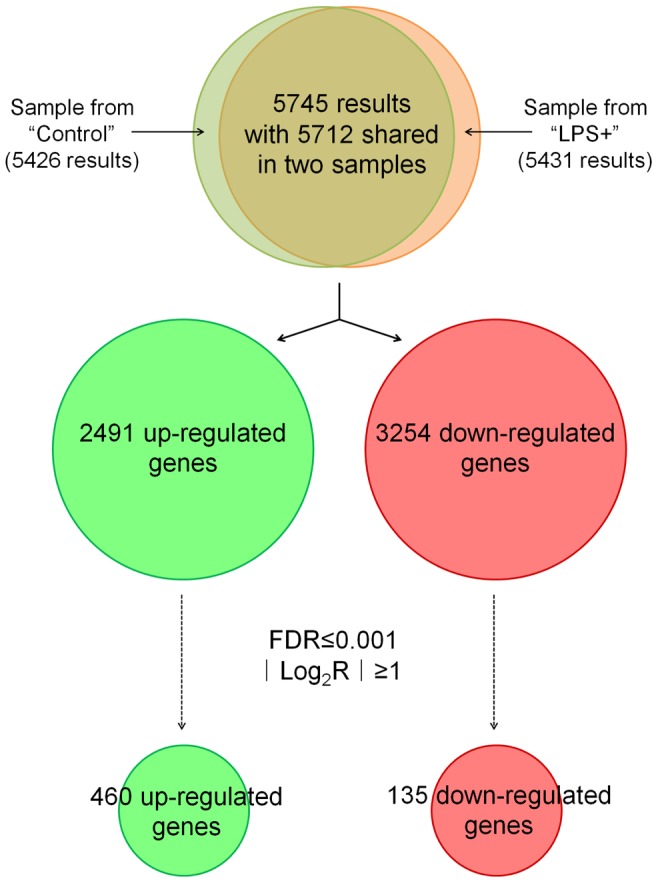
FDR stands for False Discovery Rate [51]. Log2R represents Log2 of the ratio of the gene expression difference of a gene in “LPS+” samples versus the same gene in “Control” sample.
Figure 3. Analysis of Gene Ontology and KEGG pathway.

Only the significantly enriched GO categories (A) or KEGG items (B) (p-value ≤0.05) in differentially expressed genes were shown. Blue and red bars represent up-regulated and down-regulated genes in LPS-treated cells compared to control, respectively. The percentage represents the ratio of genes within the genome in each category. The number of genes contained in each item is shown in brackets following the item names.
To understand how LPS stimulation affects biological processes in S. cerevisiae BY4742, two PPPI networks were retrieved from SGD using the transcriptome data: one associated to the 460 induced genes (367 genes were picked up) and the other associated to the 135 repressed genes (108 genes were picked up) (Fig. 4). The induced genes-associated network contains 2,651 nodes and 5,107 connectors (Fig. 4A), and the repressed genes-associated network contains 1,653 nodes and 3,660 connectors (Fig. 4B). Nodes represent proteins encoded by the corresponding genes in the network, and connectors are introduced to represent interactions among the proteins encoded by the differentially expressed genes. Clusters present in both PPPI networks were identified and retrieved using MCODE, and subjected to GO analysis; there were 8 clusters extracted from the induced genes-associated network (Table S1) and 11 clusters obtained from the repressed genes-associated network (Table S2). Moreover, there were 23 biological processes associated to more than 10 clusters (Table 1), including response to stress, signal transduction, chromosome, transcription, ribosome biogenesis, enzyme regulator activity and cell cycle. This suggests that LPS stimulation caused a series of responses in different biological processes from chromosome segregation to protein modification process. To identify nodes and the consequent biological processes that have a relevant important position in the overall network architecture, the centrality analysis of both networks and their clusters were performed using CentiScaPe; there were 26 and 27 bottlenecks, the key nodes with high values of nodes degree and betweeness, identified from the induced and repressed genes-associated networks, respectively (Table S3).
Figure 4. PPPI networks generated from the induced genes (A) and the repressed genes (B).

Green nodes indicate proteins encoded by the induced genes, while red nodes represent proteins encoded by the repressed genes. Red lines indicate the interactions among proteins encoded by differentially expressed genes.
Table 1. Major specific gene ontology categories shared by more than 10 clusters derived from the induced and repressed genes-associated networks.
| Description | Total cluster numbers | Induced genes related | repressed genes related |
| response to stress | 12 | 5 | 7 |
| signal transduction | 12 | 5 | 7 |
| chromosome | 14 | 5 | 9 |
| chromosome organization | 16 | 7 | 9 |
| chromosome segregation | 12 | 4 | 8 |
| helicase activity | 10 | 1 | 9 |
| nucleus | 16 | 6 | 10 |
| nucleolus | 12 | 4 | 8 |
| DNA metabolic process | 12 | 4 | 8 |
| DNA binding | 14 | 5 | 9 |
| transcription | 17 | 8 | 9 |
| transcription regulator activity | 15 | 6 | 9 |
| RNA metabolic process | 16 | 6 | 10 |
| ribosome biogenesis | 12 | 4 | 8 |
| cell cycle | 14 | 6 | 8 |
| cytoskeleton | 13 | 7 | 6 |
| cytoskeleton organization | 14 | 7 | 7 |
| endoplasmic reticulum | 12 | 7 | 5 |
| endomembrane system | 11 | 8 | 3 |
| protein modification process | 16 | 7 | 9 |
| protein complex biogenesis | 10 | 5 | 5 |
| protein binding | 13 | 6 | 7 |
| enzyme regulator activity | 10 | 3 | 7 |
Since there are over 4,000 phosphorylation events involved in yeast [37], changes in protein phosphorylation (PP) network of S. cerevisiae BY4742 cells after exposure to LPS might provide new information on the mechanism. Therefore, the PP network was analyzed using more gene expression data (|Log2R| ≥0.5) and cluster analysis was performed as before (Fig. 5). Two clusters (Cluster 1 and Cluster 2) were sub graphed, and their central bottlenecks were ATG1 and TPK1, respectively (Fig. 5). ATG1 encodes a kinase required for vesicle formation in autophagy and the cytoplasm-to-vacuole targeting pathway, while TPK1 encodes the catalytic subunit of the cAMP-dependent protein kinase that promotes vegetative growth in response to nutrients via the Ras-cAMP signaling pathway (SGD, Table S3). These two protein phosphorylation signaling pathways provide possible activated points during the cell exposure to LPS.
Figure 5. Protein phosphorylation network generated from the induced genes and the repressed genes, and its MCODE and CentiScaPe analyses.
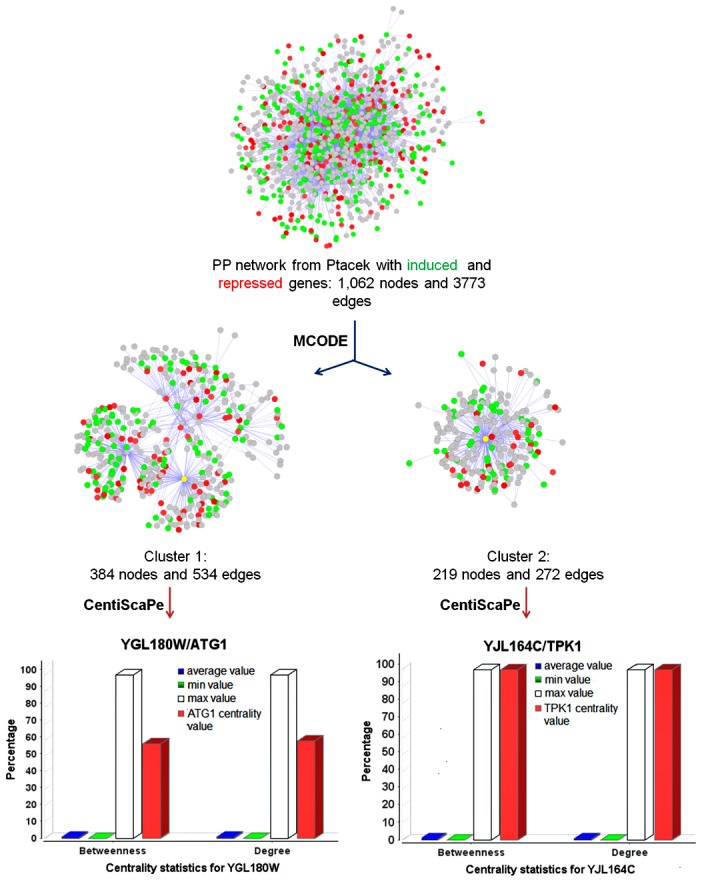
Green nodes indicate proteins encoded by the induced genes, while red nodes represent proteins encoded by the repressed genes. Deep colored nodes are associated to genes with |Log2R| ≥1.0 while light colored nodes are associated to genes with 0.5≤ |Log2R| ≤1.0. Yellow nodes indicate Atg1p and Tpk1p in Cluster1 and Cluster 2, respectively. Corresponding centrality values in betweeness and nodes degree were sub graphed according to the importance of selected nodes or bottlenecks. Edges represent interactions between proteins or nodes.
RT-PCR of some key genes in S. cerevisiae BY4742 and methylene blue staining of S. cerevisiae BY4743 mutants after LPS treatment
To confirm the regulation information obtained by the transcriptome analysis, a few key genes were chosen to be analyzed by RT-PCR. The overall results from RT-PCR are consistent with those obtained by transcriptome analysis. In both RT-PCR and transcriptome analysis, genes SMP1, YPR145C HSP26, GND2, HSP32 and GPD1 were found up-regulated, while genes MA(α)2 and CWP1 were down-regulated (Fig. 6A). The transcriptional levels of a gene might depend on the time of cell growth and LPS treatment. For example, the transcriptional levels of HOG1 and GPD1 in S. cerevisiae BY4742 cells treated with LPS for 90 min were larger than those treated with LPS for 180 min (Fig. 6A).
Figure 6.

A. Comparison of transcriptional levels of some key genes in LPS-treated S. cerevisiae BY4742 cells analyzed by RT-PCR and transcriptome, respectively. B. Methylene blue staining of some single gene deletion mutants of S. cerevisiae BY4743 after LPS treatment. According to the transcriptome analysis, genes whose transcriptional level did not significantly change in S. cerevisiae BY4742 after LPS treatment were labeled with star symbol (*); transcriptional levels for the other genes could be found in Table S4.
To investigate the mechanism of the response of S. cerevisiae to LPS stimulation, some mutants of S. cerevisiae BY4743 were treated with LPS and stained by methylene blue (Fig. 6B). These mutants are all single gene deletion ones. These genes, including apoptosis or autophagy related genes YCA1, NDI1, ATG1 and ATG8, were chosen based on the transcriptome analysis of S. cerevisiae BY4742 treated with LPS. Surprisingly, after treatment with LPS most of the mutants could be stained by methylene blue, suggesting that the response of S. cerevisiae to LPS stimulation is a complex process, and individually deletion of these genes could not stop the response. For example, ATG1 mutant of S. cerevisiae BY4743 treated with LPS could be stained by methylene blue although ATG1 is one of the major bottlenecks in PP network.
LPS treatment caused phosphatidylserine exposure and mitochondrial membrane potential increase in S. cerevisiae BY4742 cells
All cells are separated from the extracellular environment by the membrane, a phospholipid bilayer. In eukaryotic cells, the lipid composition of the outer and inner leaflets of the membrane is not symmetrical. Phosphatidylserine is restricted to the inner leaflet of the membrane, and the exposure of phosphatidylserine to the outer leaflet of the membrane is a classic feature of apoptotic cells and acts as an “eat me” signal allowing phagocytosis [3], [30]. Since the transcriptome analysis showed that many modulated genes in S. cerevisiae BY4742 cells treated with LPS were related to cell response (Table S4), FITC-labeled Annexin V was used to detect the exposure of phosphatidylserine in the cells [30], using 50% heat-treated dead cells as positive control [38]. About 57.0% population of LPS-treated S. cerevisiae BY4742 cells showed similar pattern to the major population of untreated cells (89.0%), but 36.8% population of LPS-treated cells showed different patterns either from the untreated cells or the heat-treated dead cells (Fig. 7), suggesting that this 36.8% population of LPS-treated S. cerevisiae BY4742 cells were injured but not dead. The membrane integrity was tested by staining with propidium iodide [30]. Propidium iodide could be taken up by 43.7% of the heat-treated cells, but only by 5.8% of the LPS-treated cells and 0.3% of the untreated S. cerevisiae BY4742 cells, respectively (Fig. 7). This suggests that after LPS stimulation the cell membranes of S. cerevisiae BY4742 might be slightly injured for signal transduction but not damaged as that of the heat-treated cells, and also explains the methylene blue staining and the viability of S. cerevisiae BY4742 cells after exposure to LPS.
Figure 7. Flow cytometry analysis of LPS-treated S. cerevisiae BY4742 cells stained by Annexin-V-FITC and PI.
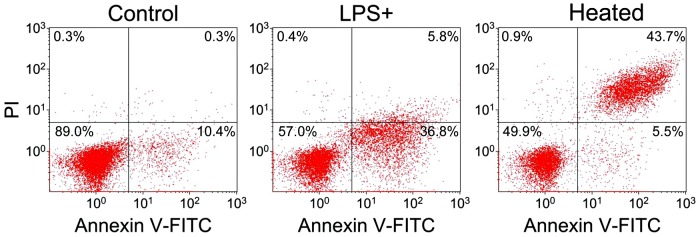
Untreated cells were used as blank control (Control) and 50% heat-treated dead cells were used as positive control (Heated). The cross gate, in order to show the stained proportions, was set by both blank control and positive control.
Since mitochondria are preferential targets for various stresses in S. cerevisiae [3], mitochondrial function or integrity in S. cerevisiae BY4742 cells treated with LPS was assessed by staining with Rh123 [33]. Rh123 can distribute into the mitochondrial matrix in response to ΔΨm. The untreated cells and heat-treated S. cerevisiae cells were used as the negative and positive controls, respectively. As shown in Fig. 8, about half of the LPS-treated S. cerevisiae BY4742 cells had similar ΔΨm to the heat-treated cells. This increase of ΔΨm in LPS-treated S. cerevisiae cells might be due to many factors such as the inhibition of ATP synthase [36], [39].
Figure 8. Assessment of mitochondrial membrane potential in LPS-treated S. cerevisiae BY4742 cells, using flow cytometry.
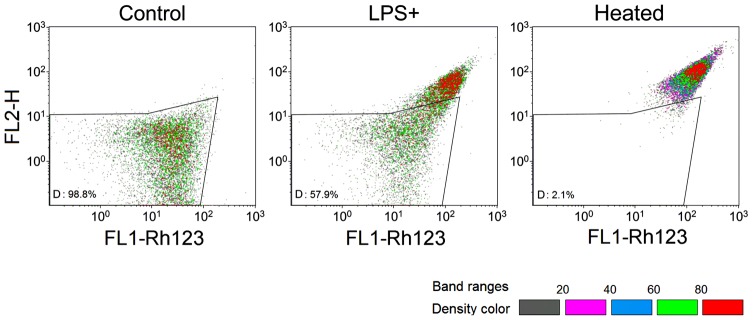
Rh123 was used to stain the untreated (Control), LPS-treated (LPS+) and 100% heat-treated cells (Heated). The result was represented by density banding coloring. Gray dots represent the lowest density, while red dots represent the highest density. The gate set “G” was used to show the differences among the three experiments.
LPS treatment did not affect the ROS level and metacaspase activation in S. cerevisiae BY4742 cells
ROS level in LPS-treated S. cerevisiae BY4742 cells was analyzed by staining with H2DCFH-DA [34]. H2DCFH-DA can be hydrolyzed by esterase to produce 2′,7′-dichlorofluorescin, which is then oxidized by ROS to form the fluorescent 2′,7′-dichlorofluorescein. The ROS levels in the majority of LPS-treated S. cerevisiae BY4742 cells were similar to the untreated cells (Fig. 9), indicating the ROS stability in LPS-treated S. cerevisiae BY4742 cells.
Figure 9. Detection of ROS accumulation in LPS-treated S. cerevisiae BY4742 cells, using flow cytometry.

H2DCFH-DA was used to stain the untreated (Control) and LPS-treated cells (LPS+). The result was represented by density banding coloring. Gray dots represent the lowest density, while red dots represent the highest density. The gate “E” was set by corresponding dye-unloading samples. FL1-DCF represents 2′,7′-dichlorofluorescein while FL2-H assists for data display. The majority populations (red dots) from both samples shew similar ROS levels.
Metacaspase activation in LPS-treated S. cerevisiae BY4742 cells was detected by staining with FITC-VAD-FMK and analyzed by flow cytometry [31], [32]. The population distribution pattern of LPS-treated S. cerevisiae BY4742 cells was similar to the untreated cells (Fig. 10), suggesting the metacaspase activation in S. cerevisiae BY4742 cells was not affected by LPS treatment. This is consistent with the finding in transcriptome analysis that the transcriptional level of YCA1, the key gene encoding metacaspase in S. cerevisiae BY4742 cells, did not significantly change after LPS treatment [40].
Figure 10. Analysis of metacaspase activity of LPS-treated S. cerevisiae BY4742 cells by flow cytometry.
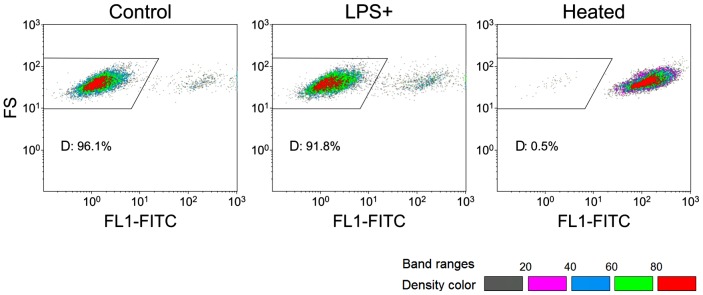
FITC-VAD-FMK was used to detect metacaspace activation. Untreated S. cerevisiae BY4742 cells were used as negative control; 100% heat-treated cells were chosen as positive control. The result was represented by density banding coloring. Gray dots represent the lowest density, while red dots represent the highest density. The gate “D” was set to show the differences among the three types of cells. FL1-FITC represents FITC-VAD-FMK while FS assists for data display.
Discussion
To survive under different stresses in the environment, microorganisms have developed a variety of mechanisms to give specific and adaptive responses. In response to stresses, S. cerevisiae could regulate different biological processes in the cell [6]–[8], [41], [42], involving phosphatidylserine, mitochondrial membrane, ROS and nucleus [3], [43]. For example, pheromone stress can induce phosphatidylserine externalization and cause the hyperpolarization of mitochondrial membrane (the elevation of ΔΨm), the ROS production, and then the fragmentation of mitochondria (the decrease of ΔΨm) and the release of cytochrome c to finally induce cell death [41]. The decreased ΔΨm and increased ROS production in yeast were also observed in response to aspirin, rapamycin, osmotin or formic acid [7], [8], [44], [45].
Phosphatidylserine exposure and enhanced ΔΨm were observed in LPS-treated S. cerevisiae cells, but ROS production and metacaspase activation did not change (Fig. 7–10). This indicates that LPS stimulation did change some biological processes, but did not cause cell death. Activated antioxidant activity (Fig. 3) might be the reason for the stability of ROS, while the repressed ribosome biogenesis (Table S4) could save energy to be used for removing harmful substances. Enhanced mitochondrial function should be important for energy production and ROS removal, associated to the exchange with peroxisomes undergoing β-oxidation for ROS transport or energy reserve. Because ROS stability was controlled, LPS-treated S. cerevisiae cells could survive and be recovered after LPS removal or dilution. Autophagy process might occur in LPS-treated S. cerevisiae cells, because 10 ATGs (Table S4) were up-regulated after LPS stimulation, and Atg1p, the protein kinase required for vesicle formation in autophagy, was a central point in both the PP network and the induced genes-associated PPPI network (Fig. 5 and Table S3). Various protein folding or degradation underwent at the same time, such as assisted by chaperones via vesicles, to renovate the intracellular environment for survival (Table S4). More information about the differentially expressed genes in LPS-treated S. cerevisiae cells is listed in Table S5.
Since yeast cells live in the same environment with other microorganisms including LPS-containing bacteria, they might have evolved mechanisms to sense and adapt to the presence of LPS. Response of S. cerevisiae to LPS found in this study might be important for investigating yeast evolution to cope with the environment. Because other microorganisms could recognize and interact with LPS [46], [47], LPS-containing bacteria have also evolved mechanisms to change their LPS structure [48]–[50]. Further work should be done to answer the following questions: Which parts of LPS can stimulate yeast? Is there a sensor in the membrane of yeast to recognize LPS? What is the signal transduction pathway in yeast cells after LPS stimulation? Such study might contribute to understand the LPS recognition by other eukaryotic cells.
Supporting Information
Main specific gene ontology categories observed in clusters (MCODE Score >3.0) derived from the induced genes-associated network.
(DOC)
Main specific gene ontology categories observed in clusters (MCODE Score >3.0) derived from the repressed genes-associated network.
(DOC)
Selected bottleneck nodes with different gene expression (|Log2R| ≥1.0) observed in networks.
(DOC)
Details of genes extracted from Gene Ontology analysis and their classification from the description in SGD.
(DOC)
Other Genes with the expression ratio of Log2 more than 2 or less than -0.5 found in LPS-treated S. cerevisiae BY4742 cells.
(DOC)
Acknowledgments
We thank the support from National Key Basic Research Program of China and National Natural Science Foundation of China.
Data Availability
The authors confirm that all data underlying the findings are fully available without restriction. All relevant data are within the paper and its Supporting Information files.
Funding Statement
This study was supported by the National Key Basic Research Program of China (2012CB725202) and the National Natural Science Foundation of China (31170069). The funders had no role in study design, data collection and analysis, decision to publish, or preparation of the manuscript.
References
- 1. Galluzzi L, Vitale I, Abrams JM, Alnemri ES, Baehrecke EH, et al. (2012) Molecular definitions of cell death subroutines: recommendations of the Nomenclature Committee on Cell Death 2012. Cell Death Differ 19: 107–120. [DOI] [PMC free article] [PubMed] [Google Scholar]
- 2. Madeo F, Herker E, Wissing S, Jungwirth H, Eisenberg T, et al. (2004) Apoptosis in yeast. Curr Opin Microbiol 7: 655–660. [DOI] [PubMed] [Google Scholar]
- 3. Carmona-Gutierrez D, Eisenberg T, Buttner S, Meisinger C, Kroemer G, et al. (2010) Apoptosis in yeast: triggers, pathways, subroutines. Cell Death Differ 17: 763–773. [DOI] [PubMed] [Google Scholar]
- 4. Buttner S, Eisenberg T, Herker E, Carmona-Gutierrez D, Kroemer G, et al. (2006) Why yeast cells can undergo apoptosis: death in times of peace, love, and war. J Cell Biol 175: 521–525. [DOI] [PMC free article] [PubMed] [Google Scholar]
- 5. Morano KA, Grant CM, Moye-Rowley WS (2012) The response to heat shock and oxidative stress in Saccharomyces cerevisiae . Genetics 190: 1157–1195. [DOI] [PMC free article] [PubMed] [Google Scholar]
- 6. Narasimhan ML, Damsz B, Coca MA, Ibeas JI, Yun DJ, et al. (2001) A plant defense response effector induces microbial apoptosis. Mol Cell 8: 921–30. [DOI] [PubMed] [Google Scholar]
- 7. Balzan R, Sapienza K, Galea DR, Vassallo N, Frey H, et al. (2004) Aspirin commits yeast cells to apoptosis depending on carbon source. Microbiology 150: 109–115. [DOI] [PubMed] [Google Scholar]
- 8. Du L, Su Y, Sun D, Zhu W, Wang J, et al. (2008) Formic acid induces Yca1p-independent apoptosis-like cell death in the yeast Saccharomyces cerevisiae . FEMS Yeast Res 8: 531–539. [DOI] [PubMed] [Google Scholar]
- 9. Loewith R, Jacinto E, Wullschleger S, Lorberg A, Crespo JL (2002) Two TOR complexes, only one of which is rapamycin sensitive, have distinct roles in cell growth control. Mol Cell 10: 457–468. [DOI] [PubMed] [Google Scholar]
- 10. Abeliovich H, Klionsky DJ (2001) Autophagy in yeast: mechanistic insights and physiological function. Microbiol Mol Biol Rev 65: 463–479. [DOI] [PMC free article] [PubMed] [Google Scholar]
- 11. Dziedzic SA, Caplan AB (2012) Autophagy proteins play cytoprotective and cytocidal roles in leucine starvation-induced cell death in Saccharomyces cerevisiae . Autophagy 8: 731–738. [DOI] [PMC free article] [PubMed] [Google Scholar]
- 12. Raetz CR, Whitfield C (2002) Lipopolysaccharide endotoxins. Annu Rev Biochem 71: 635–700. [DOI] [PMC free article] [PubMed] [Google Scholar]
- 13. Wang X, Quinn PJ (2010) Endotoxins: lipopolysaccharides of gram-negative bacteria. Subcell Biochem 53: 3–25. [DOI] [PubMed] [Google Scholar]
- 14. Wright SD, Ramos RA, Tobias PS, Ulevitch RJ, Mathison JC (1990) CD14, a receptor for complexes of lipopolysaccharide (LPS) and LPS binding protein. Science 249: 1431–1433. [DOI] [PubMed] [Google Scholar]
- 15. Karima R, Matsumoto S, Higashi H, Matsushima K (1999) The molecular pathogenesis of endotoxic shock and organ failure. Mol Med Today 5: 123–132. [DOI] [PubMed] [Google Scholar]
- 16. Beutler B, Rietschel ET (2003) Innate immune sensing and its roots: the story of endotoxin. Nat Rev Immunol 3: 169–176. [DOI] [PubMed] [Google Scholar]
- 17. Marques JM, Rodrigues RJ, de Magalhães-Sant'Ana AC, Gonçalves T (2006) Saccharomyces cerevisiae Hog1 protein phosphorylation upon exposure to bacterial endotoxin. J Biol Chem 281: 24687–24694. [DOI] [PubMed] [Google Scholar]
- 18. Painting K, Kirsop B (1990) A quick method for estimating the percentage of viable cells in a yeast population, using methylene blue staining. World J Microbiol Biotechnol 6: 346–347. [DOI] [PubMed] [Google Scholar]
- 19. Misra V, Misra SP, Dwivedi M, Gupta SC (1994) The Loeffler's methylene blue stain: An inexpensive and rapid method for detection of Helicobacter pylori . J Gastroenterol Hepatol 9: 512–513. [DOI] [PubMed] [Google Scholar]
- 20. Vairo ML (1961) Methylene blue solutions for staining dead yeast cells. Stain Technol 36: 329–330. [DOI] [PubMed] [Google Scholar]
- 21. Shi F, Zhan W, Li Y, Wang X (2014) Temperature influences β-carotene production in recombinant Saccharomyces cerevisiae expressing carotenogenic genes from Phaffia rhodozyma . World J Microbiol Biotechnol 30: 125–133. [DOI] [PubMed] [Google Scholar]
- 22. Zhu Z, Zhang S, Liu H, Shen H, Lin X, et al. (2012) A multi-omic map of the lipid-producing yeast Rhodosporidium toruloides . Nat Commun 3: 1112. [DOI] [PMC free article] [PubMed] [Google Scholar]
- 23. Shannon P, Markiel A, Ozier O, Baliga NS, Wang JT, et al. (2003) Cytoscape: a software environment for integrated models of biomolecular interaction networks. Genome Res 13: 2498–2504. [DOI] [PMC free article] [PubMed] [Google Scholar]
- 24. Gao J, Ade AS, Tarcea VG, Weymouth TE, Mirel BR, et al. (2009) Integrating and annotating the interactome using the MiMI plugin for cytoscape. Bioinformatics 25: 137–138. [DOI] [PMC free article] [PubMed] [Google Scholar]
- 25. Bader GD, Hogue CW (2003) An automated method for finding molecular complexes in large protein interaction networks. BMC Bioinformatics 4: 2. [DOI] [PMC free article] [PubMed] [Google Scholar]
- 26. de Castro PA, Savoldi M, Bonatto D, Malavazi I, Goldman MH, et al. (2012) Transcriptional profiling of Saccharomyces cerevisiae exposed to propolis. BMC Complement Altern Med 12: 194. [DOI] [PMC free article] [PubMed] [Google Scholar]
- 27. Scardoni G, Petterlini M, Laudanna C (2009) Analyzing biological network parameters with CentiScaPe. Bioinformatics 25: 2857–2859. [DOI] [PMC free article] [PubMed] [Google Scholar]
- 28. Yu H, Kim PM, Sprecher E, Trifonov V, Gerstein M (2007) The importance of bottlenecks in protein networks: correlation with gene essentiality and expression dynamics. PLoS Comput Biol 3: e59. [DOI] [PMC free article] [PubMed] [Google Scholar]
- 29. Maere S, Heymans K, Kuiper M (2005) BiNGO: a Cytoscape plugin to assess overrepresentation of gene ontology categories in biological networks. Bioinformatics 21: 3448–3449. [DOI] [PubMed] [Google Scholar]
- 30. Madeo F, Fröhlich E, Fröhlich KU (1997) A yeast mutant showing diagnostic markers of early and late apoptosis. J Cell Biol 139: 729–734. [DOI] [PMC free article] [PubMed] [Google Scholar]
- 31. Madeo F, Herker E, Maldener C, Wissing S, Lächelt S, et al. (2002) A caspase-related protease regulates apoptosis in yeast. Mol Cell 9: 911–917. [DOI] [PubMed] [Google Scholar]
- 32. Silva RD, Sotoca R, Johansson B, Ludovico P, Sansonetty F, et al. (2005) Hyperosmotic stress induces metacaspase- and mitochondria-dependent apoptosis in Saccharomyces cerevisiae . Mol Microbiol 58: 824–834. [DOI] [PubMed] [Google Scholar]
- 33. Ludovico P, Sansonetty F, Côrte-Real M (2001) Assessment of mitochondrial membrane potential in yeast cell populations by flow cytometry. Microbiology 147: 3335–3343. [DOI] [PubMed] [Google Scholar]
- 34. Jakubowski W, Bartosz G (2000) 2,7-dichlorofluorescin oxidation and reactive oxygen species: what does it measure?. Cell Biol Int 24: 757–760. [DOI] [PubMed] [Google Scholar]
- 35. Sami M, Ikeda M, Yabuuchi S (1994) Evaluation of the alkaline methylene blue staining method for yeast activity determination. J Ferment Bioeng 78: 212–216. [Google Scholar]
- 36. Gomes LC, Di Benedetto G, Scorrano L (2011) During autophagy mitochondria elongate, are spared from degradation and sustain cell viability. Nat Cell Biol 13: 589–598. [DOI] [PMC free article] [PubMed] [Google Scholar]
- 37. Ptacek J, Devgan G, Michaud G, Zhu H, Zhu X, et al. (2005) Global analysis of protein phosphorylation in yeast. Nature 438: 679–684. [DOI] [PubMed] [Google Scholar]
- 38. Nicolet CM, Craig EA (1991) Inducing and assaying heat-shock response in Saccharomyces cerevisiae . Methods Enzymol 194: 710–717. [DOI] [PubMed] [Google Scholar]
- 39. de Gann FMP, Belaud-Rotureau MA, Voisin P, Leducq N, Belloc F, et al. (1998) Flow cytometric analysis of mitochondrial activity in situ:application to acetylceramide-induced mitochondrial swelling and apoptosis. Cytometry 33: 333–339. [PubMed] [Google Scholar]
- 40. Madeo F, Herker E, Maldener C, Wissing S, Lächelt S, et al. (2002) A caspase-related protease regulates apoptosis in yeast. Mol Cell 9: 911–917. [DOI] [PubMed] [Google Scholar]
- 41. Pozniakovsky AI, Knorre D A, Markova OV, Hyman AA, Skulachev VP, et al. (2005) Role of mitochondria in the pheromone-and amiodarone-induced programmed death of yeast. J Cell Biol 168: 257–269. [DOI] [PMC free article] [PubMed] [Google Scholar]
- 42. Almeida B, Sampaio-Marques B, Carvalho J, Silva MT, Leão C, et al. (2007) An atypical active cell death process underlies the fungicidal activity of ciclopirox olamine against the yeast Saccharomyces cerevisiae . FEMS Yeast Res 7: 404–412. [DOI] [PubMed] [Google Scholar]
- 43. Wloch-Salamon DM, Bem AE (2013) Types of cell death and methods of their detection in yeast Saccharomyces cerevisiae . J Appl Microbiol 114: 287–98. [DOI] [PubMed] [Google Scholar]
- 44. Alvers AL, Wood MS, Hu D, Kaywell AC, Dunn WA Jr, et al. (2009) Autophagy is required for extension of yeast chronological life span by rapamycin. Autophagy 5: 847–849. [DOI] [PMC free article] [PubMed] [Google Scholar]
- 45. Kissova I, Deffieu M, Samokhvalov V, Velours G, Bessoule JJ, et al. (2006) Lipid oxidation and autophagy in yeast. Free Radic Biol Med 41: 1655–1661. [DOI] [PubMed] [Google Scholar]
- 46. Buts JP, Dekeyser N, Stilmant C, Delem E, Smets F, et al. (2006) Saccharomyces boulardii produces in rat small intestine a novel protein phosphatase that inhibits Escherichia coli endotoxin by dephosphorylation. Pediatr Res 60: 24–29. [DOI] [PubMed] [Google Scholar]
- 47. Park MS, Kim MJ, Ji GE (2007) Assessment of lipopolysaccharide-binding activity of Bifidobacterium and its relationship with cell surface hydrophobicity, autoaggregation, and inhibition of interleukin-8 production. J Microbiol Biotechnol 17: 1120–1126. [PubMed] [Google Scholar]
- 48. Wang X, Quinn PJ (2010) Lipopolysaccharide: biosynthetic pathway and structure modification. Prog Lipid Res 49: 97–107. [DOI] [PubMed] [Google Scholar]
- 49. Cai L, Li Y, Tao G, Guo W, Zhang C, et al. (2013) Identification of three genes encoding for the late acyltransferases of lipid A in Cronobacter sakazakii. Mar Drugs 11: 377–386. [DOI] [PMC free article] [PubMed] [Google Scholar]
- 50. Wang X, Ribeiro AA, Guan Z, Raetz CRH (2009) Identification of undecaprenyl phosphate-β-D-galactosamine in Francisella novicida and its function in lipid A modification. Biochemistry 48: 1162–1172. [DOI] [PMC free article] [PubMed] [Google Scholar]
- 51. Benjamini Y, Yekutieli D (2001) The control of the false discovery rate in multiple testing under dependency. Ann Stat 29: 1165–1188. [Google Scholar]
Associated Data
This section collects any data citations, data availability statements, or supplementary materials included in this article.
Supplementary Materials
Main specific gene ontology categories observed in clusters (MCODE Score >3.0) derived from the induced genes-associated network.
(DOC)
Main specific gene ontology categories observed in clusters (MCODE Score >3.0) derived from the repressed genes-associated network.
(DOC)
Selected bottleneck nodes with different gene expression (|Log2R| ≥1.0) observed in networks.
(DOC)
Details of genes extracted from Gene Ontology analysis and their classification from the description in SGD.
(DOC)
Other Genes with the expression ratio of Log2 more than 2 or less than -0.5 found in LPS-treated S. cerevisiae BY4742 cells.
(DOC)
Data Availability Statement
The authors confirm that all data underlying the findings are fully available without restriction. All relevant data are within the paper and its Supporting Information files.