

Abstract
Breast cancer is one of the most common cancers among the women around the world. Several genes are known to be responsible for conferring the susceptibility to breast cancer. Among them, TP53 is one of the major genetic risk factor which is known to be mutated in many of the breast tumor types. TP53 mutations in breast cancer are known to be related to a poor prognosis and chemo resistance. This renders them as a promising molecular target for the treatment of breast cancer. In this study, we present a computational based screening and molecular dynamic simulation of breast cancer associated deleterious non-synonymous single nucleotide polymorphisms in TP53. We have predicted three deleterious coding non-synonymous single nucleotide polymorphisms rs11540654 (R110P), rs17849781 (P278A) and rs28934874 (P151T) in TP53 with a phenotype in breast tumors using computational tools SIFT, Polyphen-2 and MutDB. We have performed molecular dynamics simulations to study the structural and dynamic effects of these TP53 mutations in comparison to the wild-type protein. Results from our simulations revealed a detailed consequence of the mutations on the p53 DNA-binding core domain that may provide insight for therapeutic approaches in breast cancer.
Introduction
One of the common malignancies and leading causes of cancer death faced by women around the world is breast cancer. Globally, the death rate of breast cancer has been rising around 2.5 lakhs in 1980 to 4.25 lakhs in 2010 [1]. Even in countries like China and India, its incidence is increased around 30% over the last decade whereas in Japan, Korea and Singapore it was doubled or even tripled [2]. According to National Cancer Institute (USA) statistics, estimated new cases of breast cancer in United States for the year 2013 is 232,340 in female and 2,240 in male whereas estimated breast cancer deaths are 39,620 in female and 410 in male. Some of the common risk factors for breast cancer can be broadly categorized into two types i.e., genetic and non genetic. Among these two risk factors, genetic risk factors constitute 5–10% of the breast cancer cases. Studies showed that fifty one variants in 40 genes are significantly associated with breast cancer risk and among them variants in six genes i.e., BRCA1, BRCA2, TP53, PTEN, STK11 and CDH1 show strong association whereas variants in four genes i.e., ATM, CHEK2, BRIP1, PALB2 show moderate association and approximately 20 variants in other genes show weak association [3], [4].
Among the genes conferring high breast cancer risk, TP53 is known to be mutated in 30% of the breast cancers cases with a higher frequency in some tumor subtypes [5]. TP53 encodes p53, which is one of the most important tumor suppressor proteins in human cancers. p53 is a multi domain protein with 393 residues containing i) an acidic N-terminal transcription activation domain (1–44); ii) a proline-rich regulatory domain (62–94); iii) a central sequence-specific well conserved DNA-binding domain (110–292); iv) an oligomerization domain (325–363) and v) a C-terminal domain containing multiple regulatory signals (363–393) [6]. It functions as a tetramer. It is reported that 75% of all the mutations in TP53 are missense, resulting in the substitution of a single amino acid with another and these mutations are predominantly distributed in the exons 4–9, encoding the DNA-binding domain of the protein [7].
Understanding how these single nucleotide polymorphisms (SNPs) affect the function of proteins is an important area of research and an efficient identification of such SNPs would be useful for SNP selection in genetic studies to understand the molecular basis of disease and predicting the effects of in vitro and in vivo mutagenesis experiments [8]. Among the SNPs, non-synonymous coding SNPs (nSNPs) are the one which are located in the coding regions resulting in an amino acid variation in the protein products of genes. They are believed to have a high impact on the phenotype [9]. In the present study, we have focused on the nSNPs in the coding region of TP53 gene having an impact on breast cancer phenotype. We have explored the possible relationship between genetic mutation and phenotypic variation using different computational algorithm tools SIFT, PolyPhen-2 and Mutdb for prioritizing the deleterious breast cancer associated nSNPs from dbSNP datasets.
Molecular dynamics simulation (MDS) on the other hand is an important tool for understanding the effect of mutations on the protein structure, as it provides the information about the protein at atomic level on a reasonable time scale. Previously, several studies have utilized molecular dynamics to analyze the impact of mutations on TP53 [10]–[14]. In order to check (i) whether the three mutants (R110P, P151T and P278A) have an impact on the conformation in the functionally significant regions of the p53C? (ii) Whether the mutant structures are deviating from the native p53C? (iii) Whether the mutants are changing the flexibility of the p53C? we have performed molecular dynamics simulations of WT and three mutants. Since, a significant fraction of p53 appears in apo state at physiological temperature and insufficient zinc is linked to misfolding, particularly in tumorigenic mutations, we performed both apo (Zinc-free state) and holo simulations and are presented here. Results showed that three mutants R110P, P151T and P278A are known to confer deleterious effect in the p53 DNA-binding core domain region (p53C). Overall, the objective of our study is to predict the breast cancer associated nSNPs and to further reveal the conformational flexibility of mutated apo and holo p53C through extensive molecular dynamic simulation.
Materials and Methods
Datasets
TP53 SNPs were retrieved from dbSNP database (http://www.ncbi.nlm.nih.gov/projects/SNP/, Build 138; access date: May 13, 2013) [15] for our computational analysis.
Prediction of deleterious coding nSNPs
We used both SIFT and Polyphen-2 to screen out the deleterious coding nSNPs from other SNPs for TP53. ‘Sorting Tolerant From Intolerant’ (SIFT) (http://sift.jcvi.org/; access date: May 15, 2013) is a multi-step algorithm that uses a sequence homology based approach [16] to predict whether an amino acid substitution in a protein will affect the protein function or not. For a given protein sequence, SIFT chooses the related proteins and obtains an alignment of them with the query and assigns scores to each residue. Scores ranging from 0–0.05 are considered to be intolerant or deleterious amino acid substitutions, where as scores ranging from 0.05–1 are considered be tolerant or neutral [17], [18]. We submitted our query in the form of dbSNP id to SIFT server. PolyPhen-2 (http://genetics.bwh.harvard.edu/pph2/; access date: May 18, 2013) [19] on the other hand is a web based server that predicts the functional significance of an allele replacement from its individual features by Naïve Bayes classifier. PolyPhen-2 prediction models were tested and trained using two pairs of datasets, one is HumanDiv compiled from all damaging alleles with known effects on the molecular function causing human Mendelian diseases, present in the UniProtKB database, together with differences between human proteins and their closely related mammalian homologs, assumed to be non-damaging and the other is HumVar, consisted of all human disease-causing mutations from UniProtKB, together with common human nsSNPs (MAF>1%) without annotated involvement in disease, which were treated as non-damaging. A mutation is appraised qualitatively, as benign, possibly or probably damaging based on pairs of false positive rate (FPR) thresholds, optimized separately for each model. Query was submitted in the form of dbSNP id to WHESS.db: a quick access to precomputed set of PolyPhen-2 predictions for whole human exome sequence space (WHESS).
Prediction of phenotypic consequence for deleterious coding nSNPs
The phenotypic consequences of deleterious coding nSNPs were predicted using MutDB (http://www.mutdb.org/cgi-bin/mutdb.pl; access date: May 20, 2013), a tool that integrates publicly available databases of human genetic variation with molecular features and clinical phenotype data [20]. Gene symbol (‘TP53’) was used as a search term.
Modeling nSNPs locations on protein structure and Molecular dynamics
To investigate the mechanism of structural consequences of the mutations on TP53 we performed molecular dynamics. Initial coordinates were extracted from the crystal structure of p53 core domain in the absence of DNA (PDB ID: 2ocj, chain A; resolution 2.05 A°) [21]. All water molecules were removed from the crystal structure and the mutants (MTs) R110P, P151T, P278A were created by replacing the wild-type (WT) protein residue with its polymorphic residue using PyMOL [22]. Molecular dynamic analysis was performed at 37°C (physiological temperature) and neutral pH using GROMACS 4.5.3 (http://www.gromacs.org/) [23]–[25]. The p53 core domain contains Zn2+ that is essential for activity. A LIGPLOT [26] scheme of Zn2+ interaction in the crystal structure of p53 core domain (PDB ID: 2ocj, chain A; resolution 2.05 A°) was shown in the Fig. 1 given below. Zn2+ remains bound to p53 core domain at temperatures below 30°C and it rapidly dissociates at physiological temperature such that a significant fraction appears in the apo state [27]. Consequently, we focused on both apo and holo simulations of wild (WT) and mutant type (MT) p53 core domain and presented here. The system was solvated by adding explicit flexible SPC water [28] embedded in a cubic box and the walls were located ≥10 Å from all protein atoms. Cl− counter ions (5, 3, 3, 5, 3, 5, 2 and 4 for holo WT, apo WT, apo P151T, holo P151T, apo P278A, holo P278A, apo R110P and holo R110P respectively) were added to neutralize the total charge of the system. The box size was set to 4.833 nm×4.027 nm×4.794 nm with box vectors 7.3 nm×7.3 nm×7.3 nm and box angles 900 for each side. Each solvated structure was energy minimized for 50000 steps of steepest descent minimization terminating when maximum force is found smaller than 1000 KJ/mol−1/nm−1. After energy minimization, the system was subject to equilibration at constant temperature (300K) and pressure (1 bar) with a time step of 2 fs and non bonded pair list updated every five steps under the conditions of position restraints for heavy atoms and LINCS constraints [29] for all bonds. The temperature was kept constant using a Berendsen thermostat [30]. Electrostatic interactions were calculated using the particle mesh Ewald summation method [31]. Finally, eight (i.e., apo WT, holo WT, apo R110P, holo R110P, apo P151T, holo P151T, apo P278A and holo P278A respectively) 10 ns Molecular dynamics simulations (MDS) were performed.
Figure 1. Ligplot showing the interactions of metal ion (Zn) with the amino acid residues of the protein.

An atom of Zn bound with a tetra-co-ordinate geometry to three Cysteines (Cys 176, 238 and 242) and one Histidine (His 179).
Analysis of Molecular dynamics trajectories
Comparative analysis of structural deviations in native and mutant structure such as root mean-square deviation (RMSD), root mean-square fluctuation (RMSF), solvent-accessible surface area (SASA), secondary structure calculation etc., were computed using g_rms, g_rmsf, g_sas and g_gyrate built in functions of GROMACS package. The average number of protein–solvent intermolecular hydrogen bonds was computed and analyzed using g_hbond. A cutoff radius of 0.35 nm was employed between the donor and the acceptor. Density map was plotted using g_densmap whereas average values of simulation output data was plotted using g_analyze of GROMACS respectively. Graphs were plotted using GRACE software (http://plasma-gate.weizmann.ac.il/Grace/).
Principal component analysis
To analyze and visualize the overall motions in the simulations, essential dynamics (ED) was carried out according to the protocol in GROMACS software package [32]. Covariance analysis, also called principle component analysis or ED extracts the correlated motions of proteins to understand the motions that are most fundamental to its activity. ED is generally employed to characterize the large scale collective motions of a protein. Covariance matrices of both WT and MT simulations were constructed using the Cα atoms trajectory as it has been shown that they contain all the information for reasonable description of the protein large concerted motion [32]. We used gromacs utilities g_covar and g_anaeig for analyzing the trajectories.
Results and Discussion
SNP data set from dbSNP
dbSNP database contain a total of 14613 SNPs for TP53 gene, out of which 637 were found to be Human (active) SNPs (i.e., Active Human RS and not including those that have been merged). Among the 637 Human (active) SNPs, 100 were coding nSNPs, 31 were coding synonymous, 52 SNPs were in the mRNA 3′ UTR region, 38 were in the mRNA 5′ UTR region and 451 were in the intronic regions. It can be seen from the Fig. 2 that the vast majority of SNPs occur in the intronic region (70.8%) and more SNPs are nSNPs (15.6%) compared to synonymous SNPs (4.8%), SNPs occurring in the mRNA 3′ UTR (8.1%) and 5′ UTR (5.9%) regions. We selected coding nSNPs for our investigation.
Figure 2. Distribution of TP53 coding nonsynonymous SNPs (nSNPs), coding synonymous SNPs (sSNPs), 3′ UTR SNPs, 5′ UTR SNPs and intronic SNPs.

Deleterious nSNPs by SIFT server
Among the 100 nSNPs, from dbSNP 18 were found to be deleterious, with a tolerance index score of less than or equal to 0.05. We observed that among 18 deleterious nSNPs, 11 had a highly deleterious tolerance index score of 0.00 using orthologues and homologues in the protein alignment. Remaining 7 deleterious nSNPs had a tolerance index score of 0.01, 0.02, 0.03, 0.04 and 0.05 using orthologues and homologues in the protein alignment respectively (Table 1). Among 18 nSNPs that are predicted to be deleterious, three nSNPs showed a nucleotide change of A/T, five showed a change of A/G, one showed a change of C/G, five showed a change of C/T, one showed a change of G/T, one showed a change of C/G/T, one showed a change of A/G/T and one showed a change of A/C/T respectively. Compared to other nucleotide changes C/T and A/T change occurred the maximum number of times. Amino acid change on the other hand was majorly found to be from special amino acids to polar amino acids with uncharged R groups. Among them eight showed a change at the region of Arginine residues, three showed a change at the region of Proline residues, two showed a change at the region of Cysteine and the remaining five showed changes at the regions of Serine, Glycine, Leucine, Methionine, Glutamic Acid (Table 1).
Table 1. Prediction scores found to be functionally significant by SIFT server.
| dbSNPID | Nucleotide Change | Amino acid change | Protein ID | Tolerance Index | |
| Using orthologues in the Protein alignment | Using homologues in the Protein alignment | ||||
| rs1042522 | C/G | P72R | NP_000537 | 0.26 | 0.80 |
| rs1642789 | A/T | C339S | NP_001119585 | 0.05 | 0.00 |
| rs1800371 | C/T | P47S | NP_000537 | 0.49 | 0.06 |
| rs2287499 | C/G | R68G | NP_001137462 | 0.55 | 0.28 |
| rs3021068 | A/T | C341S | NP_001119586 | 0.00 | 0.00 |
| rs11540652 | A/G | R248Q | NP_000537 | 0.00 | 0.04 |
| rs11540654 | C/G/T | R110P | NP_000537 | 0.04 | 0.00 |
| rs17849781 | C/G | P278A | NP_000537 | 0.00 | 0.05 |
| rs17880282 | A/G | P11S | NP_001137462 | 0.00 | 0.00 |
| rs17881470 | G/T | S366A | NP_000537 | 0.77 | 0.01 |
| rs17882252 | A/G | E339K | NP_000537 | 0.15 | 0.00 |
| rs28934571 | G/T | R249S | NP_000537 | 0.00 | 0.00 |
| rs28934573 | C/T | S241F | NP_000537 | 0.00 | 0.00 |
| rs28934574 | C/T | R282W | NP_000537 | 0.00 | 0.00 |
| rs28934575 | A/G/T | G245S | NP_000537 | 0.05 | 0.00 |
| rs28934576 | A/G | R273H | NP_000537 | 0.00 | 0.03 |
| rs28934577 | A/T | L257Q | NP_000537 | 0.00 | 0.00 |
| rs28934578 | A/G | R175H | NP_000537 | 0.00 | 0.00 |
| rs28934873 | C/T | M133T | NP_000537 | 0.00 | 0.00 |
| rs28934874 | A/C/T | P151T | NP_000537 | 0.02 | 0.00 |
| rs28934875 | C/G | A138P | NP_000537 | 0.08 | 0.00 |
| rs34067256 | C/G | P136R | NP_001137462 | 0.31 | 0.93 |
| rs35163653 | A/G | V217M | NP_000537 | 0.06 | 0.00 |
| rs35993958 | C/G | G360A | NP_000537 | 0.76 | 0.27 |
| rs55819519 | C/T | R290H | NP_000537 | 0.29 | 0.09 |
| rs55832599 | A/G | R267W | NP_000537 | 0.00 | 0.00 |
| rs56184981 | C/T | N311S | NP_000537 | 0.74 | 0.39 |
| rs72661117 | A/G | D184N | NP_000537 | 0.25 | 0.00 |
| rs72661119 | A/G | N263D | NP_000537 | 0.30 | 0.01 |
| rs80184930 | A/G | S378P | NP_000537 | 0.10 | 0.00 |
| rs111897235 | A/G | A59T | NP_001137462 | 0.24 | 0.02 |
| rs112431538 | C/T | E285K | NP_000537 | 0.01 | 0.00 |
| rs121913343 | C/T | R273C | NP_000537 | 0.00 | 0.00 |
Damaged nSNPs by PolyPhen-2 Server
To predict the functional significance of an allele replacement, 100 nSNPs analyzed by SIFT were submitted to PolyPhen-2 server. PolyPhen-2 qualitatively predicts whether a mutation is benign, possibly damaging, or probably damaging using two Bayesian probabilistic models, HumDiv and HumVar. For Mendelian disease diagnostics, the HumVar model is recommended as it should distinguish mutations with drastic effects from normal human variation whereas the HumDiv model is recommended for identifying variants where even mildly deleterious alleles are treated as damaging [19]. Among 100 nSNPs from dbSNP submitted to Polyphen-2, 37 were found to be possibly damaging, or probably damaging by both HumDiv and HumVar predictions whereas 2 were predicted as possibly damaging by only HumDiv, 36 were predicted as benign by both HumDiv and HumVar predictions and the remaining 25 were not scored as shown in the Table 2. Only SNPs that are predicted as possibly damaging or probably damaging by both HumDiv and HumVar predictions were considered for our study.
Table 2. Prediction scores found to be functionally significant by Polyphen-2 server.
| dbSNPID | Nucleotide Change | Amino acid change | Protein ID | HDivPred | HDiv Prob | HVarPred | HVarProb |
| rs1042522 | C/G | P72R | P04637 | Benign | 0.083 | Benign | 0.045 |
| rs1642789 | A/T | C339S | P04637 | Benign | 0 | Benign | 0 |
| rs1800371 | C/T | P47S | P04637 | Benign | 0.009 | Benign | 0.004 |
| rs2287499 | C/G | R68G | Q9BUR4 | Benign | 0 | Benign | 0 |
| rs3021068 | A/T | C341S | P04637 | Benign | 0.299 | Benign | 0.034 |
| rs11540652 | A/G | R248Q | P04637 | Probably damaging | 1 | Probably damaging | 0.995 |
| rs11540654 | C/G/T | R110P | P04637 | Probably damaging | 0.911 | Probably damaging | 0.904 |
| rs17849781 | C/G | P278A | P04637 | Probably damaging | 0.999 | Probably damaging | 0.991 |
| rs17880282 | A/G | P11S | Q9BUR4 | Benign | 0.011 | Benign | 0.01 |
| rs17881470 | G/T | S366A | P04637 | Benign | 0.001 | Benign | 0.002 |
| rs17882252 | A/G | E339K | P04637 | Benign | 0.188 | Benign | 0.127 |
| rs28934571 | G/T | R249S | P04637 | Probably damaging | 0.997 | Probably damaging | 0.981 |
| rs28934573 | C/T | S241F | P04637 | Probably damaging | 1 | Probably damaging | 1 |
| rs28934574 | C/T | R282W | P04637 | Probably damaging | 1 | Probably damaging | 1 |
| rs28934575 | A/G/T | G245S | P04637 | Probably damaging | 1 | Probably damaging | 0.999 |
| rs28934576 | A/G | R273H | P04637 | Possibly damaging | 0.831 | Possibly damaging | 0.516 |
| rs28934577 | A/T | L257Q | P04637 | Probably damaging | 1 | Probably damaging | 0.999 |
| rs28934578 | A/G | R175H | P04637 | Possibly damaging | 0.632 | Benign | 0.378 |
| rs28934873 | C/T | M133T | P04637 | Benign | 0.001 | Benign | 0.113 |
| rs28934874 | A/C/T | P151T | P04637 | Probably damaging | 0.98 | Possibly damaging | 0.837 |
| rs28934875 | C/G | A138P | P04637 | Probably damaging | 1 | Probably damaging | 0.998 |
| rs34067256 | C/G | P136R | Q9BUR4 | Benign | 0.007 | Benign | 0.005 |
| rs35163653 | A/G | V217M | P04637 | Possibly damaging | 0.687 | Possibly damaging | 0.578 |
| rs35993958 | C/G | G360A | P04637 | Benign | 0 | Benign | 0.001 |
| rs55819519 | C/T | R290H | P04637 | Benign | 0 | Benign | 0.002 |
| rs55832599 | A/G | R267W | P04637 | Probably damaging | 0.979 | Possibly damaging | 0.868 |
| rs56184981 | C/T | N311S | P04637 | Benign | 0 | Benign | 0 |
| rs72661117 | A/G | D184N | P04637 | Benign | 0.088 | Benign | 0.206 |
| rs72661119 | A/G | N263D | P04637 | Benign | 0.007 | Benign | 0.054 |
| rs80184930 | A/G | S378P | P04637 | Benign | 0.002 | Benign | 0.006 |
| rs111897235 | A/G | A59T | Q9BUR4 | Benign | 0.007 | Benign | 0.007 |
| rs112431538 | C/T | E285K | P04637 | Probably damaging | 1 | Probably damaging | 0.994 |
| rs121913343 | C/T | R273C | P04637 | Probably damaging | 1 | Probably damaging | 0.999 |
| rs121912651 | C/T | R248W | P04637 | Probably damaging | 1 | Probably damaging | 1 |
| rs121912652 | A/G | E258K | P04637 | Probably damaging | 1 | Probably damaging | 0.999 |
| rs121912653 | C/T | L252P | P04637 | Probably damaging | 1 | Probably damaging | 1 |
| rs121912654 | G/T | V157F | P04637 | Probably damaging | 0.999 | Probably damaging | 0.996 |
| rs121912655 | A/G | C242Y | P04637 | Probably damaging | 1 | Probably damaging | 1 |
| rs121912656 | A/G | G245D | P04637 | Probably damaging | 1 | Probably damaging | 0.999 |
| rs121912657 | G/T | V272L | P04637 | Probably damaging | 0.998 | Probably damaging | 0.966 |
| rs121912659 | G/T | G325V | P04637 | Benign | 0.045 | Benign | 0.189 |
| rs121912660 | G/T | R280T | P04637 | Probably damaging | 0.998 | Probably damaging | 0.984 |
| rs121912661 | C/G/T | L35F | P04637 | Benign | 0.068 | Benign | 0.06 |
| rs121912662 | C/T | L344P | P04637 | Probably damaging | 0.995 | Probably damaging | 0.967 |
| rs121912663 | A/T | K292I | P04637 | Benign | 0.017 | Benign | 0.164 |
| rs121912664 | A/G | R337H | P04637 | Probably damaging | 0.96 | Possibly damaging | 0.719 |
| rs121912665 | C/T | A189V | P04637 | Possibly damaging | 0.874 | Possibly damaging | 0.771 |
| rs121912666 | A/C | Y220S | P04637 | Possibly damaging | 0.995 | Possibly damaging | 0.977 |
| rs121912667 | A/T | E288V | P04637 | Probably damaging | 0.998 | Probably damaging | 0.998 |
| rs137852789 | A/G | G154S | P04637 | Probably damaging | 0.958 | Possibly damaging | 0.654 |
| rs137852792 | C/T | A129V | P04637 | Benign | 0 | Benign | 0 |
| rs137853007 | C/T | R145W | O96017 | Probably damaging | 1 | Probably damaging | 0.999 |
| rs137854598 | A/C | A102E | P42771 | Probably damaging | 1 | Probably damaging | 0.969 |
| rs138729528 | C/G | R175G | P04637 | Probably damaging | 0.999 | Probably damaging | 0.992 |
| rs138983188 | G/T | P223H | P04637 | Probably damaging | 1 | Probably damaging | 0.996 |
| rs139002536 | C/T | P45S | E9PMG4, Q9BUR4 | Benign | 0 | Benign | 0 |
| rs140594263 | C/T | A145V | Q9BUR4 | Benign | 0.002 | Benign | 0.004 |
| rs140694361 | C/T | P11L | E9PMG4, Q9BUR4 | Benign | 0.033 | Benign | 0.006 |
| rs141402957 | C/T | K351E | P04637 | Possibly damaging | 0.633 | Possibly damaging | 0.515 |
| rs141850830 | C/T | P86S | E9PMG4, Q9BUR4 | Benign | 0.079 | Benign | 0.021 |
| rs144238223 | A/G | E108G | E9PMG4 | Possibly damaging | 0.659 | Benign | 0.403 |
| rs144340710 | C/T | N235S | P04637 | Benign | 0.186 | Benign | 0.144 |
| rs144386518 | C/G | P58R | P04637 | Benign | 0.038 | Benign | 0.013 |
| rs145151284 | C/G | T312S | P04637 | Benign | 0 | Benign | 0.002 |
| rs145760222 | A/G | V63M | E9PMG4, Q9BUR4 | Benign | 0.015 | Benign | 0.007 |
| rs146340390 | A/G | P222L | P04637 | Benign | 0.042 | Benign | 0.068 |
| rs147002414 | A/G | P177S | P04637 | Probably damaging | 0.995 | Probably damaging | 0.964 |
| rs147226406 | A/G | A145T | Q9BUR4 | Benign | 0 | Benign | 0 |
| rs148728256 | A/C | E117A | E9PMG4 | Benign | 0.002 | Benign | 0.002 |
| rs148924904 | C/T | Y163C | P04637 | Probably damaging | 1 | Probably damaging | 1 |
| rs149576018 | C/G | R92G | E9PMG4, Q9BUR4 | Benign | 0 | Benign | 0.001 |
| rs149633775 | A/G | R283C | P04637 | Benign | 0.089 | Benign | 0.087 |
| rs150282629 | G/T | S16A | E9PMG4, Q9BUR4 | Benign | 0.001 | Benign | 0.002 |
| rs150607408 | C/T | S185N | P04637 | Benign | 0 | Benign | 0.002 |
| rs150842067 | A/G | L383F | P04637 | Possibly damaging | 0.865 | Possibly damaging | 0.594 |
Breast Cancer related mutations by Mutdb database
Results from both SIFT and Polyphen-2 analysis showed that among 100 nSNPs, only 15 SNPs were predicted to be deleterious or damaging on protein function. These 15 SNPs were submitted to Mutdb to confirm that they confer a breast cancer phenotype or not. Results showed that 3 SNP mutations i.e., rs11540654 (R110P), rs17849781 (P278A) and rs28934874 (P151T) are known to have a phenotype in Breast tumors (Table 3).
Table 3. Phenotype information of TP53 variants.
| dbSNPID | Nucleotide change | Amino acid change | Prediction | ||
| SIFT | Polyphen-2 | Phenotype (Mutdb) | |||
| rs11540652 | A/G | R248Q | Intolerant | Probably damaging | In LFS and many types of tumors |
| rs11540654 | C/G/T | R110P | Intolerant | Probably damaging | In a breast tumor |
| rs17849781 | C/G | P278A | Potentially intolerant | Probably damaging | In a breast tumor |
| rs28934571 | G/T | R249S | Intolerant | Probably damaging | In many types of tumors |
| rs28934573 | C/T | S241F | Intolerant | Probably damaging | In a colon tumor |
| rs28934574 | C/T | R282W | Intolerant | Probably damaging | In esophageal adeno carcinoma and many types of tumors |
| rs28934575 | A/G/T | G245S | Potentially intolerant | Probably damaging | In esophageal adeno carcinoma and many types of tumors |
| rs28934576 | A/G | R273H | Intolerant | Possibly damaging | In LFS, colon and esophagus tumors |
| rs28934577 | A/T | L257Q | Intolerant | Probably damaging | Nil |
| rs28934874 | A/C/T | P151T | Intolerant | Possibly damaging | In a breast tumor |
| rs28934875 | C/G | A138P | Potentially intolerant | Probably damaging | In a lung tumor |
| rs35163653 | A/G | V217M | Potentially intolerant | Possibly damaging | Nil |
| rs55832599 | A/G | R267W | Intolerant | Probably damaging | Nil |
| rs112431538 | C/T | E285K | Intolerant | Probably damaging | Nil |
| rs121913343 | C/T | R273C | Intolerant | Probably damaging | Nil |
Molecular dynamics simulation studies
Results from the calculations of RMSD for backbone and Cα atoms, root mean square fluctuation (RMSF) for Cα atoms, radius of gyration (Rg) for Cα atoms and protein for apo and holo WT, R110P, P151T, P278A MDS were presented in the Table 4. To analyze the impact of MTs on the p53C, we have examined the RMSD values. The calculated RMSDs of the backbone atoms in apo and holo WT, R110P, P151T, P278A with respect to the starting structure during the 10-ns MDS as a function of time were plotted in the Fig. 3a, b. During the apo simulations, backbone RMSDs of the WT and MT structures showed a sharp increase in the first 3 ns followed by equilibrium around 6 ns and a sudden decrease around 7.5 ns for P151T, 9.5 ns for P278A and R110P (Fig. 3a) whereas in the case of holo simulations a different pattern was observed. A sharp increase is shown during the first 3.5 ns followed by equilibrium around 4 ns and a sudden increase around 7.5 ns for P151T, P278A and a sudden decrease around 9.5 ns for R110P. A comparison of average backbone RMSD values showed the following order of structural deviations (Table 4): apo; R110P > WT > P151T = P278A, holo; R110P = P278A > WT >P151T. A variation in the average backbone RMSD values of WT and MTs lead to the conclusion that these mutations could affect the dynamic behavior of p53C, thus provides a suitable basis for further analyses.
Table 4. Time averaged structural properties calculated for WT, R110P, P151T, P278A holo [with Zn2+ ion present] and apo [with Zn2+ ion absent] p53 core domain.
| initial WT | R110P | P151T | P278A | |||||
| apo | holo | apo | holo | apo | holo | apo | holo | |
| Backbone rmsd (nm) | 0.27 (0.04) | 0.24 (0.02) | 0.29 (0.03) | 0.26 (0.04) | 0.24 (0.04) | 0.21 (0.03) | 0.24 (0.05) | 0.26 (0.05) |
| Cα-rmsd (nm) | 0.28 (0.04) | 0.25 (0.03) | 0.30 (0.03) | 0.27 (0.04) | 0.25 (0.04) | 0.22 (0.03) | 0.24 (0.05) | 0.26 (0.05) |
| Cα-rmsf (nm) | 0.15 (0.08) | 0.12 (0.07) | 0.13 (0.08) | 0.13 (0.07) | 0.13 (0.07) | 0.12 (0.06) | 0.14 (0.08) | 0.14 (0.09) |
| Rg- Cα (nm) | 1.64 (0.01) | 1.64 (0.01) | 1.62 (0.09) | 1.63 (0.08) | 1.64 (0.08) | 1.63 (0.07) | 1.63 (0.01) | 1.64 (0.01) |
| Rg-protein (nm) | 1.67 (0.01) | 1.67 (0.01) | 1.65 (0.01) | 1.66 (0.08) | 1.66 (0.08) | 1.66 (0.08) | 1.66 (0.01) | 1.66 (0.0) |
| Trace of the diagonalized covariance matrix (nm2) | 5.67543 | 4.51117 | 4.86401 | 4.81546 | 4.55228 | 4.11307 | 5.70146 | 5.5473 |
Mean values—averaged over the trajectory or over the number of residues employed at each calculation—with standard deviations given in parentheses. Cα-rmsd: Cα-root-mean-square deviation, Rg: Radius of gyration; SASA: Solvent Accessible Surface Area
Figure 3. Backbone rmsd values for WT, R110P, P151T and P278A during A) Apo simulations B) Holo simulations for p53C.
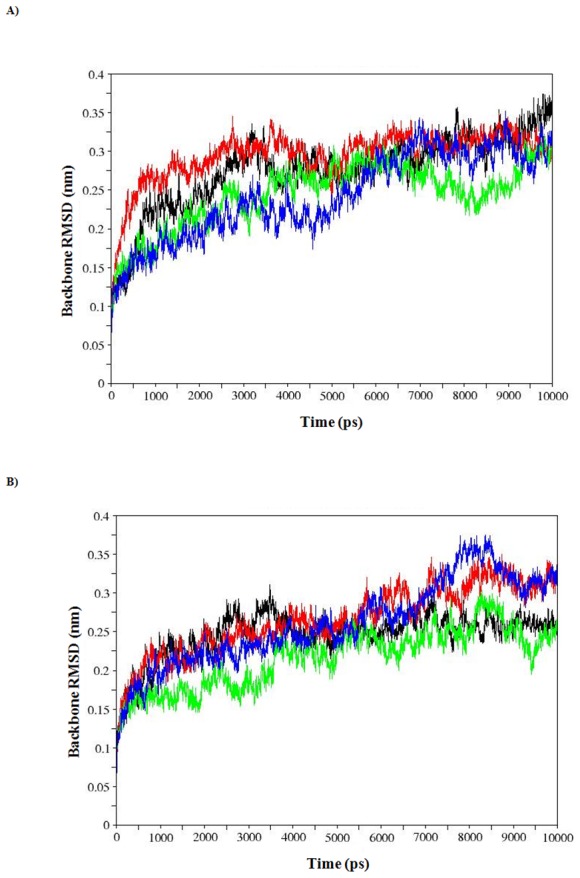
Black: WT, red: R110P, green: P151T and blue: P278A.
Since, RMSD of the Cα atoms is a central origin to compute the protein system [33], we have calculated the respective Cα RMSDs for both apo and holo simulations and plotted in the Fig. 4, 5. During the apo simulations, Cα-RMSD of R110P showed a sharp increase in the initial 2.5 ns followed by equilibrium around 4 ns and a sudden decrease after 9 ns (Fig. 4a). However, P151T and P278A showed a different trend of Cα-RMSD, with an equilibrium around 4 ns and a sudden decrease around 7 ns for P151T (Fig. 4b) whereas an equilibrium around 6 ns and a sudden decrease around 9 ns for P278A (Fig. 4c). During holo simulations on the other hand, Cα-RMSD of R110P showed a less variation in the initial 2 ns followed by equilibrium around 4 ns and a sudden decrease after 5 ns (Fig. 5a). However, P151T and P278A showed a different trend of Cα-RMSD, with an equilibrium around 5 ns and a sudden decrease around 9.5 ns for P151T (Fig. 5b) whereas an equilibrium around 4 ns and a sudden increase around 7 ns for P278A (Fig. 5c). A comparison of average Cα-RMSD values showed the following order of structural deviations (Table 4): apo; R110P > WT > P151T > P278A, holo; R110P > P278A > WT > P151T. These results indicate that a greatest change was observed in the R110P compared to the other mutants in both apo and holo simulations.
Figure 4. RMSD and DSSP changes in WT and MT structures during the 10-ns apo MDS.

A) Figure shown at the top represents WT and R110P DSSP plot. In the middle superimposed WT and R110P structures are shown. Yellow: WT, red: R110P. At the bottom, the Cα RMSD plot is shown as a function of time. Black: WT, red: R110P. B) Figure shown at the top represents WT and P151T DSSP plot. In the middle superimposed WT and P151T structures are shown. Yellow: WT, green: P151T. At the bottom, the Cα RMSD plot is shown as a function of time. Black: WT, green: P151T. C) Figure shown at the top represents WT and P278A DSSP plot. In the middle superimposed WT and P278A structures are shown. Yellow: WT, blue: P278A. At the bottom, the Cα RMSD plot is shown as a function of time. Black: WT, blue: P278A.
Figure 5. RMSD and DSSP changes in WT and MT structures during the 10 –ns holo MDS.

A) Figure shown at the top represents WT and R110P DSSP plot. In the middle superimposed WT and R110P structures are shown. Yellow: WT, red: R110P. At the bottom, the Cα RMSD plot is shown as a function of time. Black: WT, red: R110P. B) Figure shown at the top represents WT and P151T DSSP plot. In the middle superimposed WT and P151T structures are shown. Yellow: WT, green: P151T. At the bottom, the Cα RMSD plot is shown as a function of time. Black: WT, green: P151T. C) Figure shown at the top represents WT and P278A DSSP plot. In the middle superimposed WT and P278A structures are shown. Yellow: WT, blue: P278A. At the bottom, the Cα RMSD plot is shown as a function of time. Black: WT, blue: P278A.
In order to analyze the change in secondary structure patterns in WT and MTs, we applied the software tool DSSP (Database of Secondary Structure in Proteins) by Kabsch and Sander [34], which employs H-bonding patterns and various other geometrical features to assign secondary structure labels to the residues of a protein. We have plotted the secondary structure patterns between WT and MTs of both apo and holo simulations and also superimposed their respective structures at the beginning of the simulation and for specific time steps where the conformational drifts occurred at a higher range (Fig. 4,5). Analysis of time dependent secondary structure fluctuations through DSSP analysis showed a conformational drift from β-sheets to bend form between the residues 165–175 in R110P and α-helix to bend form for the 180th residue in P151T and P278A during the apo simulations and a conformational drift from α-helix to bend for the 180th residue in R110P, P151T and turn to bend form for the 130th residue in P278A during the holo simulations (Fig. 4, 5). The conformational changes support our previous results obtained from RMSD analysis that major change occurred in the R110P (Fig. 2,4,5).
In order to understand how the mutants affect the dynamic behaviour of the residues and to examine the cause of conformational drifts observed in RMSD and secondary structure patterns, Cα-root mean square fluctuation (Cα-RMSF) of WT and MT amino acid residues were calculated and plotted in the Fig. 6a-d. Except P151T, in all cases the MT holo simulations had higher average Cα-RMSFs than the WT holo simulations (Fig. 6a) (Table 4). In the apo and holo WT, more than 50% of the residues have RMSF values >0.1 nm (Table 5) indicating a higher level of fluctuation. During the holo simulations, all the MTs showed a larger percentage of residues (i.e., Cα residues and residues in the protein core comprising secondary structural elements) with RMSF values >0.1 nm whereas during apo simulations less percentage of residues showed RMSF values >0.1 nm compared to the WT. These results indicate that compared to apo, holo simulations are associated with increase in flexibilities in MTs. Among the holo MTs, R110P have a higher percentage of residues with RMSF >0.1 nm thus indicating a higher effect on the overall flexibility of the p53C.
Figure 6. RMSF of Cα atoms as a function of amino acids.

Table 5. Percentage wise distribution of Cα RMSF values.
| RMSF (nm) | ||||
| All Cα | Sec-str Cα | |||
| ≤0.1 nm | >0.1 nm | ≤0.1 nm | >1 nm | |
| WT apo | 34 | 66 | 26 | 20 |
| WT holo | 47 | 52 | 34 | 13 |
| R110P apo | 47 | 52 | 31 | 9 |
| R110P holo | 38 | 61 | 27 | 18 |
| P151T apo | 46 | 53 | 32 | 12 |
| P151T holo | 44 | 55 | 29 | 15 |
| P278A apo | 35 | 64 | 27 | 17 |
| P278A holo | 41 | 58 | 29 | 15 |
Further, comparison of the regional flexibilities of the MTs showed a characteristic increase and decrease of the flexibility in certain loops, helices and β-sheets (Table 6). Strand S10 showed a consistently low fluctuation across all the simulations whereas higher fluctuations around the Zn2+ binding residues, C176, H179, C238 and C242 were observed in apo WT and MTs compared to the holo WT simulations (Table 7). Loop regions on the other hand showed a larger fluctuation in both WT and MTs. Changes in the loops L3, L11, L12 and H2 helix contributed to a higher value of Cα-RMSF in the MTs with a larger portion of the L3 loop, S10 strand and H2 helix shifted far from its starting position (Fig. 6a). Compared to the WT simulations, the fluctuations observed were noticeably increased around the loops L3 and L7 in the R110P (Fig. 6b) whereas in P151T noticeable increase in fluctuations were observed around the loops L4 and L7 (Fig. 6c). P278A on the other hand showed an increase in fluctuations at the loops L3, L7, L11 and H2 helix regions (Fig. 6d). Results from the analysis of regional flexibilities indicate that all the three MTs R110P, P151T and P278A will affect the overall flexibility of p53C.
Table 6. Regions (α-helices, β-sheets, and loops) showing an average increase or decrease of RMSF in the MTs compared to the WT; RMSF of a particular structure is taken to be increased or decreased if there is an average change in RMSF of >0.03 nm in at least ≥50% of its residues.
| Increase | Decrease | |
| R110P apo | L4, S4, L6, L7, L10, | L3, L8, L12, |
| R110P holo | L1, S1, L3, S2, L4, L7, L10, L13, | H2, L8, |
| P151T apo | L4, L7, H2, | L3, L8, |
| P151T holo | L1, L2, L4, L7, L10, L11, | L3, L8, L12, |
| P278A apo | L3, L4, L7, H2, L10, | L1, L8, |
| P278A holo | L1, L4, L7, L10, L11, | L3, L8, |
Table 7. Cα RMSF values (nm) at Zn2+ binding residues, C176, H179, C238 and C242.
| Residue | WT holo | WT apo | R110 apo | R110 holo | P151T apo | P151T holo | P278A apo | P278A holo |
| C176 | 0.1452 | 0.1598 | 0.1021 | 0.1056 | 0.1588 | 0.1458 | 0.1247 | 0.1331 |
| H179 | 0.148 | 0.1985 | 0.1322 | 0.1301 | 0.1846 | 0.1523 | 0.3181 | 0.1354 |
| C238 | 0.0959 | 0.1383 | 0.0726 | 0.0619 | 0.1311 | 0.0893 | 0.0809 | 0.0814 |
| C242 | 0.1733 | 0.1553 | 0.1042 | 0.0978 | 0.1578 | 0.1367 | 0.1539 | 0.1983 |
SASA is a geometric measure of the extent to which an amino acid interacts with its environment (the solvent and the protein core). It is naturally proportional to the degree to which an amino acid is exposed to these environments [35]. A rise or fall in the SASA designates the change in exposed amino acid residues thereby affecting the tertiary structure of a protein. Results from the analysis of SASA for apo and holo simulations showed a variation among the WT and MTs (Fig. 7a-b). MTs (apo; R110P:117.5916, P151T:118.8266, P278:118.7204, holo; R110P:118.1768, P151T:118.3956, P278A:118.7466) showed a lesser average total SASA compared to the WT (apo; 119.7036, holo; 118.8847). Rg on the other hand, is a parameter to describe the equilibrium conformation of a total system particularly in analyzing the proteins it is an indicative of the level of compaction in the structure, i.e. how the polypeptide chain is folded or unfolded [36]. Rg plot for Cα atoms and protein with time over the course of 10 ns simulations during apo and holo simulations is shown in the Fig. 8a-f and Fig. 9a-f. In the Rg plot for both Cα atoms and protein, we observed a notable fluctuation in MTs compared to the WT. Among the MTs, large deviations in Rg from the WT structure were observed during the apo and holo simulations of R110P (Table 4). These results indicate that compared to other MTs, p53C might have undergone a significant structural transition due to R110P.
Figure 7. Solvent-accessible surface area (SASA) of WT and MT versus time during A) Apo B) Holo simulations for p53C.

Black: WT, red: R110P, green: P151T and blue: P278A.
Figure 8. Radius of gyration of Cα atoms during a 10-ns MDS for WT and MT p53C versus time.
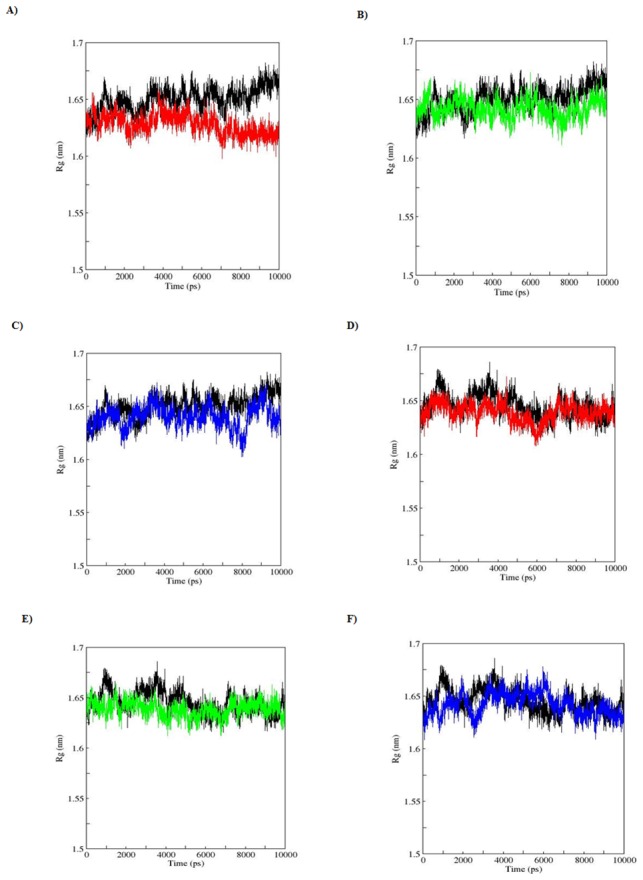
A), B), C) represent apo simulation D), E), F) represent holo simulation. Black: WT, red: R110P, green: P151T and blue: P278A.
Figure 9. Radius of gyration of Protein during a 10-ns MDS for WT and MT p53C versus time.
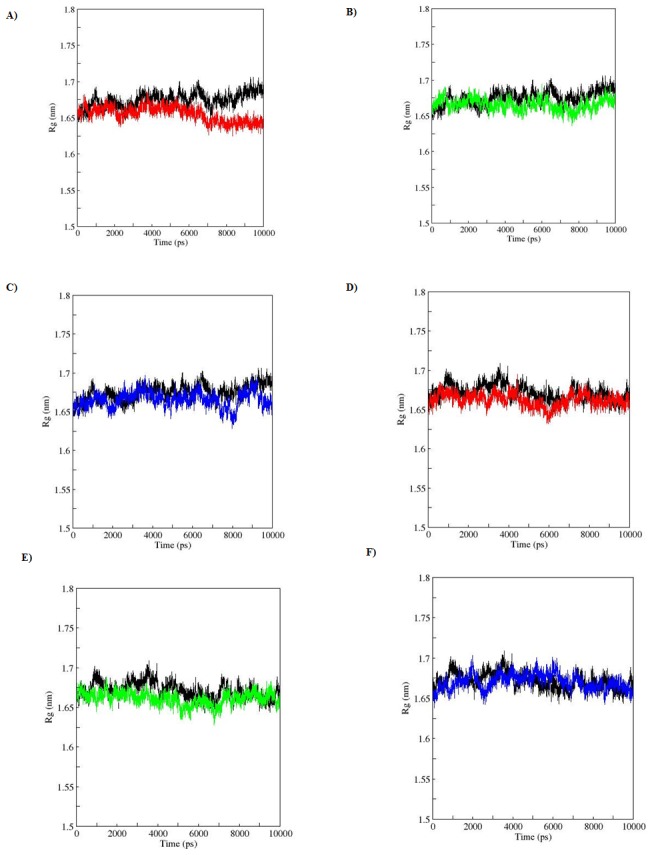
A), B), C) represent apo simulation D), E), F) represent holo simulation. Black: WT, red: R110P, green: P151T and blue: P278A.
Further, one of the factors that accounts for maintaining the stable conformation of a protein is hydrogen bonding. In order to understand the reason for flexibility among the MTs we have performed the NH bond analysis of WT and MTs during apo and holo simulations and plotted in the Fig. 10a-f. Results showed a notable difference in protein-solvent intermolecular hydrogen bond pattern between the WT and MTs. Among the MTs, a decrease in the average number of hydrogen bonds was observed in R110P compared to the WT during both apo and holo simulations (Fig. 10a,d) indicting that the occurrence of this mutation may lead to a more flexible conformation in the presence or absence of Zn2+ at physiological conditions. However, the other MTs, P151T and P278A showed a decrease in average number of protein-solvent intermolecular hydrogen bonds only during holo simulations (Fig. 10e,f) indicating that these two mutants are flexible only in the presence of Zn2+ at physiological conditions. Further, we have plotted the atom density distribution to check if the MTs have caused any major changes in the orientation and atomic distribution. Results showed that atomic distribution of all the MTs were significantly differed from the WT in apo and holo simulations (Fig. 11a-h) indicating that all the MTs have a deleterious effect on the p53C.
Figure 10. Average number of protein–solvent intermolecular hydrogen bonds in WT and MT p53C versus time.

A), B), C) represent apo simulation D), E), F) represent holo simulation. Black: WT, red: R110P, green: P151T and blue: P278A.
Figure 11. Number density plot of p53C.

A) Apo WT B) Apo R110P C) Apo P151T D) Apo P278A E) Holo WT F) Holo R110P G) Holo P151T F) Holo P278A.
Moreover, to identify the correlated motions of the WT and MTs during trajectory generated by apo and holo simulations and to support our MDS result we performed ED analysis. Since sum of the eigenvalues is a measure of the total motility in the system, we have plotted the eigenvalues against the corresponding eigenvector index for the first ten modes of motion at different trajectory lengths for WT and MTs during the apo and holo simulations in the Fig. 12 a, b. Only few eigenvectors showed large eigenvalues for both WT and MTs during the apo and holo simulations indicating that most of the internal motion of the protein is confined along small dimension in the essential subspace. The spectrum of eigenvalues in the Fig. 12 a,b indicated that major fluctuations of the system were confined to first two eigenvectors. Hence, the projection of trajectories of WT and MTs during the apo and holo simulations in the phase space along the first two principal components (PC1, PC2) at 300 K was plotted in the Fig. 13 a-f. Compared to apo simulation, during holo simulation MTs covered a larger region of phase space along PC1 and PC2 plane than WT. The overall flexibility of WT and MTs was calculated by the trace of the diagonalized covariance matrix of the Cα atomic positional fluctuations. Results from the trace of the covariance matrix (Table 4) confirmed the overall flexibility between MTs and WT at 300K during both apo and holo simulations. Overall the results reported from our study has confirmed that the substitution of Arginine at 110th residue with Proline, Proline at 151th residue with Threonine and Proline at 278th residue with Alanine in the p53 core domain in the presence or absence of Zn2+ has an altered structure stability and essential hydrogen bond formation and thus these three mutants might play a significant role in initiating the susceptibility towards breast cancer. Further, our analysis indicates that compared to other MTs P151T and P278A, amino acid substitution of Arginine at 110th residue with Proline (R110P) exhibit a highly deleterious effect on the p53C.
Figure 12. Plot of eigenvalues corresponding to eigenvector index for the first fifty modes of motion of p53C.
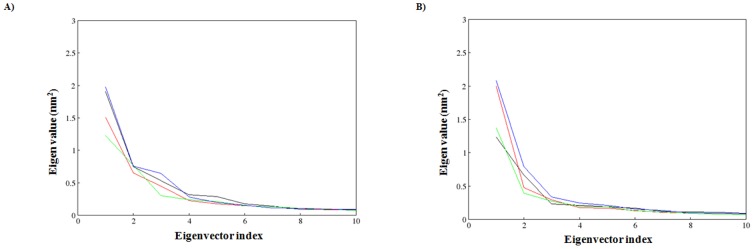
A) represents the apo simulation B) represents the holo simulation. Black: WT, red: R110P, green: P151T and blue: P278A.
Figure 13. Projection of the motion of the p53C in the phase space along the first two principal eigenvectors.

A), C), E) represents the apo simulation B), D), F) represents the holo simulation. Black: WT, red: R110P, green: P151T and blue: P278A.
Conclusion
The present study, will offer an in depth insight into the genotype–phenotype association of deleterious breast cancer associated nSNPs in TP53. Our study reports three mutations R110P, P151T and P278A associated with breast cancer phenotype and further the molecular dynamics revealed their respective major consequences on native p53 DNA-binding core domain. RMSD, Rg, SASA, NH bond and number density plots revealed their high deleterious nature on the p53 DNA-binding core domain in the presence and absence of Zn2+ ion. Overall, the present computational approach will provide a comprehensive view on destabilizing mechanisms of p53 SNPs in breast cancer and it may serve as a useful model for predicting the effect of SNPs in other proteins. The results reported in this study elucidate the role of deleterious mutations in p53 which may provide a useful information for the design of p53 mutants based therapeutic strategies against breast cancer.
Acknowledgments
We are very thankful to C-DAC, for providing high-end supercomputing facility to carry out the simulations. We also thank Prof. P. Sreedhara Reddy, Department of Physics, Sri Venkateswara University for providing the facilities.
Data Availability
The authors confirm that all data underlying the findings are fully available without restriction. All data and related metadata underlying the findings reported in the submitted manuscript are already provided as part of the submitted article and there is no general repository for Molecular dynamics data.
Funding Statement
The authors have no support or funding to report.
References
- 1. Choudhrya N, Khurana D, Sharma N (2012) Aparajita (2012) Breast cancer: A paradigm shift. Apollo Medicine 9: 133e137. [Google Scholar]
- 2. Bhoo-Pathy N, Yip CH, Hartman M, Uiterwaal CS, Devi BC, et al. (2013) Breast cancer research in Asia: adopt or adapt Western knowledge? Eur J Cancer 49: 703–709. [DOI] [PubMed] [Google Scholar]
- 3. Zhang B, Beeghly-Fadiel A, Long J, Zheng W (2011) Genetic variants associated with breast-cancer risk: comprehensive research synopsis, meta-analysis, and epidemiological evidence. Lancet Oncol 12: 477–488. [DOI] [PMC free article] [PubMed] [Google Scholar]
- 4. Mavaddat N, Antoniou AC, Easton DF, Garcia-Closas M (2010) Genetic susceptibility to breast cancer. Mol Oncol 4: 174–191. [DOI] [PMC free article] [PubMed] [Google Scholar]
- 5. Varna M, Bousquet G, Plassa LF, Bertheau P, Janin A (2011) TP53 status and response to treatment in breast cancers. J Biomed Biotechnol 2011: 284584. [DOI] [PMC free article] [PubMed] [Google Scholar]
- 6. Levy CB, Stumbo AC, Ano Bom AP, Portari EA, Cordeiro Y, et al. (2011) Co-localization of mutant p53 and amyloid-like protein aggregates in breast tumors. Int J Biochem Cell Biol 43: 60–64. [DOI] [PubMed] [Google Scholar]
- 7. Guimaraes DP, Hainaut P (2002) TP53: a key gene in human cancer. Biochimie 84: 83–93. [DOI] [PubMed] [Google Scholar]
- 8. Dantzer J, Moad C, Heiland R, Mooney S (2005) MutDB services: interactive structural analysis of mutation data. Nucleic Acids Res 33: W311–314. [DOI] [PMC free article] [PubMed] [Google Scholar]
- 9. Ramensky V, Bork P, Sunyaev S (2002) Human non-synonymous SNPs: server and survey. Nucleic Acids Res 30: 3894–3900. [DOI] [PMC free article] [PubMed] [Google Scholar]
- 10. Calhoun S, Daggett V (2011) Structural effects of the L145Q, V157F, and R282W cancer-associated mutations in the p53 DNA-binding core domain. Biochemistry 50: 5345–5353. [DOI] [PMC free article] [PubMed] [Google Scholar]
- 11. Pirolli D, Carelli Alinovi C, Capoluongo E, Satta MA, Concolino P, et al. (2010) Insight into a novel p53 single point mutation (G389E) by Molecular Dynamics Simulations. Int J Mol Sci 12: 128–140. [DOI] [PMC free article] [PubMed] [Google Scholar]
- 12. Li J, Yang L, Gaur S, Zhang K, Wu X, et al. (2014) Mutants TP53 p.R273H and p.R273C but not p.R273G Enhance Cancer Cell Malignancy. Hum Mutat 35: 575–584. [DOI] [PubMed] [Google Scholar]
- 13. Brandt-Rauf PW, Chen JM, Marion MJ, Smith SJ, Luo JC, et al. (1996) Conformational effects in the p53 protein of mutations induced during chemical carcinogenesis: molecular dynamic and immunologic analyses. Journal of protein chemistry 15: 367–375. [DOI] [PubMed] [Google Scholar]
- 14. Ferrone M, Perrone F, Tamborini E, Paneni MS, Fermeglia M, et al. (2006) Functional analysis and molecular modeling show a preserved wild-type activity of p53(C238Y). Mol Cancer Ther 5: 1467–1473. [DOI] [PubMed] [Google Scholar]
- 15. Sherry ST, Ward MH, Kholodov M, Baker J, Phan L, et al. (2001) dbSNP: the NCBI database of genetic variation. Nucleic Acids Res 29: 308–311. [DOI] [PMC free article] [PubMed] [Google Scholar]
- 16. Kumar P, Henikoff S, Ng PC (2009) Predicting the effects of coding non-synonymous variants on protein function using the SIFT algorithm. Nat Protoc 4: 1073–1081. [DOI] [PubMed] [Google Scholar]
- 17. Ng PC, Henikoff S (2006) Predicting the effects of amino acid substitutions on protein function. Annu Rev Genomics Hum Genet 7: 61–80. [DOI] [PubMed] [Google Scholar]
- 18. Ng PC, Henikoff S (2003) SIFT: Predicting amino acid changes that affect protein function. Nucleic Acids Res 31: 3812–3814. [DOI] [PMC free article] [PubMed] [Google Scholar]
- 19. Adzhubei IA, Schmidt S, Peshkin L, Ramensky VE, Gerasimova A, et al. (2010) A method and server for predicting damaging missense mutations. Nat Methods 7: 248–249. [DOI] [PMC free article] [PubMed] [Google Scholar]
- 20. Singh A, Olowoyeye A, Baenziger PH, Dantzer J, Kann MG, et al. (2008) MutDB: update on development of tools for the biochemical analysis of genetic variation. Nucleic Acids Res 36: D815–819. [DOI] [PMC free article] [PubMed] [Google Scholar]
- 21. Wang Y, Rosengarth A, Luecke H (2007) Structure of the human p53 core domain in the absence of DNA. Acta Crystallogr D Biol Crystallogr 63: 276–281. [DOI] [PubMed] [Google Scholar]
- 22.PyMol (2006) version 0.99. DeLano Scientific, San Carlos, CA.
- 23. Van Der Spoel D, Lindahl E, Hess B, Groenhof G, Mark AE, et al. (2005) GROMACS: fast, flexible, and free. J Comput Chem 26: 1701–1718. [DOI] [PubMed] [Google Scholar]
- 24. Berendsen HJC, Vanderspoel D, Vandrunen R (1995) Gromacs: A Message-Passing Parallel Molecular-Dynamics Implementation. Comput Phys Commun 91: 43–56. [Google Scholar]
- 25. Hess B, Kutzner C, van der Spoel D, Lindahl E (2008) GROMACS 4: Algorithms for highly efficient, load-balanced, and scalable molecular simulation. J Chem Theory Comput 4: 435–447. [DOI] [PubMed] [Google Scholar]
- 26. Wallace AC, Laskowski RA, Thornton JM (1995) LIGPLOT: a program to generate schematic diagrams of protein-ligand interactions. Protein Eng 8: 127–134. [DOI] [PubMed] [Google Scholar]
- 27. Butler JS, Loh SN (2003) Structure, function, and aggregation of the zinc-free form of the p53 DNA binding domain. Biochemistry 42: 2396–2403. [DOI] [PubMed] [Google Scholar]
- 28.Berendsen HJC, Postma JPM, van Gunsteren WF, Hermans J (1981) Interaction models for water in relation to protein hydration. Intermolecular forces: 331–342.
- 29. Hess B, Bekker H, Berendsen HJC, Fraaije JGEM (1997) LINCS: A linear constraint solver for molecular simulations. J Comp Chem 18: 1463–1472. [Google Scholar]
- 30. Berendsen HJC, Postma JPM, van Gunsteren WF, DiNola A, Haak JR (1984) Molecular dynamics with coupling to an external bath. J Chem Phys 81: 3684–3690. [Google Scholar]
- 31. Darden T, York D, Pedersen L (1993) Particle mesh Ewald: an N-log(N) method for Ewald sums in large systems. J Chem Phys 98: 10089–10092. [Google Scholar]
- 32. Amadei A, Linssen AB, Berendsen HJ (1993) Essential dynamics of proteins. Proteins 17: 412–425. [DOI] [PubMed] [Google Scholar]
- 33. Kumar A, Purohit R (2014) Use of long term molecular dynamics simulation in predicting cancer associated SNPs. PLoS computational biology 10: e1003318. [DOI] [PMC free article] [PubMed] [Google Scholar]
- 34. Kabsch W, Sander C (1983) Dictionary of protein secondary structure: pattern recognition of hydrogen-bonded and geometrical features. Biopolymers 22: 2577–2637. [DOI] [PubMed] [Google Scholar]
- 35. Durham E, Dorr B, Woetzel N, Staritzbichler R, Meiler J (2009) Solvent accessible surface area approximations for rapid and accurate protein structure prediction. J Mol Model 15: 1093–1108. [DOI] [PMC free article] [PubMed] [Google Scholar]
- 36. Lobanov M, Bogatyreva NS, Galzitskaia OV (2008) [Radius of gyration is indicator of compactness of protein structure]. Mol Biol (Mosk) 42: 701–706. [PubMed] [Google Scholar]
Associated Data
This section collects any data citations, data availability statements, or supplementary materials included in this article.
Data Availability Statement
The authors confirm that all data underlying the findings are fully available without restriction. All data and related metadata underlying the findings reported in the submitted manuscript are already provided as part of the submitted article and there is no general repository for Molecular dynamics data.