Abstract
In this study, an automated algorithm was developed to identify the arrhythmic gastric slow wave activity that was recorded using high-resolution mapping technique. The raw signals were processed with a Savitzky-Golay filter, and the slow wave activation times were identified using a threshold varying method and grouped using a region-growing method. Slow wave amplitudes and velocities were calculated for all cycles. Arrhythmic events were identified when the orientation of a slow wave at an electrode exceeded the 95% confidence interval of the averaged orientation of several normal cycles. A second selection criterion was further developed to identify the arrhythmic events by an anisotropy ratio. In both pig and human studies, arrhythmias were associated with the emergence of circumferential velocity components and higher amplitudes.
I. INTRODUCTION
There is an omnipresent electrophysiological activity in the stomach, termed gastric slow waves. The periodic occurrence and propagation of gastric slow waves coordinate the motility of the stomach during digestion. The onset of gastric slow wave arrhythmia has been highlighted as a potential contributor to a number of gastric disorders, including gastroparesis, dyspepsia, and gastroesophageal reflux disease [1]. Recent high-resolution (HR) mapping studies of gastric slow waves in canines have revealed complex arrhythmic activation patterns such as premature slow waves, single aberrant slow waves, bursts, regular tachygastria, and irregular tachygastria [2]. HR mapping studies using printed-circuit-board (PCB) electrode arrays have also recently been conducted in pig and human subjects [3], [4], [5]. To date, the location and propagation of arrhythmic episodes from the published studies have generally been visually assessed and entire cycles treated as either normal or arrhythmic [2]. However, visual assessments of arrhythmic activities are time consuming and subjective, and may be inaccurate because a cycle (the slow wave activities belonging to the wave grouping) with arrhythmia may also contain areas of normal slow wave activity. Therefore, a method of automatically identifying the arrhythmic slow wave activities is required.
II. RECORDING METHOD
The analysis was performed on previously recorded gastric slow waves from a normal pig, and a human patient with severe gastroparesis who underwent upper gastrointestinal (GI) surgery for a gastric stimulator implantation. The methods of recording were as described previously [4], [5]. Ethical approval for the animal study was granted by the University of Auckland Animal Ethics Committee, and ethical approval for the human study was granted by the University of Mississippi Review Committee. The International Guiding Principles for Biomedical Research Involving Animals and Human Subjects were followed. Briefly, the recording sessions followed a mid-line laparotomy on an anesthetized and intubated subject, exposing the anterior gastric serosal (outside) surface with minimal gastric handling. PCB electrodes (up to 256 electrodes; inter-electrode spacing: 7.62 mm for pig and 4 mm for human) were gently placed on the serosal surface of the stomach and held in place with gauze-packs soaked with warm saline solution, as previously described [3]. No suture was required to hold the electrodes in place. The slow wave signals were acquired using a passive, unipolar Biosemi ActiveTwo system. The acquisition system was connected to a Dell M1450 notebook computer via a fiber-optic cable. The sampling rate was set to 512 Hz.
III. ARRHYTHMIA ANALYSIS
A. Activation Times Identification
The slow wave signals were filtered using a Savitzky-Golay filter (Polynomial-order: 9; Window-size: 1.6 s). Slow wave activation times were identified using a Falling- Edge, Variable-Threshold (FEVT) detection method, which calculated the convolution of the signal and a falling-edge kernel, and used a time-varying threshold to detect the times when the convolved signals exceeded the threshold [6]. The identified activation times were partitioned into clusters of individual cycles of slow wave events using an established Region Growing Using Polynomial surface-estimate Stabilization (REGROUPS) method [7]. All of the identified and partitioned activation times were also screened visually to correct any automated errors.
B. Velocity Calculation
The velocity field was calculated from the activation times field using a finite-difference scheme with a Gaussian filter to eliminate any high frequency noise that may be amplified through the differentiation process. The velocity vector of each slow wave event was calculated using Eqn. 1.
| (1) |
where Vx and Vy denote the velocity components in the x and y coordinates of the electrode array, respectively; tx and ty denote and respectively. The orientation of each velocity vector was calculated using the following expression,
| (2) |
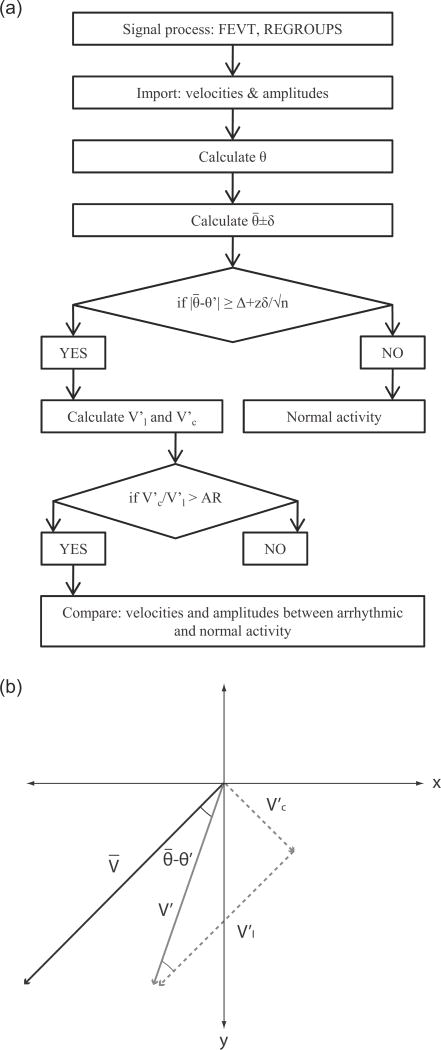
where θ is the angle of a normal velocity vector (Fig. 1). The variation of angles of the normal slow waves was quantified by calculating the standard deviation (δ) of the angles of all normal velocity vectors at each electrode for all normal slow wave cycles, which were used as the baseline activity for each study. Here, two key assumptions were made. First, the averaged angle of the normal slow wave velocity vectors (θ̄) at each electrode was assumed to be the orientation of the longitudinal axes, i.e., no circumferential component occurred during normal propagation away from the normal pacemaker region [4], [5]; Second, the circumferential direction was assumed to be perpendicular to the longitudinal direction at each electrode in the recording field.
Fig. 1.
Arrhythmic slow wave identification. (a) Flowchart of the identification algorithm. The orientation of the velocity was used as the indicator of arrhythmia. The angle of each velocity (θ) and the average angle of the normal activities ( ) was calculated. The standard-error-mean was calculated from the standard deviation (δ), number of events (n), and the z-value at 95% confidence interval. The threshold value was calculated by adding an offset value (Δ) to the standard-error-mean. (b) An identified arrhythmic velocity (V′) was decomposed into a longitudinal component ( ) and a circumferential component ( ), with the longitudinal direction defined by the direction of the normal velocity (V).
Each subsequent cycle of slow wave activity was compared to the baseline activity. The difference in angle of each velocity vector in the cycle (θ′), and was compared to a threshold, which was calculated to be 10°+95% confidence interval of the standard-error-mean (SEM) of the velocity vectors from the normal cycles (Fig. 1). An activity was deemed arrhythmic if |θ′ − | was greater than or equal to the threshold. The components of the arrhythmic velocity ( ), were then decomposed into the longitudinal component ( ) and the circumferential component ( ) of the arrhythmic activity as follows,
| (3) |
| (4) |
An additional anisotropy ratio (AR)-threshold, i.e., could also be used to identify arrhythmic velocity vectors with a relatively large circumferential component. An AR-threshold of 2.1 was used to define a slow wave activity with a dominant (as per a previous cardiac study [8]).
C. Statistical Analysis
Because each arrhythmic activity could be paired with a normal activity, a paired Student’s t-test was used to compare the averages of amplitudes and velocities of normal and arrhythmic activity at each electrode for every cycle that contained arrhythmic slow waves. A p-value < 0.05 was deemed statistically significant.
IV. RESULTS AND DISCUSSION
A. Pig Study
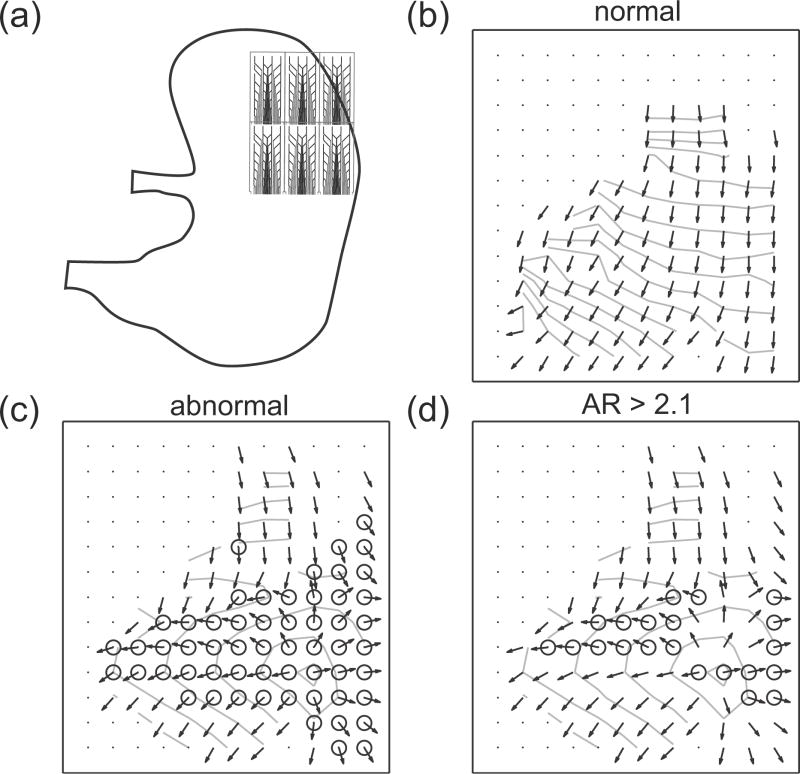
Gastric slow waves were recorded from the distal fundus and proximal corpus of the pig (Fig. 2a). Five cycles of regular antegrade gastric slow waves were used as baseline activity, i.e., all the slow waves in these cycles were deemed as normal slow wave activity. Arrhythmic activities in the form of ectopic slow waves in the corpus were identified in two further cycles. The onset of arrhythmia was spontaneous and followed the five cycles of normal activity. The average of activation times and velocities of the five normal cycles were computed (Fig. 2b) and compared to a cycle with arrhythmic slow waves without the AR-threshold (Fig. 2c) and with the AR-threshold (Fig. 2d).
Fig. 2.
Pig slow wave recording and identified arrhythmias. The inter-electrode distance is 7.62 mm. (a) The recording arrays were placed on the distal fundus and proximal corpus. (b) Averaged normal slow wave events. The arrows show the velocity field and the lines represent the isochrones at 1 s intervals. (c) Identified arrhythmic events (marked by circle) in a cycle which contained arrhythmia. (d) The arrhythmic events with anisotropy ratio (AR)-threshold ≥ 2.1.
On average, 92 out of 156 electrodes in the normal cycles recorded slow wave events (Fig. 2b). Most of the inactive electrodes were situated over electrically quiescent stomach regions (medial fundus and medial corpus) [4]. For the cycles that contained arrhythmic slow waves, on average, 57 electrodes per cycle were identified as being arrhythmic in terms of the orientation of the velocity vector. A summary of the pig study is presented in Table I.
Table I.
Pig Arrhythmia data.
| Wave 1 | Wave 2 | ||
|---|---|---|---|
| # of events ID’d (n) | 57 | 57 | |
| Amplitude (mV) | 0.58 vs 0.81* | 0.58 vs 0.78* | |
|
|
0 vs 7.40* | 0 vs 7.40* | |
|
|
6.64 vs 5.87 | 6.64 vs 5.87 | |
|
|
6.64 vs 10.25* | 6.64 vs 10.25* |
p-value < 0.05.
There was no statistically significant difference between V̄l and . The average of was 7.40 mm s−1 (no Vc in the normal activity as stated by the assumption of the normal activity). The average magnitude of was higher than V̄, i.e., magnitude of the normal activity, which also equals to (10.25 vs 6.64 mm s−1). The average of the amplitudes of the arrhythmic events was higher than the normal events (0.80 vs 0.58 mV, averaged from Table I).
B. Human Study
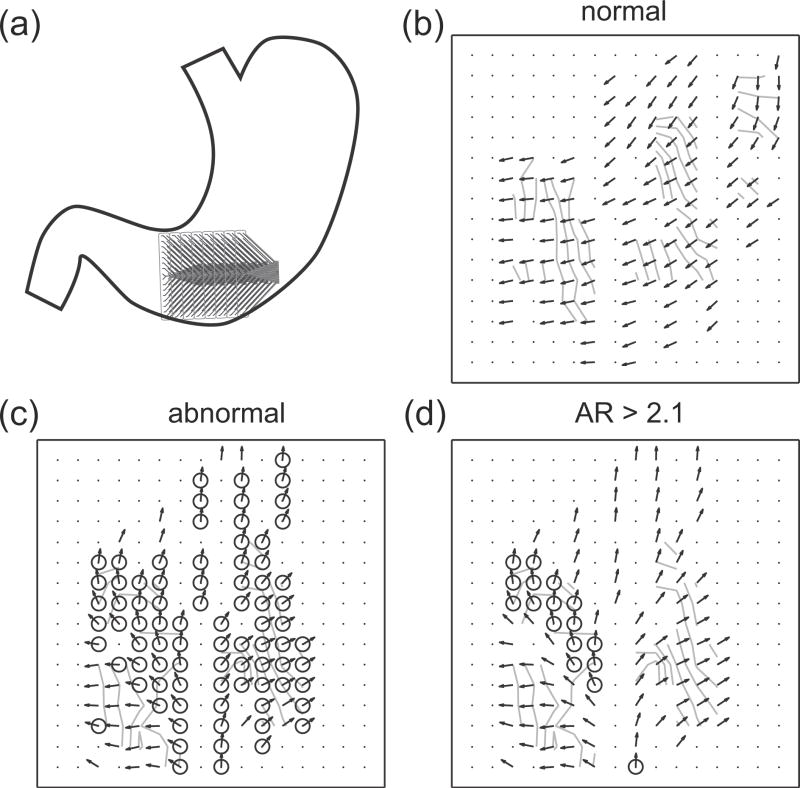
Gastric slow waves were recorded from the human corpus-antrum border (Fig. 3a). Three cycles of gastric slow waves were used as baseline activity. Arrhythmic activities in the form of retrograde propagation in the antrum were identified in three cycles of gastric slow waves. The onset of arrhythmia was spontaneous and followed the three cycles of normal activities. The average activation times and velocities of the three normal cycles were computed (Fig. 3b) and compared to a cycle with arrhythmic slow waves without the AR-threshold (Fig. 3c) and with the AR-threshold (Fig. 3d).
Fig. 3.
Human slow wave recording and identified arrhythmias. The inter-electrode distance is 4 mm. (a) The recording arrays were placed on the antrum-corpus border. (b) Averaged normal slow wave events. The arrows represent the velocity field and the lines represent the isochrones at 1 s intervals. (c) Identified arrhythmic events (marked by circle) in a cycle which contained arrhythmia. (d) The arrhythmic events with an anisotropy ratio (AR)-threshold ≥ 2.1.
On average, 121 out of 256 electrodes in the normal cycles recorded slow wave events; the inactive electrodes were mostly situated over the mesentery at the edges of the stomach border (bottom-right corner in Fig. 3a). For the cycles that contained arrhythmic slow waves, on average, 97 electrodes per cycles were identified as being arrhythmic in terms of the orientation of the velocity vector. A summary of the human study is presented in Table II.
Table II.
Human Arrhythmia Data.
| Wave 1 | Wave 2 | Wave 3 | ||
|---|---|---|---|---|
| # of events ID’d (n) | 102 | 83 | 107 | |
| Amplitude (mV) | 0.25 vs 0.36* | 0.27 vs 0.34* | 0.24 vs 0.37* | |
|
|
0 vs 2.46* | 0 vs 2.57* | 0 vs 2.59* | |
|
|
2.67 vs 3.79* | 2.54 vs 2.79* | 2.63 vs 3.11* | |
|
|
2.67 vs 5.11* | 2.54 vs 4.21* | 2.63 vs 4.57* |
p-value < 0.05.
All three arrhythmias registered slightly higher Vl′ than (3.21 vs 2.63 mm s−1, averaged from Table II). The average of Vc′ was 2.44 mm s−1. The average magnitude of was higher than V̄ (4.53 vs 2.63 mm s−1). The average of the amplitudes of arrhythmic events was higher than the normal events (0.25 vs 0.35 mV, averaged from Table II).
V. CONCLUSIONS
An automated method was developed to identify arrhythmic slow wave activity, with validation in a pig and human gastroparetic subject. A set of normal velocity vectors was used as the baseline activity, and the slow wave activity in each subsequent arrhythmic cycle from the same location on the stomach was compared to this baseline activity. The identification method eliminated the need to manually/visually identify arrhythmic activity from the normal activity in the same cycle, increasing the efficiency of identification and allowing an objective analysis. A potential important limitation of this algorithm was that it relied on the accuracy of the velocity calculation method. The physiological significance of the anisotropy ratio threshold requires further validation.
Future studies might also include comparisons of additional waveform characteristics, such as the slope ( ) of the slow wave activity, and larger sets of normal and arrhythmic activities should now be evaluated. The experimental data analyses described here have revealed an interesting and previously unknown finding that circumferential propagation emerges during gastric arrhythmia, and is associated with high amplitude and rapid propagation velocity, which awaits to be validated in a group of animal subjects. The increase in amplitude was also associated with increase in the magnitude of propagation velocity in both animal and human subjects. With the advent of high resolution mapping in patients and the automated identification method introduced here, this initial novel finding can be confirmed and expanded in more studies.
Acknowledgments
This work was supported by a University of Auckland Doctoral Scholarship, grants from the New Zealand Health Research Council, the U.S. National Institutes of Health (No. R01 DK64775), and the American Neurogastroenterology and Motility Society.
Contributor Information
Peng Du, Email: peng.du@auckland.ac.nz, Auckland Bioengineering Institute, The University of Auckland, NZ.
Greg O’Grady, Department of Surgery, Auckland Bioengineering Institute, The University of Auckland, NZ.
Niranchan Paskaranandavadivel, Auckland Bioengineering Institute, The University of Auckland, NZ.
Timothy R. Angeli, Auckland Bioengineering Institute, The University of Auckland, NZ
Christopher Lahr, Division of Digestive Diseases, University of Mississippi Medical Center, Jackson, MS, USA.
Thomas L. Abell, Division of Digestive Diseases, University of Mississippi Medical Center, Jackson, MS, USA
Leo K. Cheng, Auckland Bioengineering Institute, The University of Auckland, NZ
Andrew J. Pullan, Department of Engineering Science, Auckland Bioengineering Institute, The University of Auckland. The Riddet Institute, NZ; Department of Surgery, Vanderbilt University, Nashville, TN, USA
References
- 1.Parkman HP, Hasler WL, Barnett JL, Eaker EY. Electrogastrography: a document prepared by the gastric section of the American Motility Society Clinical GI Motility Testing Task Force. Neurogastroenterol Motil. 2003;15:89–102. doi: 10.1046/j.1365-2982.2003.00396.x. [DOI] [PubMed] [Google Scholar]
- 2.Lammers WJ, Ver Donck L, Stephen B, Smets D, Schuurkes JA. Focal activities and re-entrant propagations as mechanisms of gastric tachyarrhythmias. Gastroenterology. 2008;135:1601–11. doi: 10.1053/j.gastro.2008.07.020. [DOI] [PubMed] [Google Scholar]
- 3.Du P, O’Grady G, Egbuji JU, Lammers WJ, Budgett D, Nielsen P, Windsor JA, Pullan AJ, Cheng LK. High-resolution mapping of in vivo gastrointestinal slow wave activity using flexible printed circuit board electrodes: methodology and validation. Ann Biomed Eng. 2009;37:839–46. doi: 10.1007/s10439-009-9654-9. [DOI] [PMC free article] [PubMed] [Google Scholar]
- 4.Egbuji JU, O’Grady G, Du P, Cheng LK, Lammers WJ, Windsor JA, Pullan AJ. Origin, propagation and regional characteristics of porcine gastric slow wave activity determined by highresolution mapping. Neurogastroenterol Motil. 2010;22:e292–300. doi: 10.1111/j.1365-2982.2010.01538.x. [DOI] [PMC free article] [PubMed] [Google Scholar]
- 5.O’Grady G, Du P, Cheng LK, Egbuji JU, Lammers WJ, Windsor JA, Pullan AJ. Origin and propagation of human gastric slow-wave activity defined by high-resolution mapping. Am J Physiol Gastrointest Liver Physiol. 2010;299:G585–92. doi: 10.1152/ajpgi.00125.2010. [DOI] [PMC free article] [PubMed] [Google Scholar]
- 6.Erickson JC, O’Grady G, Du P, Obioha C, Qiao W, Richards WO, Bradshaw LA, Pullan AJ, Cheng LK. Falling-edge, variable threshold (FEVT) method for the automated detection of gastric slow wave events in high-resolution serosal electrode recordings. Ann Biomed Eng. 2010;38:1511–29. doi: 10.1007/s10439-009-9870-3. [DOI] [PMC free article] [PubMed] [Google Scholar]
- 7.Erickson JC, O’Grady G, Du P, Egbuji JU, Pullan AJ, Cheng LK. Automated gastric slow wave cycle partitioning and visualization for high-resolution activation time maps. Ann Biomed Eng. 2010;39:469–83. doi: 10.1007/s10439-010-0170-8. [DOI] [PMC free article] [PubMed] [Google Scholar]
- 8.de Diego C, Chen F, Xie Y, Pai RK, Slavin L, Parker J, Lamp ST, Qu Z, Weiss JN, Valderrabano M. Anisotropic conduction block and reentry in neonatal rat ventricular myocyte monolayers. Am J Physiol Heart Circ Physiol. 2011;300:H271–8. doi: 10.1152/ajpheart.00758.2009. [DOI] [PMC free article] [PubMed] [Google Scholar]


