

Abstract
In albino mammals, lack of pigment in the retinal pigment epithelium is associated with retinal defects, including poor visual acuity from a photoreceptor deficit in the central retina and poor depth perception from a decrease in ipsilaterally projecting retinal fibers. Possible contributors to these abnormalities are reported delays in neuronogenesis (Ilia and Jeffery, 1996) and retinal maturation (Webster and Rowe, 1991). To further determine possible perturbations in neuronogenesis and/or differentiation, we used cell-specific markers and refined birth dating methods to examine these events during retinal ganglion cell (RGC) genesis in albino and pigmented mice from embryonic day 11 (E11) to E18. Our data indicate that relative to pigmented mice, more ganglion cells are born in the early stages of neuronogenesis in the albino retina, although the initiation of RGC genesis in the albino is unchanged. The cellular organization of the albino retina is perturbed as early as E12. In addition, cell cycle kinetics and output along the nasotemporal axis differ in retinas of albino and pigmented mice, both absolutely, with the temporal aspect of the retina expanded in albino, and relative to the position of the optic nerve head. Finally, blocking melanin synthesis in pigmented eyecups in culture leads to an increase in RGC differentiation, consistent with a role for melanin formation in regulating RGC neuronogenesis. These results point to spatiotemporal defects in neuronal production in the albino retina, which could perturb expression of genes that specify cell fate, number, and/or projection phenotype.
Keywords: albino, biotinylated dextran amine, bromodeoxyuridine, cell cycle, flow cytometry, Islet1/2, melanin, neuronogenesis, neurogenesis, phenylthiourea, retinal ganglion cell, retinal pigment epithelium, thymidine, ventricular zone
The retina of albino mammals displays a reduction of photoreceptors and a decrease in uncrossed retinal fibers, the latter resulting in miswiring in visual targets in the lateral geniculate nucleus and visual cortex (Guillery, 1986). A mutation in the gene encoding tyrosinase, the primary melanogenic enzyme in pigment cells, is responsible for the visual system defects in albinism. The question of how the lack of melanin formation in the retinal pigment epithelium leads to these abnormalities remains unanswered. Developmental perturbations such as a delay in retinal fiber outgrowth (Kliot and Shatz, 1985), retinal maturation (Webster and Rowe, 1991), or retinal neuronogenesis (Ilia and Jeffery, 1996) have been postulated as the basis for later defects. By contrast, the immature albino retina is reported to have more cells (Webster and Rowe, 1991) and more mitotic profiles (Ilia and Jeffery, 1999) than the pigmented retina.
Several lines of evidence point to perturbations in the neural retina for the retinal axon crossing abnormalities in albinism (Chan et al., 1993; Marcus et al., 1996; Ilia and Jeffery, 1999). In vitroexperiments show that when retinal ganglion cell (RGC) neurites from ventrotemporal (VT; ipsilaterally projecting) retina of albino animals are confronted with chiasm cells, they display properties more like those of contralaterally projecting axons, suggesting a respecification from an uncrossed to a crossed phenotype (Marcus et al., 1996).
Ipsilateral RGCs have a shorter period of generation [embryonic day 11 (E11)–E16] than contralaterally projecting neurons (E11–E19) (Dräger, 1985a). An alteration in the number of cells born on each day of retinal neuronogenesis could bias the production of neurons in favor of a different cell type (Dyer and Cepko, 2001), or one subpopulation of RGCs. Progenitors misplaced in space or time would lose the competence to adopt an uncrossed phenotype, or, alternatively, a putative signal directing the development of this phenotype would not be present (McConnell, 1995).
The links between perturbation in neuronogenesis and specification of crossing behavior at the midline of the optic chiasm are unknown. Studies in cerebral cortex indicate that cell cycle parameters change during the neuronogenetic interval, the length of the cell cycle (Tc) increasing over time; similar changes have been reported in the retina (Alexiades and Cepko, 1996). In both neocortex and retina alterations in cell cycle parameters parallel changes in the classes of neurons, in terms of layer-specific destinations, that are produced (Alexiades and Cepko, 1996; Cepko et al., 1996; Takahashi et al., 1996, 1999). Although variation in the projection of different cortical layers is not strictly analogous to the binary decision of RGC axons to cross or avoid the midline, analyzing neuronogenesis in the albino retina could elucidate whether changes in neuronogenesis relate to respecification of the crossing phenotype.
Here we test the hypothesis that a change in the time of onset and spatial features of neuronogenesis (birth dates), rate of proliferation (Tc), and rate of neuron production (output) might underlie the altered ratios of crossed vs. uncrossed fibers in albinism. First, we assessed timing of onset of RGC production and potential alterations in RGC positioning in the albino. We then determined birth dates of RGCs with uncrossed axons and undertook a quantitative analysis of cell cycle parameters in embryonic pigmented and albino retina. Finally, we directly tested the role of pigment in regulating cell production in isolated eyecups. Together, the results from these complementary experimental approaches confirm that the absence of pigment in albino retina results in spatiotemporal perturbations of RGC production.
MATERIALS AND METHODS
Animals
Mice of the C57BL/6J strain carrying theTyrc2J mutation were obtained from The Jackson Laboratory (Bar Harbor, ME) and housed in a timed-pregnancy colony maintained at Columbia University under conditions and protocols approved by the Animal Care and Use Committee. TheTyrc2J allele arose spontaneously in the C57BL/6J mouse colony at the Jackson Laboratory (Green, 1973) and is thus coisogenic with the C57BL/6J mice used in this study as pigmented controls. The mutation is a substitution at codon 77 in the first exon and yields no detectable tyrosinase protein (Le Fur et al., 1996). Pigmented and albino embryos were generated from crosses betweenTyr+/Tyrc2J×Tyrc2J/Tyrc2Jmice. Mendelian ratios predict that such litters will contain 50% pigmented animals (Tyr+/Tyrc2J) and 50% albino animals (Tyrc2J/Tyrc2J). Previous studies have shown that pigmented animals of bothTyr+/Tyrc2Jand Tyr+/Tyr+genotypes have indistinguishable retinal phenotypes, despite the fact that heterozygotes have half the level of tyrosinase activity (LaVail et al., 1978). Moreover, whereas “pigmented” and “albino” are phenotypic descriptors, for clarity of presentation we use the terms to refer to pigmented and albino animals of the genotypesTyr+/Tyrc2JandTyrc2J/Tyrc2J, respectively. Albino and pigmented embryos can be distinguished as early as E11 by the presence of pigment in the pigment epithelium, where the day of conception (E0) is determined by the presence of a vaginal plug.
The sizes of embryos from a litter of a given gestational age vary, and because of the tight correlation between eye development and embryo maturation from ∼E11–E13 (Theiler, 1972), slight increases in embryonic weight are associated with concomitant retinal growth. Thus, to obtain closely timed embryos, animals were weighed and/or staged, and individual comparisons between pigmented and albino embryonic retinas were based on stage and weight rather than just the gestational age of the litter. The data presented here are based on analysis of eyes from ∼60 litters at E10–E16.
Assessment of retinal ganglion cell neuronogenesis
Bromodeoxyuridine (BrdU), a thymidine analog, was used to label proliferating cells in three different protocols: (1) in combination with anti-Islet antibodies, (2) in combination with dextran retrograde labeling of RGC axons, for identification of ipsilaterally projecting RGCs, and (3) in combination with3H-thymidine (3H-dT), for cell cycle analysis (Hayes and Nowakowski, 2000).
Double-label BrdU
The length of the cell cycle (Tc) and length of S phase (Ts) in mouse retina at E12, E14, E16, and E18 were estimated by extrapolation from the literature (Denham, 1967; Sinitsina, 1971; Carter-Dawson and LaVail, 1979; Young, 1985a; Alexiades and Cepko, 1996). In an attempt to label all proliferating cells, timed-pregnant dams at each of these ages received two injections of BrdU (100 μg/gm) intraperitoneally at the defined interval, Tc-Ts (Table 1).
Table 1.
Extrapolated cell cycle parameters in embryonic mouse retina
| Age (embryonic) | Ts (hr) | Tc (hr) | Tc-Ts |
|---|---|---|---|
| E12 | 7.2 | 13.9 | 6.7 |
| E14 | 8.4 | 17.7 | 9.3 |
| E16 | 10.0 | 21.5 | 11.5 |
| E18 | 13.0 | 25.4 | 12.4 |
These two injections are sufficient to label all proliferating cells as long as Tc-Ts is not significantly longer than Ts. To standardize the procedure, the first injection was made as close as possible to 11:00 A.M. Forty hours after the second injection, dams were anesthetized with ketamine–xylazine, and the embryos were removed by hysterotomy, rinsed in phosphate buffer, and fixed in 4% paraformaldehyde for 2–16 hr. It is assumed that BrdU labeling will remain detectable through two or three divisions.
Immunohistochemistry and tissue processing. From one mixed litter at each age, which included two to five animals of each genotype, the right retinas were dissected out, and the ventral pole was marked with a radial cut. Tissue was treated with 2N HCl and 1% Triton X-100 for 30 min at 37°C to denature the DNA. After a 10 min rinse in 0.1 m borate, blocking solution was added for 1 hr (10% normal goat serum, 2% bovine serum albumin, and 1% Triton X-100 in Tris-buffered saline). Tissue was incubated in guinea pig anti-Islet1/2 (1:10,000; a gift of Tom Jessell, Columbia University) and mouse anti-BrdU (1:2; Amersham or 1:4000; IU4, Caltag) for 2 d at 4°C and in secondary antibodies Cy3-conjugated goat anti-guinea pig 1:600 (Jackson ImmunoResearch, West Grove, PA), or FITC-conjugated goat anti-mouse 1:100 (Sigma, St. Louis, MO) overnight at 4°C.
Additional antibodies used to assess early phases of RGC differentiation include anti-Brn3b (1:300; Babco, Berkeley, CA), anti-doublecortin (1:300; a gift of Christopher Walsh, Harvard University), and anti-Otx2 (1:2000; a gift of Giorgio Corte, University of Genova).
Confocal microscopy and data analysis. After immunostaining, the retinas were flat-mounted with the ventral pole oriented downward, and a 2.5× camera lucida drawing was made of each retina. Four to twelve 0.1 mm2 fields (40× objective) per retina were imaged at both 568 nm (Islet-Cy3) and 488 nm (BrdU-FITC) using a Zeiss laser-scanning microscope. The approximate location of each field was marked on the camera lucida drawing for orientation purposes. Fields were chosen to allow sampling of each retinal quadrant. For E12–E14 retinas, one 40× field on the Zeiss confocal microscope covered an entire retinal quadrant, and thus four fields (one per quadrant) were imaged and analyzed; at later time points up to 12 randomly selected fields per retina were analyzed. Within each 0.1 mm2 field, a series of five images was taken in the z-plane at intervals of 5 μm, starting at the top of the ganglion cell layer. Confocal images were opened in NIH Image and individual Islet- and Islet/BrdU-positive cells counted with the “analyze particles” protocol (minimal particle size 20 pixels at 72 dpi resolution and 40× magnification). All of the RGCs that were proliferating at the time of the BrdU injection and have become postmitotic within the ∼40 hr before killing are BrdU labeled. Right eyes were used in all experiments, except at E12, for which time point both eyes were examined. The number of eyes analyzed per genotype at each time point ranged from 2 to 7.
BrdU labeling of ipsilaterally projecting RGCs
Three injections of BrdU (Sigma; 100 μg/gm body wt) were given sequentially 4 hr apart on 1 d of embryogenesis from E11 to E17. Dextran labeling was performed on E17 or E18 embryos using a technique modified from one used for adult rodents (von Bohlen und Halbach, 1999). Briefly, the embryo was decapitated in artificial CSF (aCSF), and the optic tract was exposed by removal of the hard palate. A pinch of 6000 molecular weight (MW) rhodamine-conjugated, lysine-fixable dextran (Molecular Probes, Eugene, OR) was applied to the severed optic tract, the tissue was incubated in oxygenated aCSF for several hours at room temperature, then transferred to fresh aCSF overnight at 4°C, followed by immersion fixation in 4% PFA overnight. After rinsing in phosphate buffer, each ipsilateral retina was dissected out and marked with an orienting cut at the ventral pole. Antibody staining for BrdU was as described above for RGC birth dating. Each retina was then flat-mounted and coverslipped with Gelmount.
Data analysis. Dextran-positive cells in the ipsilateral VT crescent were imaged by confocal microscopy. In the x-yplane, two to five fields of 0.1 mm2 were imaged per retina. Within each field, three z-plane optical sections were imaged at 7 μm intervals, ensuring visualization of dextran-labeled RGCs throughout the depth of the RGC layer. Individual fields from each retina were composited in Adobe Photoshop, and single (dextran-positive) and double (dextran- and BrdU-positive) cells were counted by hand. Results are from 52 individual pigmented animals injected with BrdU between E11 and E17 and from 30 albino animals injected between E11 and E16. The percentage of ipsilateral cells born on each day was represented by the ratio of dextran–BrdU double-labeled cells to all dextran-labeled cells. This method, expressing the number of double-labeled cells as a fraction of all dextran cells imaged, was necessary to ensure that we did not introduce variation by including different numbers of dextran-positive cells per retina.
Fluorescence-assisted cell sorting analysis
Retinas from E13 litters containing two to six embryos of each genotype were dissected, separated into pigmented and albino pools, and dissociated with papain for 40 min at 37°C, followed by gentle trituration to generate a single cell suspension. After centrifugation at 800 × g for 6 min, cells were resuspended in PBS with 1% BSA (PBS–BSA). Paraformaldehyde was added to a concentration of 0.25% for 1 hr. After centrifugation as above, cells were permeabilized by incubation in 0.1% Tween 20 in PBS–BSA (Schmid et al., 1991). Nuclei were labeled with anti-Islet antibody (and FITC-conjugated secondary), and with propidium iodide (PI) staining of DNA and resuspended at 0.5–1.0 × 10⁶ cells/ml according to published protocols (Clevenger et al., 1985; Beisker et al., 1987). Analysis was performed on a Coulter flow cytometer. Results for Islet-PI at E13 represent data from three separate litters.
Double labeling with tritiated thymidine and BrdU
Timed pregnant females (E11, E12, and E13) received a single, intraperitoneal injection of tritiated thymidine (3H-dT; 10 μg/gm body weight; S.A. 70–90 Ci/mm; NEN, Boston, MA) at noon on the day of the experiment followed 2 hr later by a single injection of BrdU (Sigma; 50 μg/gm body weight). Thirty minutes after the BrdU injection, the animals were deeply anesthetized with 4% chloral hydrate. The embryos were collected by hysterotomy and immersion-fixed in 4% PFA for 24 hr. After being weighed and staged according to the criteria of Theiler (1972), embryos were embedded in paraffin and sectioned serially at 4 μm in the horizontal plane to allow visualization of both nasal and temporal retina in the same section. All sections were mounted on glass slides pretreated with 3-aminopropyl-triethoxysilane (Rentrop et al., 1986) and processed for BrdU immunohistochemistry and 3H-dT autoradiography (Hayes and Nowakowski, 2000). BrdU was detected by a monoclonal antibody (Becton Dickinson, Mountain View, CA; 1:75) against single stranded DNA and visualized by horseradish peroxidase (ABC Elite; Vector Laboratories, Burlingame, CA) with 3,3′-diaminobenzidine (DAB; Sigma) as substrate. Slides were treated again with Histoclear, rehydrated, coated with Kodak (Eastman Kodak, Rochester, NY) NTB-2 Nuclear Track Emulsion (diluted 1:1 with distilled water), stored in light-tight boxes at −20°C for 3 weeks, developed for autoradiographic visualization of3H-dT, fixed, washed, and counterstained through the emulsion with 0.1% thionin.
Data analysis. Data was collected from both eyes of at least two albino and two pigmented littermates (when available, or from stage–weight-matched pairs) from each of at least two litters at each age (E11, E12, and E13). For each retina analyzed, the positions and labeling category (single-labeled by either tracer, double-labeled by both tracers and unlabeled) of all nuclei in at least three nonadjacent sections through and around the optic nerve head were recorded on camera lucida drawings made with the aid of a drawing tube (400×). At E11 and E12, all cells in the retina were drawn and analyzed, whereas at E13 drawings were restricted to the ventricular zone (VZ), defined by the position of the most abventricular-labeled nuclei. On all drawings, the VZ was parcellated into 50 μm sectors by measuring along the ventricular surface from the center of the optic nerve head to the periphery both nasally and temporally (see Fig.6C,D). Independently for each sector, counts of the nuclei of each type were recorded and used to calculate cell cycle parameters. The sectors were then numbered sequentially from peripheral nasal to peripheral temporal, allowing the retinas from animals of different genotypes and ages to be aligned in register with the center of the optic nerve head. Data from the sectors were also pooled into hemiretinas and into central and peripheral quadrants for analysis. Final analysis and graphs were done with Excel (Microsoft, Seattle, WA).
Fig. 6.
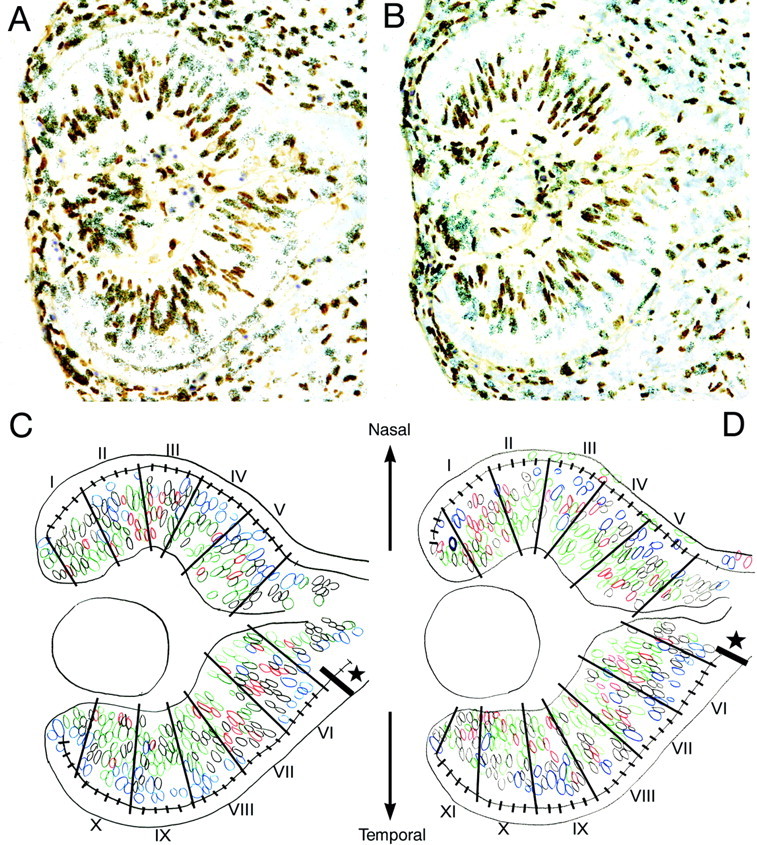
Sequential injection of two different S-phase labels allows determination of cell cycle parameters in small sectors of the retinal VZ that can be compared in different specimens based on alignment with the optic nerve head. E11 retina from pigmented (A) and albino (B) littermates which received sequential injections of 3H-dT and BrdU with a 2 hr interinjection interval and were killed 0.5 hr after the BrdU injection. Four-micrometer-thick horizontal sections were processed for immunohistochemical visualization of BrdU and for autoradiographic visualization of 3H-dT and were counterstained with thionin. The position and labeling category of all nuclei in all sections examined were recorded on corresponding camera lucida drawings made with a 40× objective at a final magnification of 550× (C,D:blue = 3H-dT only; red = BrdU only;green = double-labeled; black = unlabeled). The ventricular surface was measured nasally and temporally from the center of the optic stalk and parcelated into 50 μm sectors beginning from where the ventricular zone was at its full width (star) or at least 50 μm from the center of the optic stalk. Sector divisions were drawn parallel to the radial alignment of the nuclei, and sectors were numbered sequentially from peripheral nasal to peripheral temporal (I–XI). Counts of each type of nucleus were made and analyzed separately for each sector; nuclei touching the borders were included in the more central sector counts. Only complete 50 μm sectors were counted.
Calculation of Tc and Ts. With this labeling paradigm, cells that leave S during the 2 hr interinjection interval are labeled only by 3H-dT (NdT), and the proportion of these cells of the total proliferating population in the VZ (NdT/NTotal) equals 2/Tc. The total complement of BrdU-labeled cells (single or double labeled, NBrdU) is equivalent to the S-phase population, and their proportion of the total proliferating population (NBrdU/NTotal) is equal to Ts/Tc. Unlabeled nuclei are those cells that were outside of S-phase (G1/G0) throughout the duration of the experiment. The ratio of cells labeled only with 3H-dT (NdT) to those labeled with BrdU (NBrdU) is equal to (2/Tc)/(Ts/Tc), which reduces to 2/Ts; thus, this ratio (NdT/NBrdU) was used for the calculation of the length of the S-phase (Ts = 2/(NdT/NBrdU). Using this value for Ts, an estimate of Tc was made from the proportion of cells labeled with BrdU, Tca = Ts/(NBrdU/NTotal); this estimate is considered, however, to be an “apparent” estimate of Tc (hence, we refer to it as Tca). An actual estimate of Tc would require knowledge of the growth fraction (GF), which is the fraction of the analyzed population that is proliferating. Thus, Tc = Tca/GF. GF was not determined in these experiments. (For a full explanation of the analysis see Hayes and Nowakowski, 2000).
Eyecup culture
Litters of mice were collected by hysterotomy at E10 and E11. Eyecups from each fetus were removed by blunt dissection, including a small amount of surrounding mesenchyme to avoid damaging the thin outer layer of the retinal pigment epithelium (RPE). Dissected eyecups were placed into individual wells of Nunc (Roskilde, Denmark) 4-well dishes in 200 μl of serum-free medium (SFM; DMEM–F-12 with Sigma I-1884 supplement) (Wang et al., 1996) and cultured at 37°C in 5% CO2 for 24–48 hr.
Pharmacology and immunohistochemistry.Phenylthiocarbamide (PTC)– phenylthiourea (PTU), which blocks the action of tyrosinase, was used at 100–200 μm. These doses were chosen based on published literature (Slominski et al., 1989; Donatien and Orlow, 1995) and a dose–response test using 100, 300, and 500 μmPTU. A stock solution of 100 mm PTU was made up fresh in 100% ethanol, then diluted in SFM to the final concentration. An equal volume of vehicle alone was added to control cultures to ensure that low concentrations of ethanol (0.1% total volume) had no effect on the tissue. At the end of the culture period, the eyecups were fixed in 4% PFA for 1–2 hr at room temperature (RT) or overnight at 4°C, after which the eyecups were transferred to 0.1m phosphate buffer (PB). One day before cryostat sectioning, the PB was changed to 30% sucrose in PB. Eyecups were oriented to allow sectioning through the nasal-temporal axis of the retina. Sections were cut at 8 μm, and alternate sections were placed on separate slides. Sections on one set of slides were immunostained with antibodies as described above, except block and diluent were made with 0.1% Triton X-100. Primary antibody was incubated overnight at 4°C and secondary antibody incubation was for 1 hr at RT.
Data analysis. Labeled sections were photographed on a ZeissAxiophot using Tmax 400 film. Negatives were scanned into a Macintosh G3 as Photoshop documents, enlarged, and printed on single pages. Labeled cells were counted with a cell counter by an individual who was blind to the treatment conditions. Sections in which individual cells were not distinguishable, tissue appeared unhealthy, or staining was otherwise unclear were omitted from analysis. Some sections were lost because of the small surface area of the eyecups, making them susceptible to detachment from the glass slide during rinses. Data were analyzed and graphed using the statistical analysis program Prism (GraphPad Software Inc., San Diego, CA).
RESULTS
Onset of retinal ganglion cell genesis is similar in pigmented and albino retina
Single injections of BrdU and markers of early differentiation were used to label retinas of pigmented and albino embryos to determine whether pigmented and albino retinas have the same onset of RGC production. Islet genes are expressed in the nuclei of retinal ganglion cells both during embryonic development and in adulthood (Galli-Resta et al., 1997); in adult Islet1 is expressed by all RGCs, whereas Islet2 is present in ∼50% of RGCs (Brown et al., 2000). We used a guinea pig antibody raised to the homeodomain-C-terminal (25 kDa) part of the Islet 1 protein but that also recognizes Islet 2 with lower affinity (Tanabe et al., 1998), to localize the early differentiating RGCs in pigmented and albino embryos between E11.5 and 12.5. Hereafter, Islet is used to signify Islet1/2.
At E11, S-phase cells (BrdU-positive after short survival times) are found throughout the neural retinal portion of the eyecup, which is three to four nuclear diameters in thickness (Fig.1A,B). At E12, the region of proliferation remains ∼4 nuclear diameters thick, although the entire retina has expanded in circumference. In addition, in both albino and pigmented animals a central-to-peripheral gradient of differentiation first appears on E12 as a region of the dorsal, centralmost retina surrounding the future optic nerve head, which is BrdU-free and contains postmitotic, Islet-positive cells (Fig.1C,D, white cells; G,H, red cells).
Fig. 1.
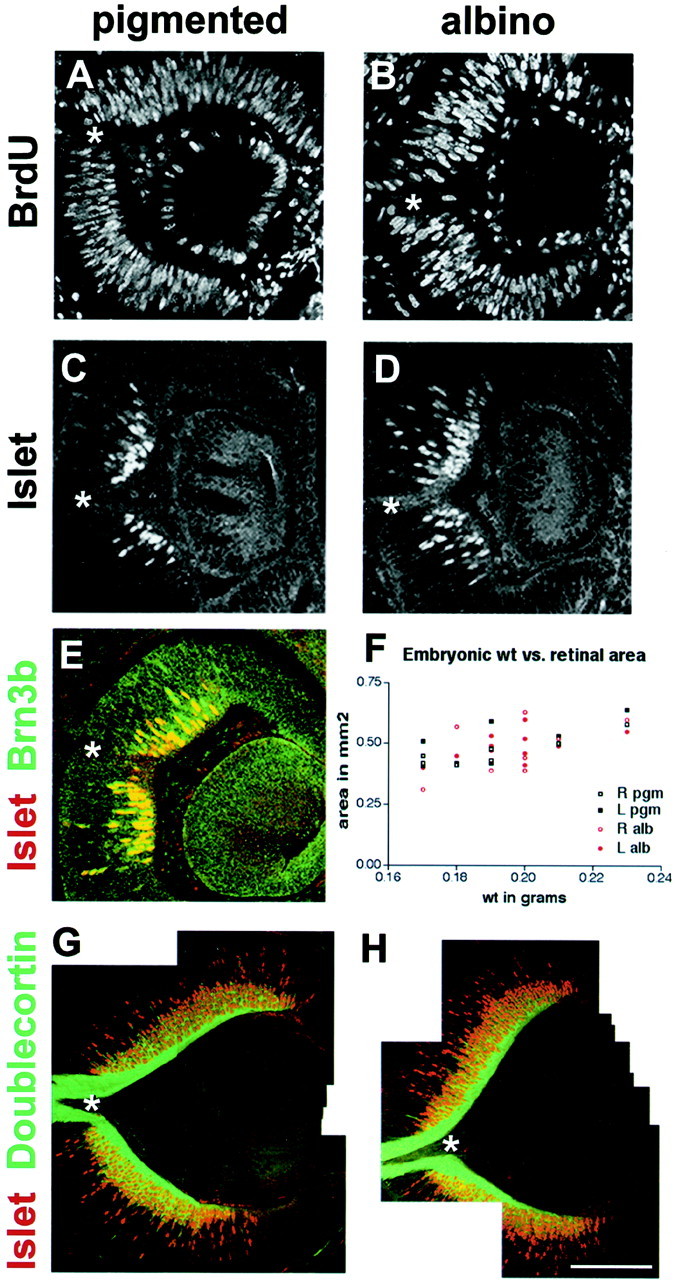
RGCs initiate proliferation and differentiation at the same time in pigmented and albino retina. Images are 1 μm confocal sections taken in the frontal plane from E11–E13 mouse retinas. Dorsal is up, and eyes are facing to theright. The optic nerve head is marked by anasterisk. Retinas from pigmented animals are shown inA, C, E, G; albino in B, D, H.A, B, A single injection of BrdU was given to pregnant females 5–30 min before litters were killed at E11. Cells labeled with an anti-BrdU antibody revealing that proliferation occurs robustly throughout the forming neural retina, whereas the centrally located lens has actively dividing cells only around its periphery. C, D, The initial region of postmitotic, Islet-positive ganglion cells develops centrally surrounding the future optic nerve head on late E11-early E12 in both pigmented and albino retina. E, Brn3b (green), another marker of RGCs, is expressed in the same retinal cells as Islet (red), with a similar time of onset. F, Among three E14 litters containing both pigmented and albino embryos, retinal area is correlated with embryonic weight. This graph demonstrates intralitter variation in embryonic size. G, H, Doublecortin is a microtubule-associated protein found in RGC axons. Along with Islet (red), doublecortin (green) is expressed at E13, when ganglion cells first send axons out of the retina. Scale bars: A–E, 100 μm; G, H, 200 μm.
This central region of differentiation expands outward as development proceeds and the retina expands (Fig. 1, compare C,D, andG,H), accompanied by a swift increase in the number of Islet-expressing cells. We observed variations in the pattern of Islet expression among animals of the same genotype within a given litter and sometimes between the left and right eyes of a single specimen (Fig. 1F). This was not surprising, both because ocular development proceeds rapidly from E11 to E13 (Theiler, 1972) and because embryos of a given litter may vary in age by ≥12 hr (Easter et al., 1993). However, by evaluating carefully stage-matched samples, we found no consistent difference in the onset of Islet expression between pigmented and albino retina (Fig.1C,D).
We also performed double labeling with antibodies to Islet1/2 and Brn3b, a POU family transcription factor expressed in a large subpopulation (∼70%) of RGCs during early retinal development (Xiang, 1998). Islet and Brn3b begin to be expressed at about the same time on late E11 and are primarily coexpressed (Fig.1E), indicating that Islet expression does reflect general RGC development.
To assess whether the timing of other aspects of differentiation, such as axon outgrowth, differed between albino and pigmented retina, we double-labeled E13 retinas with antibodies to Islet and doublecortin, a microtubule-associated protein expressed in postmitotic, migrating cells of the cerebral cortex and in RGCs (Gleeson et al., 1999). In developing retina, doublecortin is expressed in RGC soma and axons after cells reach the RGC layer. The onset of doublecortin expression in pigmented and albino embryos is indistinguishable. In both, ganglion cell bodies and nascent processes became doublecortin-positive on E12. Retinal fibers begin to exit the optic nerve head on E13, at which age strong immunoreactivity was observed in the RGC fiber layer and forming optic nerve (Fig. 1G,H, green fibers). Taken together, these analyses show that the first RGCs are generated late on E11 in both albino and pigmented retina and that the albino retina is not delayed in the expression of several markers of RGC differentiation.
Spatial organization of retinal ganglion cells is perturbed in albino retina
We next compared the pattern and configuration of cells in albino retina. The distribution, e.g., packing density and orientation, of Islet-positive RGCs in the albino retina was occasionally different from wild-type (note orientation of BrdU-positive cells in Fig. 1,A vs B). Starting at E11 and continuing through at least E16, these differences included smaller cell size and disorganized placement of cells (Fig. 2). These defects occurred in a large proportion of the albino animals (22 of 54 samples; 41%) in scattered locations throughout the retina, but were not observed in pigmented embryos (n = 77) (Fig.2). At E12, the dorsocentral retina, which contains the first RGCs to extend an axon out of the retina (Colello and Guillery, 1990, 1992;Marcus and Mason, 1995), is visible in sagittal en facesections of the retina as a dense region of Islet-positive RGCs (Fig.2A). In the albino retina, Islet-positive cells in this region are less tightly packed and appear to be distributed over a larger area (Fig. 2B). Serial sections through the depth of the retina reveal that this difference between pigmented and albino is consistent (data not shown). Differences in the packing and organization of RGCs persist over the following 2 d (Fig.2C,D). In sagittal sections on E14, the albino retina appears to have a wider layer of Islet-positive cells throughout the circumference of the retina, except for a relative decrease at the ventral pole (Fig. 2D, arrow). Further disruption of cellular organization is apparent with Islet labeling at E12 (Fig.2E,F) and at E16 (Fig.2G,H).
Fig. 2.
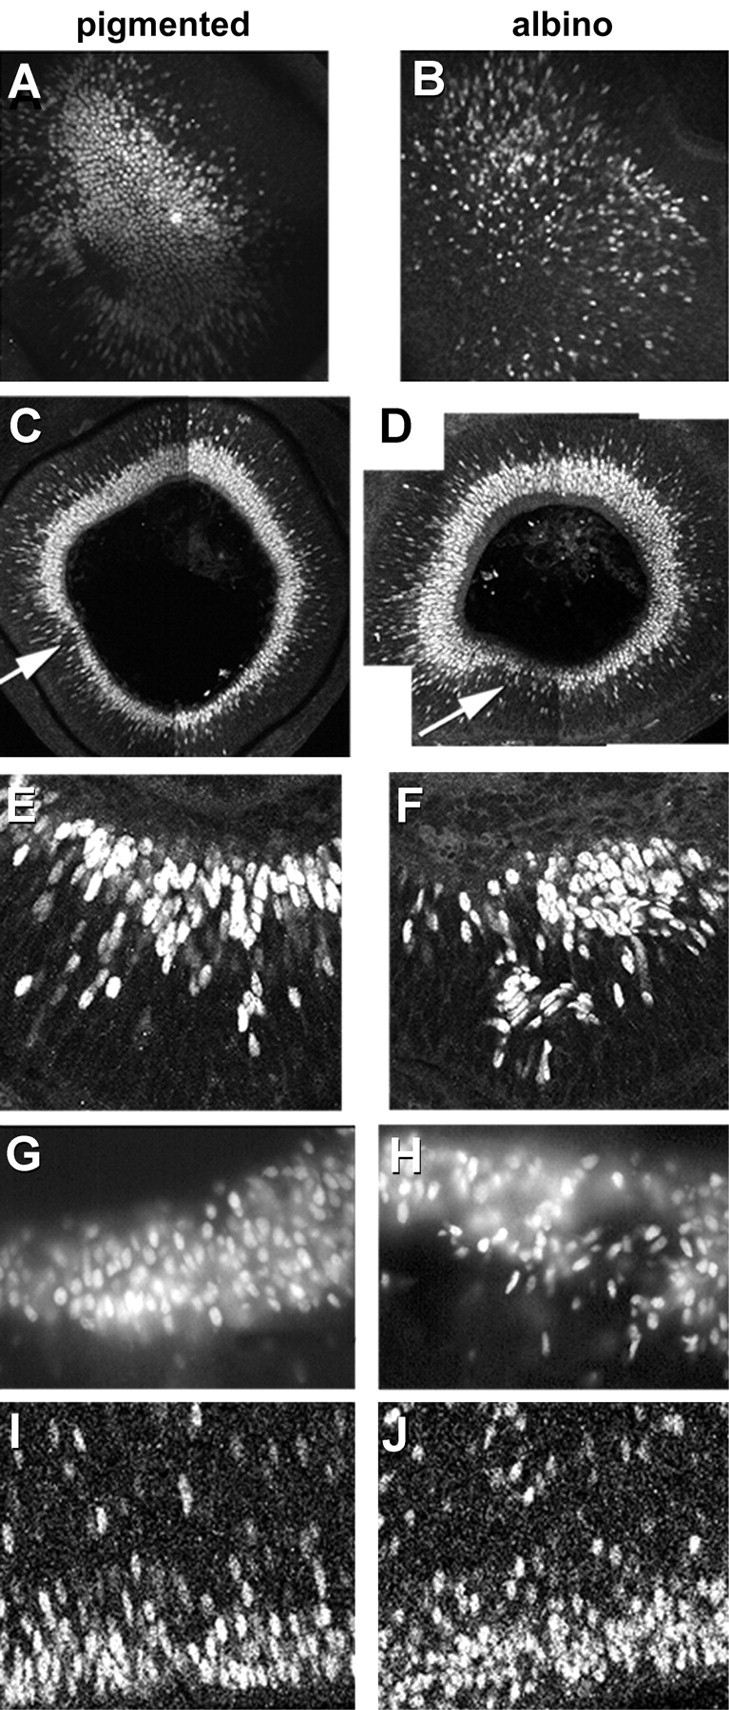
The embryonic albino retina displays abnormal cellular organization. Sagittal (A–D) or frontal (E–J) sections of embryonic pigmented (A, C, E, G, I) and albino (B, D, F, H, J) retinas were labeled with Islet antibody and imaged with confocal (A–F, I, J) or regular light (G, H) microscopy. Images were taken from 100 μm vibratome sections unless otherwise noted. A, B,En face or ophthalmoscopic views of the embryonic retina surrounding the optic nerve head demonstrate the position of the first Islet-positive RGCs at early E12. Dorsal is upward. Note that the distribution of labeled cells in the albino is less tightly packed and scattered over a wider area than in pigmented retina. At E14 (C, D), Islet-positive cells have accumulated circumferentially around the retina. An abrupt change in the thickness of the Islet-positive layer is apparent in both pigmented and albino samples (arrows). This change is more pronounced in the albino, which displays a thicker layer dorsal and a relative paucity of cells ventral to thearrow, compared with pigmented. In the albino retina, labeled cells lack the regular radial alignment seen in the pigmented samples. E, F, E12.0 retina in frontal section, labeled with an antibody against Islet 1/2, showing severe disruption of the ganglion cell layer in albino. Cells appear smaller and nuclei less oriented in the normal radial dimension.G, H, Cryostat sections of E16 retinal periphery reveal further examples of cellular disorganization.I, J, Otx2-positive cells in E16 retina are located just above the ventricular cleft separating the neural retina and the pigment epithelium (single layer of cells at the lower border). Notice the smaller size, greater number, and nonspecific orientation of Otx2-positive cells in the albino retina.
Otx2 is a transcription factor expressed by neuroblasts that give rise to all retinal cell types in the embryonic retina (Bovolenta et al., 1997). The nuclear profiles of Otx2-positive neurons near the ventricular zone appear irregular and oriented in multiple axes, rather than oval and oriented perpendicular to the plane of the ventricular zone (Fig. 2I,J), a feature that may be important in cell fate determination (Cayouette et al., 2001). Overall, these images provide evidence of perturbed cellular organization in the early development of the albino retina, which may reflect the quantitative differences in cell production described below.
More ganglion cells are produced during the initial period of neuronogenesis in albino mouse retina
To evaluate quantitatively differences in cell number suggested by sections shown in Figure 2, we performed BrdU birth dating of RGCs identified by Islet antibody on E12, E14, E16, and E18, and killed 40 hr later (Fig. 3). The number of Islet-positive cells was significantly greater in the albino retina, but only at the earliest time point examined [1514 ± 80 vs 1063 ± 117 (SEM) cells/0.1 mm2; unpaired t test; p = 0.0082] (Fig.3C, bars). At this same early time point (BrdU injected at E12, evaluation of the retina 40 hr later), more BrdU/Islet double-labeled cells were present in albino retina [542 ± 65 vs 398 ± 46 (SEM) cells/0.1 mm2], although this difference did not reach statistical significance (Fig.3C, lines and circles). Together, the data indicate that more RGCs are present during the early neuronogenetic period in albino retina.
Fig. 3.
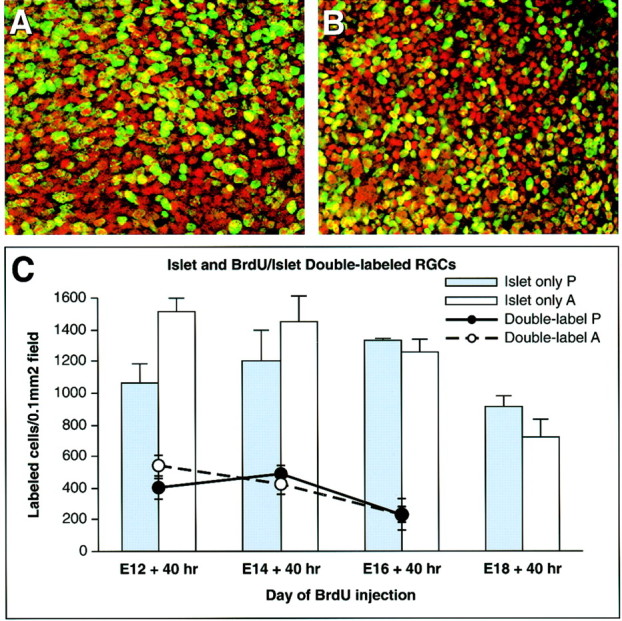
More ganglion cells are born during the first two days of neuronogenesis in albino compared with pigmented retina.A, B, Confocal images of whole-mount retinas injected with BrdU at E12 and killed at E14, from the data set quantitated below. Islet-positive cells (red) and BrdU-positive cells (green) in the albino (B) appear smaller and more numerous than in pigmented retina (A). C, Graph of Islet-positive cells (bars) and BrdU-positive cells within the Islet-positive RGC layer (lines) from litters injected with BrdU at E12, E14, E16, and E18 and killed 40 hr later, reflecting the average sum of cells in all five z planes (Islet) or the top two z planes (BrdU-Islet). The graph represents data from one mixed litter (pigmented and albino littermates) at each of the four ages and reflects the number of Islet- or BrdU/Islet-positive cells per 0.1 mm2 field, rather than the overall numbers of Islet-positive cells in the retina. In the albino retina, the density of all Islet-positive ganglion cells is increased at E14, and BrdU/Islet-positive ganglion cells (the subset of those Islet-positive RGCs labeled between E12 and E14) also show a trend toward increased density. At E18, the Islet counts probably include some amacrine cells, which begin to express Islet at this age, while RGCs continue to express it (Galli-Resta et al., 1997). Few BrdU-positive cells are found in the ganglion cell layer after injection at E18, so data for this time point were not included.
In albino retina, more ipsilateral retinal ganglion cells are born in the first days of neuronogenesis compared with pigmented retina
In pigmented mice, RGCs giving rise to uncrossed axons are born during a shorter period (E11–E16) than those giving rise to crossed axons (E11–E19) (Dräger, 1985b) and are mostly confined to the VT region of the retina. Thus, a locally altered pattern of cell production in albino retina specifically affecting VT retina could lead to a shift in the relative position of neurons and the specific time at which they were generated. To investigate whether perturbations exist that affect the timing of production and, putatively, specification of RGCs with uncrossed axons, we used rhodamine-conjugated dextran (6000 MW) to selectively identify ipsilaterally projecting RGCs in combination with BrdU labeling from E11 through E17.
When BrdU was injected on any day from E11 through E14, the percentage of ipsilateral cells (dextran filled on E17–E18) that were double-labeled with BrdU was greater in albino than in pigmented retina (Fig. 4, Table2). The greatest difference was after BrdU injection on E14, after which 45.3% of the dextran-labeled (ipsilateral) cells were double-labeled in the albino retina, and only 18.0% were double-labeled in pigmented retina (Table 2, Fig. 4A,B) (unpaired ttest; p = 0.0034). By contrast, when BrdU was injected on E15, 6.3% of the dextran-labeled (ipsilateral) cells were double-labeled in albino, and 7.3% were double-labeled in pigmented retina (Fig. 4C,D). The overall time course of ipsilateral RGC production demonstrated a sustained output in albino retina up to E14, in contrast with pigmented retina in which the peak of production occurred on E13 and tapered off gradually over the next 3–4 d (Fig.4E). Although the results of ipsilateral birth dating in wild-type animals shown here are in close agreement with previously published data on pigmented mice (Dräger, 1985a), we demonstrate for the first time a sustained early production of ipsilateral RGCs in the albino.
Fig. 4.
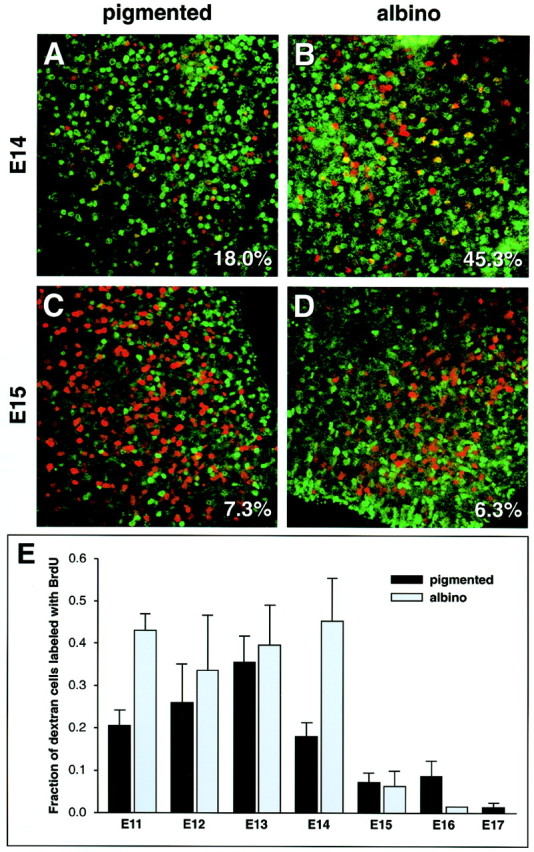
A larger fraction of ipsilateral RGCs in ventrotemporal retina is produced during the initial period of neuronogenesis in albino retina. A–D, Confocal images of whole-mount retina showing dextran retrograde-labeled ipsilateral RGCs (red) and BrdU-positive cells (green). These retinas were exposed to BrdU on E14 (A, B) or E15 (C, D) and injected with dextran into the ipsilateral optic tract on E17–E18. The fraction of all dextran-positive cells that are also BrdU-positive is shown in the bottom right corner of each panel. E,Quantitation of a larger data set, including the images shown inA–D. BrdU was injected on the day specified, and dextran labeling was performed on E17–E18. The graph shows the fraction of double-labeled RGCs after BrdU injection on the day indicated. Note that significantly more ipsilateral-projecting RGCs were labeled with BrdU on E11 and E14. Data from 52 pigmented and 30 albino animals are shown, and an average of 893 ± 80 (SEM) dextran-positive, ipsilateral-projecting cells were analyzed per retina.
Table 2.
BrdU–dextran double-labeled cells, as percentage of total dextran-labeled (ipsilateral-projecting) cells, after injecting BrdU on a specific embryonic day (Fig. 4)
| Date of BrdU injection | E11 | E12 | E13 | E14 | E15 | E16 | E17 |
|---|---|---|---|---|---|---|---|
| Pigmented | 20.6 | 25.9 | 35.6 | 18.0 | 7.3 | 8.8 | 1.4 |
| Albino | 43.0 | 33.6 | 39.6 | 45.3 | 6.3 | 1.5 | ND |
ND, Not determined.
Flow cytometry reveals no differences in cell cycle parameters in albino retina, but suggests that Islet expression in RGCs begins just before cell cycle exit
Previous studies have suggested a lengthening of the cell cycle throughout the neuronogenetic period in both cerebral cortex (Takahashi et al., 1995) and retina (Alexiades and Cepko, 1996). In addition, the early increase in ganglion cell production described above, measured both from an increase in the Islet-positive population, and from BrdU birth dating, could signify cell cycle changes, such as the proportion of cells exiting the cell cycle (Q fraction). Therefore, we compared embryonic pigmented and albino retina with respect to cell cycle parameters, using fluorescence-assisted cell sorting (FACS).
At E13, Islet antibody and propidium iodide were used to stain dissociated retinal cells that were then sorted by FACS into Islet-positive and Islet-negative populations. For each population, the percentage of cells in G0/G1, S, and G2/M phases was determined by the intensity of PI staining of DNA in each cell. In pigmented retina at E13, the majority of Islet-positive cells (86%) were in G0/G1 phase (Fig. 5A), whereas some of the Islet-positive cells were in S (7%) or G2/M (7%) phases. Among the Islet-negative cells at E13, most were in G0/G1 (60%), 23% were in S phase, and 17% in G2/M. Similar percentages for both Islet-positive and Islet-negative cells were found in albino retinas (Fig.5B). These data indicate that Islet expression likely begins as RGCs are in S phase of their terminal division and are in agreement with the onset of Islet expression in the retina on late E11 (Fig.1C,D). In summary, FACS analysis reveals no difference in cell cycle parameters between pigmented and albino retina but, importantly, indicates that Islet expression in RGCs begins just before cell cycle exit. This fact is especially pertinent to the data presented in Figures 1-3, in which Islet is used as an early marker of RGCs.
Fig. 5.
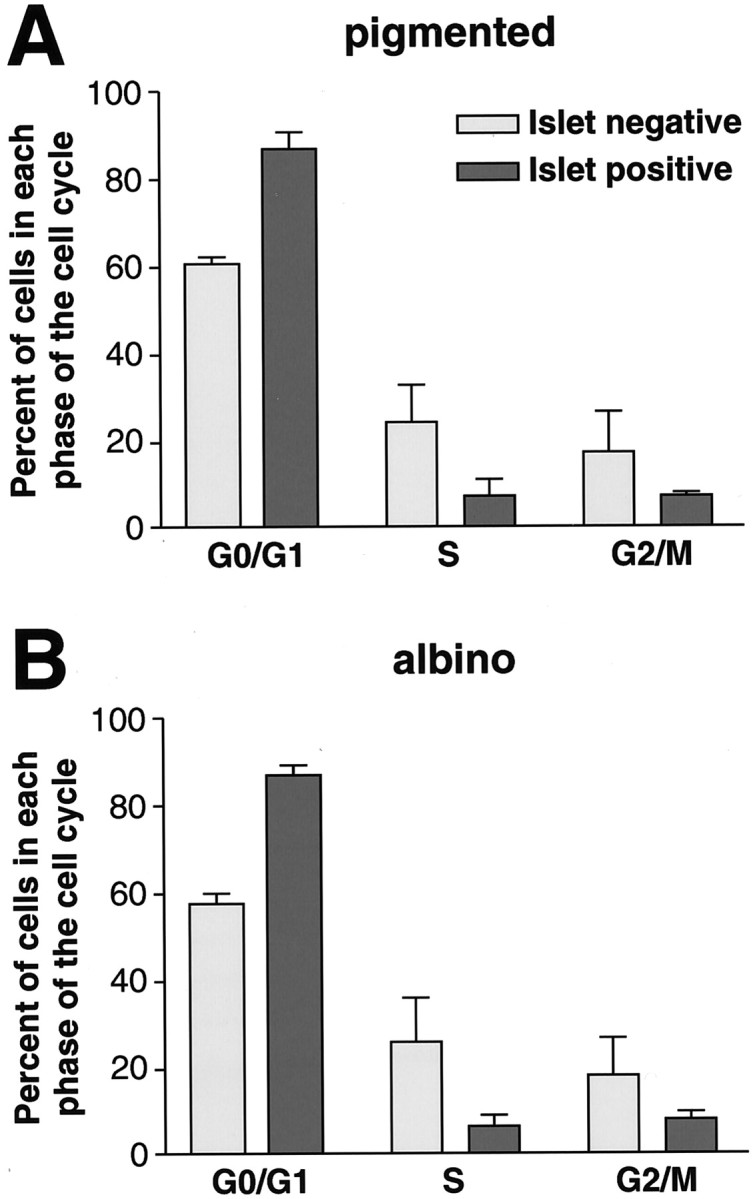
Flow cytometry shows no difference in cell cycle parameters in embryonic albino retina. Embryonic retinas were dissected at E13 and labeled with propidium iodide +/− Islet. DNA is labeled by propidium iodide in a quantitative manner, allowing cells in G0/G1 (2× DNA) to be separated from those in G2/M phases (4× DNA). For cycling cells, the percentage of cells in each phase of the cell cycle is proportional to the relative length of that phase. At E13, the neuroblastic fraction of cells (Islet-negative) has fewer cells in G1/G0 phase and more in S and G2/M phases than Islet-positive ganglion cells, suggesting that most Islet-positive cells have left the cell cycle. No differences were detected by flow cytometry in cell cycle parameters between pigmented (A) and albino (B) retina among either Islet-negative or Islet-positive cells. Between 10,000 and 80,000 cells were analyzed per genotype in each experiment, and each bar represents data from three experiments.
Regional analysis of cell cycle parameters using double S-phase labeling
A limitation of flow cytometry is that the method, as used above, averages results over the entire retina, and, therefore, may have obscured small but important differences between albino and pigmented animals in cell cycle parameters, perhaps restricted to one retinal area. We therefore used a double S-phase labeling technique that measures the lengths of the cell cycle (Tc) and its phases in anatomically definable regions in single specimens (Hayes and Nowakowski, 2000). This labeling technique provides a fine-grained spatiotemporal analysis of the total number of cells, proportion of cells in G0/G1, and values of Tc and the length of the S-phase (Ts) (Fig. 6A,B). To provide concurrent comparison in both the spatial and temporal dimensions, we subdivided the retinal VZ into relatively small (50 μm) regions (Fig.6C,D) and then aligned those regions in register with the center of the optic nerve head. This analysis revealed a number of differences between albino and pigmented retinas.
Albino temporal retina contains more cells than pigmented temporal retina
At all ages examined, the total population of the VZ in nasal retina of both genotypes was approximately the same. In contrast, the VZ of the temporal half of the albino retina contained a greater total number of cells on average than pigmented retina (Fig.7A, columns). The difference in the average number of cells was greatest at E11 (∼25%), declined to ∼11% at E12, and was small at E13 (∼3.8%). However, the width and packing density of the VZ in both genotypes was equivalent (Fig.6), and when the cell counts per 50 μm sector were plotted from peripheral nasal through peripheral temporal (Fig. 7C,E,G), the distribution of cells per sector was similar in pigmented and albino.
Fig. 7.

Quantitative analyses of cell numbers and distributions and Ts/Tc ratios in nasal and temporal retina at three embryonic ages. A, Average numbers of cells per 4-μm-thick section in nasal and temporal hemiretinas at E11, E12, and E13. Bars represent total number of cells in pigmented (shaded bar) and albino (white bar) retinas.Lines represent number of unlabeled cells in pigmented (closed circles) and albino (open circles). Differences between pigmented and albino are insignificant in nasal hemiretina. In temporal retina, the total number of cells in albino is significantly higher than in pigmented at E11 and E12, and that difference is primarily accounted for by a greater number of unlabeled cells. At E13 there is no significant difference between the genotypes. B, The Ts:Tc ratio decreases with developmental age in both pigmented and albinos. At E11 the Ts:Tca ratio is significantly lower in albino temporal hemiretina. There is no difference between the genotypes in the temporal retina at E12 or E13 or in nasal hemiretina at any age examined. C, E, G, Average total number of cells per 50 μm sector in albino (bars) and pigmented (circles) retinas at E11, E12, and E13. The graphs for all ages have been aligned in register with the optic nerve head and the sector numbers from E13 (from peripheral nasal I to peripheral temporal XXII) used throughout. The most striking difference is the additional sector at the temporal periphery of albino at E11 and E12. D, F,H, Percentage of pigmented (black bars) and albino (white bars) retinas which contain one or two additional sectors in the most peripheral part of the temporal retina at E11, E12, and E13. Counts were recorded only in those sectors present in each section; i.e., in computing average numbers per sector, the denominator was the number of sections in which each sector was present. Thus, although the average number of cells present in sector XXII at E13 was similar in the two genotypes when sector XXII was present (G), only 29% of pigmented retinas had this sector, whereas 83% of albino retinas did (H). This suggests that the peripheral growth of the retina is qualitatively similar in the two genotypes but takes place on a different time scale. ONH, Nerve head. Number of specimens included (n) for pigmented/albino: E11, 8/9; E12, 11/10;E13, 7/7.
The surface area of the temporal retina is larger in albino
Perhaps the most striking difference observed is that the surface area of the temporal retina was larger, accounting for the increase in number of cells in temporal retina. Of 52 retinas analyzed (26 pigmented and 26 albino), using as a baseline the number of 50 μm sectors present in all of the stage-matched pigmented retinas, 100% of the albinos had at least one additional sector in the temporal retina, but only 81% of the pigmented retinas had at least one additional sector. Moreover, 58% of the albino retinas had two additional sectors, but only 19% of the pigmented retinas had two additional sectors (Fig. 7D,F,H). Just as the cell numbers per temporal retina (Fig. 7A) show age-related changes, the presence of these additional sectors is age-related in both genotypes (Table 3). At E11, all retinas had at least four temporal sectors; five temporal sectors were present in 100% of the albino retinas and in 88% of the pigmented retinas, whereas six sectors were present in 67% of albinos and 13% of pigmented (Fig. 7C,D). At E12, all retinas had at least seven sectors; eight sectors were present in 100% of the albino retinas and 73% of the pigmented, whereas nine sectors were present in 30% of the albino retinas and 18% of the pigmented (Fig.7E,F). At E13, all retinas had at least nine sectors; 10 sectors were present in 100% of the albinos and 86% of the pigmented, whereas 11 sectors were present in 86% of albino retinas and 29% of pigmented (Fig. 7G,H). In addition, at E11 33% of albino retinas showed an additional sector in the peripheral nasal retina (Fig. 7C).
Table 3.
Incidence of extra 50 μm sectors at the periphery of temporal retina (Fig. 7)
| Age | Pigmented | Albino | ||||
|---|---|---|---|---|---|---|
| n | First extra sector % | Second extra sector % | n | First extra sector % | Second extra sector % | |
| E11 | 8 | 88 | 13 | 9 | 100 | 67 |
| E12 | 11 | 73 | 18 | 10 | 100 | 30 |
| E13 | 7 | 86 | 29 | 7 | 100 | 86 |
There are more cells in G1/G0 in albino temporal retina
The difference in total cell number (Fig. 7A, bars) is essentially accounted for by a greater number of unlabeled cells (Fig.7A, lines) in the albino. With the labeling paradigm used, the labeled cells are cells in S or G2/M, and the unlabeled cells are in either G1 or G0. Because in the developing retina, postmitotic nuclei (G0) are mingled with the proliferating population, in these specimens it cannot be determined directly whether unlabeled cells are in G1 or G0. Thus, the presence of a greater number of unlabeled cells in the albino retina relative to the pigmented retina of the same developmental stage is consistent with three distinct interpretations: (1) a longer Tc not associated with greater output (more cells in G1 only), (2) a larger and earlier output not associated with a lengthened Tc (more cells in G0 only), or (3) both a lengthening of Tc and an increased output (more cells in both G1 and G0).
There are no regional differences in the length of the S-phase (Ts) either across the retina or between albino and pigmented genotypes
The double S-phase labeling paradigm allows a direct measurement of Ts that is independent of both Tc and output. With a 2 hr interinjection interval, the ratio of the number of cells labeled by3H-dT only to the total number of cells labeled by BrdU is equal to 2/Ts (Hayes and Nowakowski, 2000). A plot of the measured value of Ts in each 50 μm sector from peripheral nasal to peripheral temporal was virtually flat at all 3 ages (data not illustrated). In addition, the average value of Ts across the retinal VZ showed little difference either between genotypes or at different ages (Table 4).
Table 4.
Average values of Ts in developing retina
| Pigmented (hr) | Albino (hr) | |
|---|---|---|
| E11 | 8.2 ± 0.4 | 8.3 ± 0.4 |
| E12 | 8.7 ± 0.3 | 9.2 ± 0.3 |
| E13 | 8.3 ± 0.3 | 8.6 ± 0.4 |
There are regional differences in the apparent length of the cell cycle (Tca) both across the retina and between albino and pigmented genotypes
The ratio of the number of BrdU-labeled cells to the total number of proliferating cells in the VZ approximates the Ts:Tc ratio. However, because of the uncertain status of unlabeled cells in the retinal VZ as G1 or G0, the size of the proliferating population is uncertain; consequently, the derived value of Tc must be considered an estimate or “apparent” Tc (Tca). Using the Ts and Tca values from pooled hemiretina data, the Ts:Tca ratio shows little absolute difference between nasal and temporal retina or between albino and pigmented nasal retina but is significantly lower for albino temporal retina at E11 (Fig. 7B), reflecting the greater number of unlabeled nuclei in albino. However, when the values of Tca in each 50 μm sector are plotted along the ventricular surface (Fig.8A–D) from peripheral nasal through the optic nerve head to peripheral temporal, regional differences between albino and pigmented become apparent: at E12 in both genotypes there is clearly a lengthening of Tca in a region of the central retina that extends ∼200 μm to either side of the optic nerve head (Fig.8B). The Tca lengthening at E12 is on the order of 35%, i.e., Tcain the peripheral retina is ∼15 hr, but in the central retina Tca is 20–25 hr. Importantly, this lengthening of Tca is also apparent at E11 in albino, but not in pigmented retina (Fig. 8A).
Fig. 8.

The Tca gradient across the retinal sheet is similar in contour but different in alignment with the optic nerve head in albino and pigmented genotypes at E11 and E12. The apparent Tc (Tca) in each 50 μm sector from peripheral nasal through the optic nerve head to peripheral temporal in albino (open circles) and pigmented (closed circles) retinas at E11 and E12. A lengthening of Tca to either side of the ONH is seen in both genotypes at E12 but in albino only at E11. A,B, When the curves are in register with the ONH, the “additional” segment in the temporal periphery of the albino retina is apparent. C, D, When registered with their peaks, the shapes of the curves of the two genotypes are remarkably similar, suggesting that in the two genotypes the Tc gradient across the retinal sheet is similar in magnitude and nasal-temporal extent but different with respect to the position of the ONH. In the pigmented retina, the Tc gradient appears to be approximately symmetrical around the ONH, whereas in albino the peak of the gradient is within the temporal retina. However, in both cases, the position of the peak from the temporal edge of the retina is similar. ONH, Nerve head. Number of specimens included (n) for pigmented/albino: E11,8/9; E12, 11/10; E13, 7/7.
The Tca gradient is similar in contour but different in alignment with the optic nerve head in albino and pigmented genotypes
When the same Tca data are plotted with reference to the peaks of the curves (Fig.8C,D) instead of the optic nerve head, i.e., by introducing a 50 μm shift, the two curves become remarkably similar, particularly at E12. This suggests that the regional variation in the cell cycle across the developing retina (i.e., the contour of the gradient) is almost identical in albino and pigmented animals but spatially different with respect to the position of the optic nerve. Specifically, in pigmented retina the region of longer Tca extends ∼200 μm to either side of the center of the optic nerve; in contrast, in albino retina the region of longer Tca extends only 150 μm into the nasal retina and 250 μm into the temporal retina (Fig.8D). Thus, in both albino and pigmented retina this area is 400-μm-wide, but it is distinctly asymmetrical with respect to the optic nerve in the albino retina. This suggests that the gradient of Tca lengths along the retinal sheet is similar in albino and pigmented animals; however, the gradient is not positioned relative to the optic nerve head but seems to be positioned with respect to the retinal periphery.
More postmitotic cells appear to be produced earlier in the temporal retina of albino than pigmented
When the average number of unlabeled cells per 50 μm sector is plotted from peripheral nasal through peripheral temporal retina (Fig.9A–C), several points are clear. First, at all ages the distribution of unlabeled nuclei exhibits a peak that falls off to either side of the optic nerve head. Second, the preponderance of the “additional” unlabeled cells in albino at E11 and E12 are distributed in two regions: the central part of the temporal retina as well as in the additional sectors located at the peripheral extremes of the temporal retina. The presence of “additional” unlabeled cells in the temporal periphery of the albino is dependent on the presence of the additional sectors; when those sectors are present in both, the average number of labeled and unlabeled cells does not differ significantly in albino and pigmented retinas (Figs. 7C,E,G, 9A–C). Third, consistent with the spatial shift of the Tca gradient in the albino at E11 and particularly at E12, the peak of the distribution of unlabeled cells in albino is temporal to the optic nerve head, whereas in pigmented retinas it is centered on the optic nerve head (Fig. 9A,B). Thus, in both genotypes, the peak distribution of unlabeled cells corresponds well with the timing and position of the lengthened Tca. A lengthening of Tc has been shown to correlate with increasing output of the proliferating population in the cerebral cortex (Takahashi et al., 1996). In addition, the distribution of this central concentration of unlabeled cells in albino at E12 also corresponds approximately to the location of the Islet-positive cells described above (Fig.1C,D,G,H). This suggests that in the central retina the lengthening of Tca is produced by a combination of an actual lengthening of Tc (and an associated increase in the number of G1 cells) and an increase in the number of G0 cells associated with an increased production of RGCs.
Fig. 9.

The events that distinguish the retinal proliferative population of albino and pigmented genotypes occur between E11 and E13 and involve both a lengthening of Tc and increased output from the proliferative population. A–C, Average number of unlabeled cells (G0/G1) per section in each 50 μm sector in albino (white bars) and pigmented (circles) retinas at E11, E12, and E13. The graphs for all ages have been aligned in register with the ONH and the sector numbers from E13 (from peripheral nasal I to peripheral temporal XXII) used throughout. The greater number of unlabeled nuclei temporal to the ONH in albino at E11 (B) and E12 (C) is consistent with the temporal “shift” if the Tca gradient seen in albino (Fig.10C,D). Counts were recorded only in those sectors present in each section; i.e., in computing average numbers per sector, the denominator was the number of sections in which each sector was present. D–F, Percentage of unlabeled cells in each sector of the VZ in albino (white bars) and pigmented (black bars) retinas at E11, E12, and E13. Thecircles indicate the differences (deltas) between albino and pigmented values. At Ell (D), the deltas are quantitatively different in nasal versus temporal retina, whereas at E12 and E13 (E, F) the delta values are similar in nasal and temporal retina (disregarding the “extra” segments).ONH, Nerve head. Number of specimens included (n) for pigmented/albino: E11,8/9; E12, 11/10; E13, 7/7.
The events that distinguish the retinal proliferative population of the pigmented and albino genotypes occur on E11 and E12
In the retinal VZ of both genotypes at E11 and E12, 30–50% of the cells are in S-phase at any time (i.e., Ts/Tc ≈ 0.3–0.5), and Ts is essentially constant across the retinal sheet, between genotypes, and at different ages (see above). Thus, the impact of relatively small, localized differences in the number of unlabeled cells (G1 and G0) on derived Tca values is likely to be less apparent against the biological background noise. A more precise analysis of changes in the G1/G0 population can be achieved by plotting the percentage of unlabeled cells in the retinal VZ in each of the 50 μm sectors (Fig. 9D–F, columns) and comparing the difference (albino minus pigmented) between the values (“deltas”) in the two genotypes (Fig. 9D–F, line). Already at E11 (Fig. 9D), the deltas are clearly different in the temporal versus nasal retina; in the nasal retina they hover around 0, whereas in temporal retina they average 4% (ignoring the additional peripheral sectors). Because the unlabeled cells are all either G1 or G0 and because E11 is before the appearance of any Islet-positive cells, it is reasonable to infer that the additional unlabeled cells in albino are in G1 and that the lengthened Tca (Fig. 8A,C) reflects an actual lengthening of Tc in albino, but not in pigmented retina. At E12, the deltas are fairly consistent across the retinal sheet, averaging 8% in nasal and 10% in temporal retina (Fig. 9E) (again, ignoring the additional peripheral sectors). Islet-positive cells are found in the central retina at this age, so it is reasonable to infer that in the central retina, the difference in the unlabeled population represents a mixture of Tc lengthening (G1) and increased output (G0). However, because the difference in percentage extends across the retina (Fig. 9E), peripheral to the region in which Islet-positive cells are found, it is also reasonable to infer that in the periphery the difference between albino and pigmented still reflects a lengthened Tc (more cells in G1), presumably in advance of output. At E13, the deltas across the retinal sheet again hover around 0 and actually slightly favor the pigmented (−1% in nasal and −2% in temporal retina) (Fig. 9F), suggesting that by E13 both Tc and output in the two genotypes have again come into register. Thus, the deviation of the deltas from zero at E11 and E12 but not at E13 indicates that the events which distinguish the retinal proliferative population in the albino from that of the pigmented mouse occur on E11 and E12 and involve both a lengthening of Tc and output from the proliferative population.
Blocking melanin formation in eyecups in vitro leads to an increase in the number of Islet-positive retinal ganglion cells
The results presented above indicate that spatial and temporal aspects of neuron production are altered in albino retina. Genetic analyses indicate that the visual system abnormalities in albino are closely associated with melanin production in the pigment epithelium (Guillery et al., 1973, 1987; Sanderson et al., 1974; LaVail et al., 1978; Rice et al., 1995). To explore a role for melanin in regulating neuronogenesis, we developed a simple in vitro system using isolated eyecups from pigmented animals and pharmacological inhibition of pigment production with PTU, which inhibits tyrosinase activity and thus melanin synthesis. We then assessed the effect of this treatment on the number of Islet-positive cells in the eyecups. Based on the data above (results in Figs. 3, 4, 7, and 8), we hypothesized that blocking melanin production in eyecups in vitro would result in an increase in the initial RGC production.
To determine the lowest effective dose of PTU in embryonic RPE, E10 and E11 eyecups were cultured for 1, 2, or 3 d in SFM with vehicle or with 100, 300, or 500 μm PTU (Fig.10A). Inhibition of melanin formation in the pigment epithelium was observed visually. In E10 eyecups, which are placed into culture before the onset of melanin formation, all concentrations of PTU inhibited the development of visible pigment. However, the highest concentration (500 μm) appeared to stunt retinal growth (data not shown). In eyecups placed into culture at E11, when melanin has already started to form, PTU reduced the amount of pigmentation in a dose-dependent manner but did not eliminate melanin already present; even after 2 d in culture at the highest concentration of PTU, some pigmentation was visible (Fig. 10A,l). Because the lowest dose of PTU visibly inhibited retinal melanin formation and the highest dose was deleterious to retinal growth, lower concentrations (100–200 μm) were chosen for use in the following experiments.
Fig. 10.
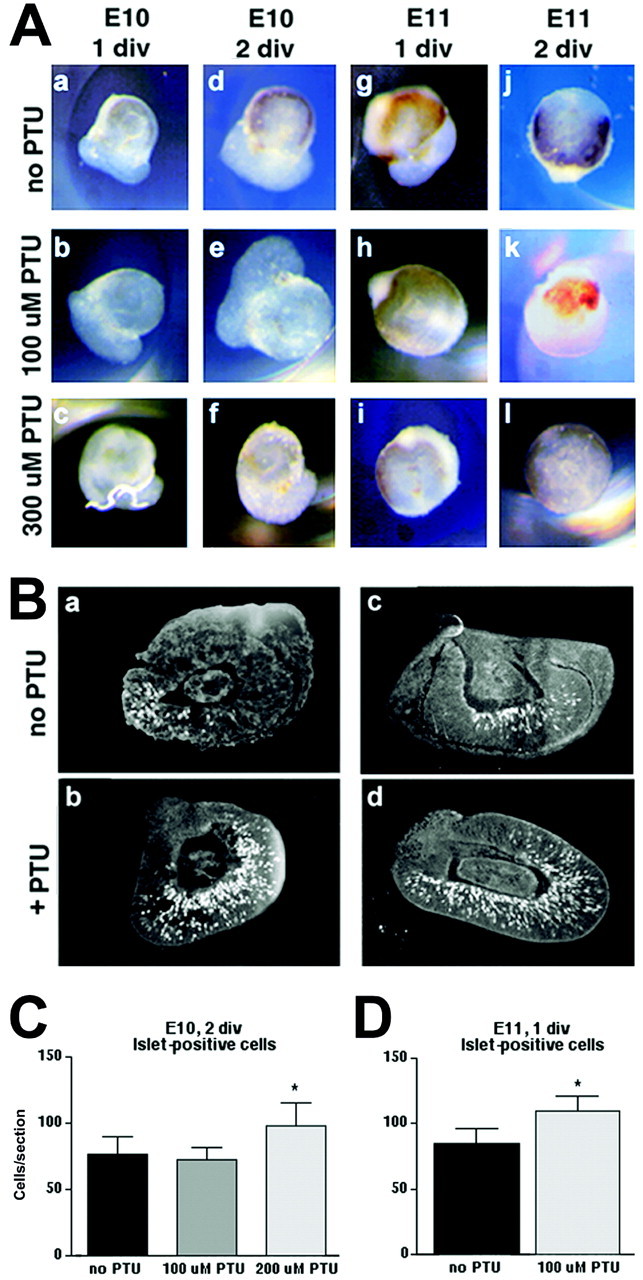
PTU inhibits pigment formation in eyecupsin vitro, and the number of Islet-positive cells increases when pigment production is blocked. A, Eyecups were grown for 1–2 d in vitro (div) in SFM in the absence or presence of PTU (100 or 300 μm). PTU completely prevents pigment formation in E10 eyecups at all concentrations (A, a–f). The faint dark coloration in some of these eyecups is from red blood cells. At E11, retinal pigment is already present. Blocking tyrosinase activity results in a reduction of pigmentation over time, but does not completely abolish melanin even after 2 d in culture at the highest dose (A, g–l). B, Eyecups cultured according to the conditions in A were sectioned at 8 μm and labeled with an antibody to Islet. Both E10, 2 div (B, a,b) and E11, 1 div (B, c,d) eyecups show more Islet-positive cells when treated with PTU. Morphology of the eyecups after 1–2 d in culture is intact, with clear visibility of the lens, neural retina, and RPE. PTU-treated eyecups show a higher number of Islet-positive cells. C, D,Quantitation of the experiments shown above. E10, 2 div eyecups show an increase in Islet-positive cells when grown in the presence of 200 μm (but not 100 μm) PTU (C). At E10 the concentration of PTU required to cause an increase in the number of Islet-positive cells (200 μm) is greater than the concentration required to block melanin synthesis (≤100 μm; Ab above), suggesting a dichotomy in the regulation of the two processes. E11, 1 div eyecups treated with 100 μm PTU display an increase in Islet-positive cells (D). At E11, the increase in Islet expression occurs in the presence of some retinal melanin (see Ahabove), suggesting an effect of blocking tyrosinase activity separate from the presence of melanin itself. Results represent cell counts from 21–62 sections taken from 4–13 eyecups at each data point.
To determine the effect of blocking melanin formation before the onset of pigmentation, E10 eyecups from pigmented animals were grown for 2 d in culture, with 100 or 200 μm PTU. Cryostat sections of the eyecups were labeled with an anti-Islet antibody (Fig.10Ba–d). PTU at 100 μm had no effect on the production of RGCs as measured by Islet expression, whereas 200 μm resulted in a modest but significant increase in the number of Islet-positive cells (unpairedt test; p = 0.0172) (Fig. 10C), replicating the results in vivo in the albino. In subsequent experiments, E11 eyecups were incubated for 1 d in SFM with either vehicle alone or 100 μm PTU. Under these conditions, PTU treatment resulted in a slight increase in Islet-positive cells per section (p = 0.0206) despite the continued presence of melanin in the RPE (Fig.10D). This set of experiments shows that the production of Islet-positive cells increases by blocking tyrosinase even after melanogenesis has begun, implicating a role for melanin in regulating the production of differentiated RGCs, and potentially, exit from the cell cycle.
To determine whether the increase in Islet-positive cells was specific to RGCs or reflected a general increase in cell production with inhibition of melanin formation, we also labeled sections from the E11 eyecups with anti-Otx2 antibody. A trend toward more Otx2-positive cells was observed in PTU-treated eyecups [71 ± 34 vs 86 ± 20 (SEM) cells per section], although the difference did not reach statistical significance in this data set. In the Otx2-labeled sections shown in Figure 2, I and J, more Otx2-positive neurons were present in the albino retina [109.5 ± 3.3 vs 99.3 ± 3.2 (SEM) cells per field; unpaired t test,p = 0.0386]. Together, these results suggest that inhibition of melanin production may lead to a general increase in cell number rather than having a selective effect on RGCs.
DISCUSSION
The data presented here elucidate a number of novel spatial and temporal perturbations in cell production in the albino mouse retina. Contrary to expectations, the results show that more Islet-positive RGCs are present in the initial period of neuronogenesis in albino and that this overproduction of RGCs is found in the overall population of RGCs as well as in the uncrossed population. Production of the ipsilateral subpopulation of RGCs occurs primarily (95%) during the period from E11–E14 in albino retina, whereas in pigmented retina production of ipsilateral RGCs is only 85% complete by E14, in agreement with previous results on wild-type mice (Dräger, 1985a). Spatial organization is altered at both the cellular level and at the level of the retinal sheet, with the albino retina showing an expansion of the temporal periphery. Ipsilateral RGCs reside in the ventrotemporal region; thus, the expansion of the temporal periphery may reflect the early overproduction of cells in this region. Whether a cause of this overproduction or the result of it, the optic nerve head is positioned further nasally in albino retina than in pigmented retina. Finally, we find that the production of Islet-positive cells is enhanced by blocking melanin formation in vitro.
Observations during, rather than after, the neuronogenetic period provide a novel view of albino retinal development
The result that more RGCs are present during the initial phase of neuronogenesis in albino retina is unexpected because previous experiments have been interpreted to indicate a delay in both cell production and differentiation in the albino retina (Kliot and Shatz, 1985; Webster and Rowe, 1991; Ilia and Jeffery, 1996). Several factors may account for this disparity. Most previous retinal birth dating analyses in mammals have performed S-phase labeling at early time points and evaluated the labeled cells weeks to months later (Sidman, 1961; Dräger, 1985a; Young, 1985a,b; LaVail et al., 1991). In zebrafish, an early and dynamic pattern of cell genesis is seen initially, but these patterns become obscured by subsequent cell addition and are not evident in more mature retina (Hu and Easter, 1999). Moreover, a period of cell death occurs in the rodent retina starting around birth and peaking at P7 (Voyvodic et al., 1995) that could easily mask the initial abnormal patterns of cell production that we have seen.
Although a perturbed maturational gradient could be interpreted as a delay, based on the finding that the adult positions of RGCs born on sequential days follow a less clear gradient in the albino (Ilia and Jeffrey, 1996), it may in fact demonstrate the disorganization in cell packing shown here and also visible in Figure 1 of Webster and Rowe (1991). Likewise, a suggested delay based on the slower decline in neuron numbers in postnatal albino retina, and the fact that at any given age, more cells are present in the albino (Webster and Rowe, 1991) may actually be attributable to more cells being born earlier in the neurogenetic period, rather than to a delay in cell death. Finally, the reported delayed ingrowth of ipsilateral retinal axons into the LGN in the Siamese cat may not be a true delay, but rather the consequence of a smaller number of uncrossed fibers being less detectable at early stages of ingrowth (Kliot and Shatz, 1985). Indeed, more recent studies using different methods have failed to find delays in albino retinal axon outgrowth (Chan et al., 1993; Marcus et al., 1996). Thus, the present study, which uses BrdU in combination with tritiated thymidine and cell-specific markers to assess RGC genesis during the neuronogenetic period, rather than weeks after the cells are born, has produced a novel view of albino retinal development.
A shorter, earlier period of generation produces fewer ipsilateral-projecting RGCs
Although an increased production of cells is observed in early stages of neuronogenesis in albino retina, the total number of RGCs in adult albino retina is normal (Dräger and Olsen, 1980; Rice et al., 1995). This finding could reflect the fact that the early “overproduction” of RGCs is small and thus obscured by extensive cell production later in development. Normally 50% of retinal neurons die during development (Voyvodic et al., 1995), and a small relative increase in cell death could easily adjust albino RGCs to normal number. This large loss of neurons also raises the possibility that differential cell death could contribute to the smaller ipsilateral RGC population. However, previous work has suggested that differential postnatal cell death is not responsible for generating the reduced ipsilateral projection in albinism (Linden and Pinto, 1985; Cucchiaro, 1991; Thompson and Morgan, 1993) (but see alsoThompson et al., 1995). Another possible mechanism for normalizing total RGC numbers could be a feedback loop, whereby an early surplus of RGCs is detected and compensated for by altered output from the progenitor population (Waid and McLoon, 1998; Cepko, 1999).
Because the retina develops in a central-to-peripheral manner, and because ipsilateral-projecting RGCs in the adult mouse are positioned in the far peripheral VT crescent (Dräger and Olsen, 1980), it was not predicted a priori that ipsilateral RGCs would be born during the early period of neuronogenesis (E11–E16) (Dräger, 1985a). Indeed, a delay in the birth of RGCs in albino would have more easily explained a decrease in ipsilateral projections. Yet the present findings indicate that the ipsilaterally projecting population is born earlier in albino retina. Dräger and Olsen (1980) detailed a number of retinal changes in adult albino mouse, including a decrease in the number of displaced ipsilateral RGCs—normally found within the inner nuclear layer, and an increase in the number of aberrant ipsilateral RGCs—scattered throughout theX-Y plane of the RGC layer outside of VT retina. In light of the present findings, we suggest that the decrease in displaced RGCs (presumably later-born) could be caused by the skewed, earlier time course of ipsilateral RGC production in the albino. The aberrant ipsilateral RGCs could result from the spatiotemporal disturbances documented above.
The additional sectors in the peripheral temporal retina of albino at E11 and E12 are a further indication of increased cell production and represent an expansion of the proliferative sheet (Fig.7C,E). The similarity between the two genotypes at E13 in the average number of labeled and unlabeled cells in these sectors (when present) (Figs. 7G, 9C), suggests that the peripheral growth of the retinal anlage is qualitatively similar but follows a different time course in the two genotypes. However, because this region is appropriately positioned to contribute to the ventrotemporal crescent, the difference in the time course of the expansion of the proliferative sheet may contribute to the earlier endpoint for generation of the ipsilateral population in the albino.
Perturbed neuronogeneis in the albino: links with other visual system defects in albinism?
In agreement with the in vivo birth dating results, we find that blocking melanin formation at E10–E11 in cultured eyecups moderately increases the production of Islet-positive cells. In the RPE, melanin is sequestered in melanosomes and does not directly contact RGCs, even during development. Previous in vitroevidence has implicated dopa, a putative intermediate in melanin synthesis, as a regulator of mitosis in the developing retina (Ilia and Jeffery, 1999). Melanin also acts as a calcium sink, and calcium dynamics are perturbed in albino mouse retina (Dräger, 1985b). Because calcium levels influence the rate of DNA synthesis in chick retina (Sugioka et al., 1999), these findings together suggest a possible link between melanin levels and cell proliferation and neuronogenesis. Thus, although the mechanisms linking perturbed neuronogenesis to alterations of the projection of RGC axons in the albino are not clear at present, our results show directly that melanin formation does affect neuronogenesis. The eyecup in vitroassay should help elucidate the biochemical links between melanin production and retinal neuronogenesis.
In light of the present findings, the factors regulating retinal progenitor cell proliferation (Dyer and Cepko, 2001) and cell fate determination (Perron and Harris, 2000; Livesey and Cepko, 2001) can now be applied to the question of what goes molecularly awry in albino retinal histogenesis. For example, the Notch pathway has been implicated in shifting the percentage of different retinal cell types generated in the Xenopus retina (Dorsky et al., 1997). We have found an increase in RGCs generated early in albino retina, whereas previous papers have reported a reduction in photoreceptors (Fulton et al., 1978; Grant et al., 2001). It thus remains for future studies to determine if and how defects in the number of these two cell types are related and whether the altered features of early retinal development described here may underlie both the miswiring of RGC axons at the optic chiasm and the reduction of photoreceptors in the central retina of albino mammals. One hypothesis is that pigment formation in the RPE interacts with the molecular machinery controlling cell cycle progression or symmetry of cell division in the neural retina (Cayouette et al., 2001). Thus, the key to understanding retinal abnormalities in the albino may ultimately depend on identifying factors regulated by melanin-dependent signals from the retinal pigment epithelium and how and whether these regulate the cell cycle (Ohnuma et al., 2001).
Footnotes
The Optical Microscopy Facility was established by National Institutes of Heath (NIH) Shared Instrumentation Grant RR10506 and is supported by NIH Grant CA13696 as part of the Herbert Irving Cancer Center at Columbia University. This work was supported by NIH Grant EY12736 (C.A.M.) and National Aeronautics and Space Administration Grant NAG2–1367 (R.S.N.). We thank Ira Schieren for processing the samples for FACS analysis, Susan Morton and Tom Jessell for the anti-Islet1/2 antibody, Chris Walsh for the anti-doublecortin antibody, Giorgio Corte for the Otx-2 antibody, Theresa Swayne for expert assistance with confocal microscopy, and Richard Blazeski for expert technical assistance. We also thank Ray Guillery and Riva Marcus for insightful discussions and Deborah Cohen and Scott Wilson for comments on this manuscript.
Correspondence should be addressed to Carol A. Mason, Department of Pathology, Columbia University, P & S 14–509, 630 West 168th Street, New York, NY 10032. E-mail: cam4@columbia.edu.
R. A. Rachel's present address: Mouse Cancer Genetics Program, National Cancer Institute-Frederick, P.O. Box B, Building 539, Room 234, Frederick, MD 21702-1201. E-mail: rrachel@ncifcrf.gov.
L. Erskine's present address: Departments of Molecular Genetics and Visual Science, Institute of Ophthalmology, University College London, Bath Street, London EC1V 9EL, UK.
REFERENCES
- 1.Alexiades M, Cepko C. Quantitative analysis of proliferation and cell cycle length during development of the rat retina. Dev Dyn. 1996;205:293–307. doi: 10.1002/(SICI)1097-0177(199603)205:3<293::AID-AJA9>3.0.CO;2-D. [DOI] [PubMed] [Google Scholar]
- 2.Beisker W, Dolbeare F, Gray J. An improved immunocytochemical procedure for high-sensitivity detection of incorporated bromodeoxyuridine. Cytometry. 1987;8:235–239. doi: 10.1002/cyto.990080218. [DOI] [PubMed] [Google Scholar]
- 3.Bovolenta P, Mallamaci A, Briata P, Corte G, Boncinelli E. Implication of OTX2 in pigment epithelium determination and neural retina differentiation. J Neurosci. 1997;17:4243–4252. doi: 10.1523/JNEUROSCI.17-11-04243.1997. [DOI] [PMC free article] [PubMed] [Google Scholar]
- 4.Brown A, Yates P, Burrola P, Ortuño D, Vaidya A, Jessell T, Pfaff S, O'Leary D, Lemke G. Topographic mapping from the retina to the midbrain is controlled by relative but not absolute levels of EphA receptor signaling. Cell. 2000;102:77–88. doi: 10.1016/s0092-8674(00)00012-x. [DOI] [PubMed] [Google Scholar]
- 5.Carter-Dawson L, LaVail M. Rods and cones in the mouse retina. II. Autoradiographic analysis of cell generation using tritiated thymidine. J Comp Neurol. 1979;188:263–272. doi: 10.1002/cne.901880205. [DOI] [PubMed] [Google Scholar]
- 6.Cayouette M, Whitmore A, Jeffery G, Raff M. Asymmetric segregation of numb in retinal development and the influence of the pigmented epithelium. J Neurosci. 2001;21:5643–5651. doi: 10.1523/JNEUROSCI.21-15-05643.2001. [DOI] [PMC free article] [PubMed] [Google Scholar]
- 7.Cepko C. The roles of intrinsic and extrinsic cues and bHLH genes in the determination of retinal cell fates. Curr Opin Neurobiol. 1999;9:37–46. doi: 10.1016/s0959-4388(99)80005-1. [DOI] [PubMed] [Google Scholar]
- 8.Cepko C, Austin C, Yang X, Alexiades M, Ezzeddine D. Cell fate determination in the vertebrate retina. Proc Natl Acad Sci USA. 1996;93:589–595. doi: 10.1073/pnas.93.2.589. [DOI] [PMC free article] [PubMed] [Google Scholar]
- 9.Chan SO, Baker GE, Guillery RW. Differential action of the albino mutation on two components of the rat's uncrossed retinofugal pathway. J Comp Neurol. 1993;336:362–377. doi: 10.1002/cne.903360305. [DOI] [PubMed] [Google Scholar]
- 10.Clevenger C, Bauer K, Epstein A. A method for simultaneous nuclear immunofluorescence and DNA content quantitation using monoclonal antibodies and flow cytometry. Cytometry. 1985;6:208–214. doi: 10.1002/cyto.990060306. [DOI] [PubMed] [Google Scholar]
- 11.Colello R, Guillery R. The early development of retinal ganglion cells with uncrossed axons in the mouse: retinal position and axonal course. Development. 1990;108:515–523. doi: 10.1242/dev.108.3.515. [DOI] [PubMed] [Google Scholar]
- 12.Colello R, Guillery R. Observations on the early development of the optic nerve and tract of the mouse. J Comp Neurol. 1992;317:357–378. doi: 10.1002/cne.903170404. [DOI] [PubMed] [Google Scholar]
- 13.Cucchiaro J. Early development of the retinal line of decussation in normal and albino ferrets. J Comp Neurol. 1991;312:193–206. doi: 10.1002/cne.903120203. [DOI] [PubMed] [Google Scholar]
- 14.Denham S. A cell proliferation study of the neural retina in the two-day rat. J Embryol Exp Morphol. 1967;18:53–66. [PubMed] [Google Scholar]
- 15.Donatien P, Orlow S. Interaction of melanosomal proteins with melanin. Eur J Biochem. 1995;232:159–164. doi: 10.1111/j.1432-1033.1995.tb20794.x. [DOI] [PubMed] [Google Scholar]
- 16.Dorsky R, Chang W, Rapaport D, Harris W. Regulation of neuronal diversity in the Xenopus retina by Delta signalling. Nature. 1997;385:67–70. doi: 10.1038/385067a0. [DOI] [PubMed] [Google Scholar]
- 17.Dräger UC. Birth dates of retinal ganglion cells giving rise to the crossed and uncrossed optic projections in the mouse. Proc R Soc Lond B Biol Sci. 1985a;224:57–77. doi: 10.1098/rspb.1985.0021. [DOI] [PubMed] [Google Scholar]
- 18.Dräger UC. Calcium binding in pigmented and albino eyes. Proc Natl Acad Sci USA. 1985b;82:6716–6720. doi: 10.1073/pnas.82.19.6716. [DOI] [PMC free article] [PubMed] [Google Scholar]
- 19.Dräger UC, Olsen JF. Origins of crossed and uncrossed retinal projections in pigmented and albino mice. J Comp Neurol. 1980;191:383–412. doi: 10.1002/cne.901910306. [DOI] [PubMed] [Google Scholar]
- 20.Dyer M, Cepko C. Regulating proliferation during retinal development. Nat Rev Neurosci. 2001;2:333–342. doi: 10.1038/35072555. [DOI] [PubMed] [Google Scholar]
- 21.Easter S, Ross L, Frankfurter A. Initial tract formation in the mouse brain. J Neurosci. 1993;13:285–299. doi: 10.1523/JNEUROSCI.13-01-00285.1993. [DOI] [PMC free article] [PubMed] [Google Scholar]
- 22.Fulton AB, Albert DM, Craft JL. Human albinism. Light and electron microscopy study. Arch Ophthalmol. 1978;96:305–310. doi: 10.1001/archopht.1978.03910050173014. [DOI] [PubMed] [Google Scholar]
- 23.Galli-Resta L, Resta G, Tan S, Reese B. Mosaics of islet-1-expressing amacrine cells assembled by short-range cellular interactions. J Neurosci. 1997;17:7831–7838. doi: 10.1523/JNEUROSCI.17-20-07831.1997. [DOI] [PMC free article] [PubMed] [Google Scholar]
- 24.Gleeson J, Lin P, Flanagan L, Walsh C. Doublecortin is a microtubule-associated protein and is expressed widely by migrating neurons. Neuron. 1999;23:257–271. doi: 10.1016/s0896-6273(00)80778-3. [DOI] [PubMed] [Google Scholar]
- 25.Grant S, Patel N, Philp A, Grey C, Lucas R, Foster R, Bowmaker J, Jeffery G. Rod photopigment deficits in albinos are specific to mammals and arise during retinal development. Vis Neurosci. 2001;18:245–251. doi: 10.1017/s095252380118209x. [DOI] [PubMed] [Google Scholar]
- 26.Green E. Albino-2J (c). Mouse News Lett. 1973;49:31. [Google Scholar]
- 27.Guillery RW. Neural abnormalities of albinos. Trends Neurosci. 1986;9:364–367. [Google Scholar]
- 28.Guillery RW, Scott GL, Cattanach BM, Deol MS. Genetic mechanisms determining the central visual pathways of mice. Science. 1973;179:1014–1016. doi: 10.1126/science.179.4077.1014. [DOI] [PubMed] [Google Scholar]
- 29.Guillery RW, Jeffery G, Cattanach BM. Abnormally high variability in the uncrossed retinofugal pathway of mice with albino mosaicism. Development. 1987;101:857–867. doi: 10.1242/dev.101.4.857. [DOI] [PubMed] [Google Scholar]
- 30.Hayes N, Nowakowski R. Exploiting the dynamics of S-phase tracers in developing brain: interkinetic nuclear migration for cells entering versus leaving the S-phase. Dev Neurosci. 2000;22:44–55. doi: 10.1159/000017426. [DOI] [PubMed] [Google Scholar]
- 31.Hu M, Easter S. Retinal neurogenesis: the formation of the initial central patch of postmitotic cells. Dev Biol. 1999;207:309–321. doi: 10.1006/dbio.1998.9031. [DOI] [PubMed] [Google Scholar]
- 32.Ilia M, Jeffery G. Delayed neurogenesis in the albino retina: evidence of a role for melanin in regulating the pace of cell generation. Dev Brain Res. 1996;95:176–183. doi: 10.1016/0165-3806(96)00075-2. [DOI] [PubMed] [Google Scholar]
- 33.Ilia M, Jeffery G. Retinal mitosis is regulated by dopa, a melanin precursor that may influence the time at which cells exit the cell cycle: analysis of patterns of cell production in pigmented and albino retinas. J Comp Neurol. 1999;405:394–405. doi: 10.1002/(sici)1096-9861(19990315)405:3<394::aid-cne9>3.0.co;2-y. [DOI] [PubMed] [Google Scholar]
- 34.Kliot M, Shatz CJ. Abnormal development of the retinogeniculate projection in Siamese cats. J Neurosci. 1985;5:2641–2653. doi: 10.1523/JNEUROSCI.05-10-02641.1985. [DOI] [PMC free article] [PubMed] [Google Scholar]
- 35.LaVail JH, Nixon RA, Sidman RL. Genetic control of retinal ganglion cell projections. J Comp Neurol. 1978;182:399–422. doi: 10.1002/cne.901820304. [DOI] [PubMed] [Google Scholar]
- 36.LaVail M, Rapaport D, Rakic P. Cytogenesis in the monkey retina. J Comp Neurol. 1991;309:86–114. doi: 10.1002/cne.903090107. [DOI] [PubMed] [Google Scholar]
- 37.Le Fur N, Kelsall S, Mintz B. Base substitution at different alternative splice donor sites of the tyrosinase gene in murine albinism. Genomics. 1996;37:245–248. doi: 10.1006/geno.1996.0551. [DOI] [PubMed] [Google Scholar]
- 38.Linden R, Pinto L. Developmental genetics of the retina: evidence that the pearl mutation in the mouse affects the time course of natural cell death in the ganglion cell layer. Exp Brain Res. 1985;60:79–86. doi: 10.1007/BF00237021. [DOI] [PubMed] [Google Scholar]
- 39.Livesey F, Cepko C. Vertebrate neural cell-fate determination: lessons from the retina. Nat Rev Neurosci. 2001;2:109–118. doi: 10.1038/35053522. [DOI] [PubMed] [Google Scholar]
- 40.Marcus RC, Mason CA. The first retinal axon growth in the mouse optic chiasm: axon patterning and the cellular environment. J Neurosci. 1995;15:6389–6402. doi: 10.1523/JNEUROSCI.15-10-06389.1995. [DOI] [PMC free article] [PubMed] [Google Scholar]
- 41.Marcus RC, Wang L-C, Mason CA. Retinal axon divergence in the optic chiasm: Midline cells are unaffected by the albino mutation. Development. 1996;122:859–868. doi: 10.1242/dev.122.3.859. [DOI] [PubMed] [Google Scholar]
- 42.McConnell S. Strategies for the generation of neuronal diversity in the developing central nervous system. J Neurosci. 1995;15:6987–6998. doi: 10.1523/JNEUROSCI.15-11-06987.1995. [DOI] [PMC free article] [PubMed] [Google Scholar]
- 43.Ohnuma S, Philpott A, Harris WA. Cell cycle and cell fate in the nervous system. Curr Opin Neurobiol. 2001;11:66–73. doi: 10.1016/s0959-4388(00)00175-6. [DOI] [PubMed] [Google Scholar]
- 44.Perron M, Harris W. Determination of vertebrate retinal progenitor cell fate by the Notch pathway and basic helix-loop-helix transcription factors. Cell Mol Life Sci. 2000;57:215–223. doi: 10.1007/PL00000685. [DOI] [PMC free article] [PubMed] [Google Scholar]
- 45.Rentrop M, Knapp B, Winter H, Schweizer J. Aminoalkylsilane-treated glass slides as support for in situ hybridization of keratin cDNAs to frozen tissue sections under varying fixation and pretreatment conditions. Histochem J. 1986;18:271–276. doi: 10.1007/BF01676237. [DOI] [PubMed] [Google Scholar]
- 46.Rice DS, Williams RW, Goldowitz D. Genetic control of retinal projections in inbred strains of albino mice. J Comp Neurol. 1995;354:459–469. doi: 10.1002/cne.903540312. [DOI] [PubMed] [Google Scholar]
- 47.Sanderson K, Guillery R, Shackelford R. Congenitally abnormal visual pathways in mink (Mustela vision) with reduced retinal pigment. J Comp Neurol. 1974;154:225–248. doi: 10.1002/cne.901540302. [DOI] [PubMed] [Google Scholar]
- 48.Schmid I, Uittenbogaart C, Giorgi J. A gentle fixation and permeabilization method for combined cell surface and intracellular staining with improved precision in DNA quantification. Cytometry. 1991;12:279–285. doi: 10.1002/cyto.990120312. [DOI] [PubMed] [Google Scholar]
- 49.Sidman R. Histogenesis of mouse retina studied with thymidine-H3. In: Smelser G, editor. The structure of the eye. Academic; New York: 1961. pp. 487–505. [Google Scholar]
- 50.Sinitsina V. DNA synthesis and kinetics of cellular populations in embryohistognesis of the retina of mice. Arch Anat Gistol Embryol. 1971;61:58–67. [PubMed] [Google Scholar]
- 51.Slominski A, Moellmann G, Kuklinska E. l-tyrosine, l-dopa, and tyrosinase as positive regulators of the subcellular apparatus of melanogenesis in Bomirski Ab amelanotic melanoma cells. Pigment Cell Res. 1989;2:109–116. doi: 10.1111/j.1600-0749.1989.tb00170.x. [DOI] [PubMed] [Google Scholar]
- 52.Sugioka M, Zhou WL, Hofmann HD, Yamashita M. Involvement of P2 purinoceptors in the regulation of DNA synthesis in the neural retina of chick embryo. Int J Dev Neurosci. 1999;17:135–144. doi: 10.1016/s0736-5748(98)00066-5. [DOI] [PubMed] [Google Scholar]
- 53.Takahashi T, Nowakowski R, Caviness VJ. The cell cycle of the pseudostratified ventricular epithelium of the embryonic murine cerebral wall. J Neurosci. 1995;15:6046–6057. doi: 10.1523/JNEUROSCI.15-09-06046.1995. [DOI] [PMC free article] [PubMed] [Google Scholar]
- 54.Takahashi T, Nowakowski R, Caviness VJ. The leaving or Q fraction of the murine cerebral proliferative epithelium: a general model of neocortical neuronogenesis. J Neurosci. 1996;16:6183–6196. doi: 10.1523/JNEUROSCI.16-19-06183.1996. [DOI] [PMC free article] [PubMed] [Google Scholar]
- 55.Takahashi T, Goto T, Miyama S, Nowakowski R, Caviness VJ. Sequence of neuron origin and neocortical laminar fate: relation to cell cycle of origin in the developing murine cerebral wall. J Neurosci. 1999;19:10357–10371. doi: 10.1523/JNEUROSCI.19-23-10357.1999. [DOI] [PMC free article] [PubMed] [Google Scholar]
- 56.Tanabe Y, William C, Jessell T. Specification of motor neuron identity by the MNR2 homeodomain protein. Cell. 1998;95:67–80. doi: 10.1016/s0092-8674(00)81783-3. [DOI] [PubMed] [Google Scholar]
- 57.Theiler K. The house mouse. Springer; Berlin: 1972. [Google Scholar]
- 58.Thompson I, Morgan J. The development of retinal ganglion cell decussation patterns in postnatal pigmented and albino ferrets. Eur J Neurosci. 1993;5:341–356. doi: 10.1111/j.1460-9568.1993.tb00502.x. [DOI] [PubMed] [Google Scholar]
- 59.Thompson ID, Cordery P, Holt CE. Postnatal changes in the uncrossed retinal projection of pigmented and albino Syrian hamsters and the effects of monocular enucleation. J Comp Neurol. 1995;357:181–203. doi: 10.1002/cne.903570202. [DOI] [PubMed] [Google Scholar]
- 60.von Bohlen und Halbach O. The isolated mammalian brain: an in vivo preparation suitable for pathway tracing. Eur J Neurosci. 1999;11:1096–1100. doi: 10.1046/j.1460-9568.1999.00543.x. [DOI] [PubMed] [Google Scholar]
- 61.Voyvodic J, Burne J, Raff M. Quantification of normal cell death in the rat retina: implications for clone composition in cell lineage analysis. Eur J Neurosci. 1995;7:2469–2478. doi: 10.1111/j.1460-9568.1995.tb01045.x. [DOI] [PubMed] [Google Scholar]
- 62.Waid DK, McLoon SC. Ganglion cells influence the fate of dividing retinal cells in culture. Development. 1998;125:1059–1066. doi: 10.1242/dev.125.6.1059. [DOI] [PubMed] [Google Scholar]
- 63.Wang L-C, Rachel RA, Marcus RC, Mason CA. Chemosuppression of retinal axon growth by the mouse optic chiasm. Neuron. 1996;17:849–862. doi: 10.1016/s0896-6273(00)80217-2. [DOI] [PubMed] [Google Scholar]
- 64.Webster MJ, Rowe MH. Disruption of developmental timing in the albino rat retina. J Comp Neurol. 1991;307:460–474. doi: 10.1002/cne.903070309. [DOI] [PubMed] [Google Scholar]
- 65.Xiang M. Requirement for Brn-3b in early differentiation of postmitotic retinal ganglion cell precursors. Dev Biol. 1998;197:155–169. doi: 10.1006/dbio.1998.8868. [DOI] [PubMed] [Google Scholar]
- 66.Young R. Cell proliferation during postnatal development of the retina in the mouse. Brain Res. 1985a;353:353. doi: 10.1016/0165-3806(85)90211-1. [DOI] [PubMed] [Google Scholar]
- 67.Young R. Cell differentiation in the retina of the mouse. Anat Rec. 1985b;212:199–205. doi: 10.1002/ar.1092120215. [DOI] [PubMed] [Google Scholar]