

Abstract
Purpose
This study evaluates the prevalence and factors associated with major depressive disorder (MDD) in a population of cancer survivors and the impact of co-occurring MDD and urinary incontinence (UI) on health-related quality of life (HRQOL).
Methods
The prevalence of MDD risk among cancer survivors (breast, prostate, bladder, colorectal, lung and endometrial/uterine cancers) and those without cancer was estimated using the Surveillance, Epidemiology and End Results Program-Medicare Health Outcomes Survey (SEER-MHOS) linked database (n=9,282 with cancer/n=289,744 without cancer). Risk for MDD was measured using 3 items from the Diagnostic Interview Schedule and HRQOL was measured by the SF-36. UI was defined as self-reported leakage of urine causing a problem in previous 6 months. Factors associated with MDD were investigated using logistic regression and the impact of co-occurring MDD and UI on HRQOL scores was determined using linear regression.
Results
The prevalence of MDD risk ranged from 19.2% for prostate-34.1% for lung. Lung cancer diagnosis was associated with risk of MDD. Being ≥5 years from diagnosis was associated with decreased risk of MDD (Prevalence Odds Ratio (POR)=0.82, 95% Confidence Interval (95% CI): 0.71, 0.95). The coexistence of both UI and MDD was associated with a decrease across HRQOL subscales; including 40-points on role emotional (RE) score.
Conclusions
Cancer survivors reporting co-occurrence of UI and MDD experienced significant decrements in HRQOL.
Implications of cancer survivors
Understanding the combined effect of UI and MDD may help clinicians to better recognize and alleviate their effects on cancer survivors’ HRQOL.
Keywords: urinary incontinence, major depressive disorder, health related quality of life, cancer, survivor
Introduction
By the year 2030, an estimated 71 million Americans will be 65 years of age and older, accounting for approximately 20% of the U.S. population [1]. This large-scale population shift will result in an increase in cancer incidence as more than 60% of new cancers occur in adults 65 years of age and older [2]. Approximately 13.7 million people in the U.S. are currently cancer survivors and this number is expected to increase to 18 million by the year 2022, representing a 31% increase in cancer survivors [3, 4]. Increasing age has been previously associated with more frequent health problems which can result in negative impacts on health-related quality of life (HRQOL) [5, 6].
There is increasing awareness of the importance of the overall health of cancer survivors, and in research to identify potential ways to improve the health care of cancer survivors. Major depressive disorder (MDD) and urinary incontinence (UI) are both prevalent, non-cancer issues in the elderly and in cancer survivors, but have been understudied among cancer survivors. The Center for Disease Control (CDC) and population-based studies estimate that approximately 1 in 10 adults in the U.S. are currently experiencing major depression [7]. In addition, the lifetime prevalence of depression is estimated to be 16% in the general population [8] and is estimated to be even higher in elderly populations, possibly up to 30% [9]. The rate of MDD is particularly high in those recently diagnosed or being treated for cancer, with a prevalence ranging from 10% to 25.5%[10]. MDD is a key cause of disability [11] and has been associated with higher mortality and a higher number of comorbid conditions [9] among the elderly.
Urinary symptoms are also highly prevalent in the general population, with estimates of about 17% among men and 38% among women who are above the age of 60 years [12–14]. It has been shown that UI impacts many facets of an individual’s life, including social, physical, psychological, work productivity and sexual health [15–19]. In addition, urinary symptoms are associated with certain cancers (for example: bladder, prostate, gynecological cancers) as well as a side effect of cancer treatments [20–23]. Previous research found that reporting UI symptoms was independently associated with decreased HRQOL scores in a population of older Americans across cancer diagnoses [24]. UI is a potentially treatable and reversible condition; in fact, multiple treatment options exist [25, 26]. For cancer survivors, who experienced persistent UI symptoms after a prostatectomy or hysterectomy, some surgical treatments have been effective in improving their symptoms [26–28].
The link between UI and depression has been described, and the co-occurrence of these two conditions has been demonstrated to have an additive impact on decrements of HRQOL, in the general population [29]. However, there has been very little, if any, research investigating the co-occurrence of MDD and urinary incontinence and the association with HRQOL among cancer survivors. To help better understand the issues of MDD and urinary incontinence in cancer survivors, this study aims to evaluate the prevalence of MDD among older Americans with and without cancer; to determine factors associated with MDD such as cancer diagnoses (bladder, breast, colorectal, endometrial/uterine, prostate or lung), demographics, comorbidities, and urinary incontinence symptoms; and to investigate the combined impact of UI and MDD on HRQOL.
Methods
SEER-MHOS data linkage
This study utilizes the population-based SEER-MHOS database, which links the Surveillance, Epidemiology and End Results [SEER] program of cancer registries with the Medicare Health Outcomes Survey [MHOS] to provide detailed information about Medicare beneficiaries who have been diagnosed with cancer. Extensive details of the SEER-MHOS data linkage have been published previously [30]. The National Cancer Institute’s SEER program collects and publishes cancer incidence and survival data from population-based cancer registries for approximately 28% of the U.S. population [31]. Additionally, SEER collects demographic, tumor characteristic and selected cancer care data for individuals. The MHOS, which includes self-reported information on socioeconomic, demographic, co-morbidity, health and functional status, is given to randomly selected Medicare beneficiaries from each managed care plan under contract with the Centers for Medicare & Medicaid Services (CMS) each year. These selected Medicare beneficiaries are given a baseline survey, and if they are still in the same managed care plan two years later they also receive a follow-up survey.
IRB exemption was obtained from University of North Carolina at Chapel Hill.
Cohort and participant selection
This cross-sectional analysis draws from the baseline and follow-up data from five SEER-MHOS cohorts (2001 and 2003, 2002 and 2004, 2003 and 2005, 2004 and 2006, 2005 and 2007). These cohorts were selected as these survey years include measures of both UI and the depressive symptom questions used in the MDD algorithm. For participants diagnosed with cancer and who have completed two or more SEER-MHOS surveys, the responses to the first MHOS survey after the most recent cancer diagnoses were used. For those without cancer diagnoses, the first survey was used. If the respondent had missing data on any of the questions used to determine MDD or UI then the follow-up survey was used. Study participants were excluded for the following reasons: (1) if missing data on MDD or UI (n=635 for those with cancer diagnosis, n=16,321 for those without a cancer diagnosis); (2) men with breast cancer diagnosis (n=7) which had too small of a sample size to produce stable estimates, and (3) participants under the age of 65 years (n=209 for those with cancer diagnosis, n=20,833 for those without a cancer diagnosis).
The final sample sizes included in this analysis for 6 different cancer types were as follows: (1) prostate (n=3,133), (2) female breast (n=2,649), (3) colorectal (n=1,645), (4) bladder (n=710), (5) lung (n=607) and (6) endometrial and uterine (n=538). 289,744 individuals who had never been diagnosed with cancer were selected.
SEER-MHOS Measures
In our study, MHOS administered the 3 questions described above from the Diagnostic Interview Schedule (DIS). Being at “risk of major depressive disorder” (MDD) was defined using an algorithm by Rost et al., 1993[32]. The algorithm includes two methods in which to screen positive for MDD. The first is a positive screen for risk of MDD was defined by an affirmative response to the question ‘In the past year, have you had 2 weeks or more during which you felt sad, blue or depressed; or when you lost interest or pleasure in things that you usually cared about or enjoyed? (yes/no)’. The second way to screen positive for risk of MDD, included an affirmative response to both of the following questions: (1) ‘In the past year, have you felt depressed or sad much of the time? (yes/no)’; and (2) ‘Have you ever had 2 years or more in your life when you felt depressed or sad most days, even if you felt okay sometimes? (yes/no)’ in addition to responding at least ‘some of the time’ to the question ‘how much of the time during the past 4 weeks have you felt downhearted and blue? (none of the time/some of the time/most of the time/all of the time’. This last question is a replacement for a similar question used in the methods proposed by Rost et al., asking how much of the time in the past week the participant felt depressed [32].
No information is available on the sensitivity and specificity of these 3 items in a Medicare population. However, Whooley and colleagues (1997) examined the sensitivity and specificity of a two-item self-report depression screener from the DIS (“During the past month, have you often been bothered by feeling down, depressed, or hopeless?” and (2) “During the past month, have you often been bothered by little interest or pleasure in doing things?”) in an older study population with an average age of 53 [33]. For Whooley’s two-item depression screener, a sensitivity of 96% (95% CI: 90–99), specificity of 57% (95% CI: 53–62), and area under the ROC curve of .82 (95% CI: .78–.86) were found [33]. Due to the similarities in the study populations and the questions administered, it is likely that the sensitivity and specificity of the 3 DIS items in our Medicare population would be comparable. The gold standard for identifying those at risk of MDD would be a diagnosis by a trained physician, which would be immensely difficult to obtain for a sample size as large as the one utilized here.
UI was defined by an affirmative to the following question: ‘Many people experience problems with urinary incontinence, the leakage of urine. In the previous six months, have you accidentally leaked urine? (yes/no)’ in conjunction with indicating that the urine leakage was either ‘a big problem’ or a ‘small problem’ via the question ‘How much of a problem, if any, was the urine leakage to you?’ (a big problem/a small problem/not a problem).
HRQOL scores were assessed by the Short-Form 36 (SF-36, version 1) and, subsequently the Veterans Rand-12 (VR-12). The MHOS switched from the SF-36 to the VR-12 in 2006, thus affecting the surveys from the last two cohorts included in this analysis. SF-36 and VR-12 Physical Component Summary (PCS) scores have been linked using a published algorithm [34]. The PCS T-score metric was normed, with the average in the U.S. population being 50 and a standard deviation of 10 [35]. Higher scores reflect better HRQOL. All available physical subscales were used, including bodily pain (BP), role-physical (RP), physical functioning (PF) and general health (GH) [36]. The mental subscales utilized (social functioning (SF), role-emotional (RE) and vitality (VT)) did not include the Mental Component Summary (MCS) or mental health (MH) subscale as both scales relied on the one of the questions used to screen for risk of MDD [36]. The subscales were defined by items that were transformed on a 0–100 scale. The subscales, unlike PCS, are not normed to the U.S. population average.
Key variables investigated in this analysis included: cancer diagnosis, age at survey, current smoking status, race, gender, marital status, education, comorbid conditions, time since diagnosis, cancer severity and difficulty with activities of daily living (defined as responding affirmatively to one or more of the following: difficulty getting out of a chair, using a toilet, walking, dressing, eating, or bathing). Comorbid conditions were defined as a dichotomous variable (yes/no) and were self-reported on the MHOS survey by participants.
Statistical Analysis
Univariate distributions of demographic and clinical covariates of the study population were characterized by cancer type (bladder, breast, colorectal, endometrial/uterine, lung, and prostate) and variables were defined as follows (index/referent): MDD (yes/no), UI (yes/no), age (65–74, 75–84, ≥85), smoking status (yes/no), race (other/non-Hispanic white), gender (male/female), marital status (other/married), education (> high school, ≤ high school), high blood pressure (yes/no), stroke (yes/no), chronic lung disease (including COPD, asthma and emphysema) (yes/no), gastrointestinal (including Crohn’s disease, ulcerative colitis, and inflammatory bowel disease) (yes/no), diabetes (yes/no), difficulty completing one or more activities (getting out of a chair, using the toilet, walking, bathing, dressing, eating) (yes/no), joint pain (yes/no), any cardiovascular disease (one or more of chronic heart failure, myocardial infarction, angina or coronary artery disease, or other heart condition) (yes/no), cancer severity (distant or regional/in situ or localized), and time since cancer diagnosis to time of survey (defined as: survey within 2 years after diagnosis, survey within 2–5 years after diagnosis, and survey >5 years after cancer diagnosis). Time since diagnosis categorizations were selected to approximate active or early post treatment, short-term survival, and long-term cancer survival periods, respectively. A chi-square was used to test the difference in the distribution of the categorical demographic and clinical covariates between each cancer group compared to those without cancer. The variable for time since diagnosis and cancer severity did not have a clear referent group (as the referent group in this model is those without cancer) and thus was not tested for significance.
Due to the very large sample size of this study, a minimally important difference (MID) equal to 1/3 of the standard deviation was used to determine statistical significance for continuous HRQOL measures (PCS is normed to a standard deviation of 10; for subscales, the standard deviation of those without cancer was used) [37]. Unless noted, all future references to statistical significance for HRQOL scales are based on their respective MID.
Logistic regression models were used to examine demographic and clinical factors associated with MDD by calculating Prevalence Odds Ratios (PORs) and 95% Confidence Intervals (95% CIs). The variables in the model included all cancer types and other demographic and clinical factors used in univariate analyses. Another logistic model was performed limited to cancer survivors (excluding non-cancer individuals) and included variables for cancer severity and time since cancer diagnosis. Cancer survivors with colorectal cancer were chosen as the referent group in this second model due to a similar prevalence of MDD and UI compared to the no cancer group.
Linear regression models were used to estimate the adjusted means on HRQOL, by cancer site, combined MDD and UI status, adjusting for relevant covariates listed above for the logistic regression models. A multiplicative interaction was assessed between MDD and UI for HRQOL using cross-product terms in the linear regression model. For this analysis, Medicare beneficiaries were defined based on their joint reporting of MDD and UI by creating 3 dummy variables for the regression models. This resulted in them being categorized into four different groups: (1) no MDD, no UI; (2) no MDD, UI; (3) MDD, no UI; and, (4) MDD, UI.
All statistical analysis was completed using SAS 9.3 (Cary, NC).
Results
The distributions of demographic and clinical covariates by cancer type are shown in Table I. The mean (SD) of PCS in the no cancer population was 39.8 (12.0). The mean score for many HRQOL scales (PCS, BP, PF, GH, SF, RE and VT) for those diagnosed with lung cancer was significantly lower than the mean HRQOL score for participants without cancer. The prevalence of MDD risk among cancer patients ranged from 19.2% in prostate cancer patients to 34.1% in lung cancer; compared to a prevalence of 20.5% in the no cancer population. Reporting UI was more common across all cancer types than in the no cancer group (27.1%) but was particularly high among older Americans with a history of endometrial/uterine, breast and prostate cancers. In general, the percentage of the no cancer group suffering from comorbid health conditions tended to be lower than the proportions among cancer survivors. This may be due, in part, to a higher percentage of individuals of an older age at the time of survey completion in the cancer group compared to those with no cancer.
Table I.
Distribution of Demographic and Clinic Characteristics by Cancer Typea
| Bladder | Breast | Colorectal | Endometrial/Uterine | Lung | Prostate | No cancer | |
|---|---|---|---|---|---|---|---|
| N=710 | N=2,649 | N=1,645 | N=538 | N=607 | N=3,133 | N=289,744 | |
| N (%) | N (%) | N (%) | N (%) | N (%) | N (%) | N (%) | |
| Age | |||||||
| 65–74 | 240 (33.8) | 1,112 (42.0) | 557 (33.9) | 196 (36.4) | 284 (46.8) | 1,202 (38.4) | 147,521 (50.9) |
| 75–84 | 362 (51.0) | 1,118 (44.6) | 793 (48.2) | 258 (48.0) | 276 (45.5) | 1,572 (50.1) | 113,178 (39.1) |
| ≥85 | 108 (15.2)** | 356 (13.4)** | 295 (17.9)** | 84 (15.6)** | 47 (7.7)** | 359 (11.5)** | 29,045 (10.0) |
| Current smoker | |||||||
| Yes | 105 (15.0)** | 201 (7.7)** | 123 (7.6)** | 18 (3.4)** | 107 (17.9)** | 281 (9.1) | 28,662 (10.0) |
| Race | |||||||
| White | 616 (89.0) | 2,122 (82.2)** | 1283 (80.8)** | 429 (82.3)** | 484 (82.2)** | 2413 (79.3)** | 245,074 (86.5) |
| Gender | |||||||
| Female | 220 (31.0)** | 2,649 (100) | 836 (50.8)** | 538 (100) | 317 (52.2)** | 0 | 175,531 (60.6) |
| Male | 490 (69.0) | 0 (0) | 809 (49.2) | 0 | 290 (47.8) | 3,133 (100) | 114,213 (39.4) |
| Marital status | |||||||
| Not married | 259 (38.3)** | 1,441 (56.9)** | 706 (44.9) | 283 (55.6)** | 266 (46.0) | 720 (24.2)** | 120,063 (43.3) |
| Education | |||||||
| > High school | 271 (38.8)** | 990 (37.8)** | 579 (35.8)* | 208 (39.0)** | 209 (35.3) | 1,380 (44.8)** | 93,698 (32.9) |
| Comorbid Conditions | |||||||
| High blood pressure | 444 (63.3) | 1,699 (64.9)** | 1031 (63.1) | 346 (64.8) | 355 (59.2) | 1,813 (58.4)** | 175,848 (61.3) |
| Stroke | 82 (11.8)** | 197 (7.5)* | 173 (10.7)** | 38 (7.1) | 75 (12.5)** | 329 (10.6)** | 25,155 (8.8) |
| Cardiovascular disease | 320 (45.4)** | 772 (29.3)** | 578 (35.4) | 156 (29.1)* | 237 (39.4)** | 1,090 (35.0) | 96,350 (33.4) |
| Chronic lung disease | 114 (16.4)* | 349 (13.4) | 218 (13.5) | 52 (9.8)* | 260 (43.7)** | 431 (13.9) | 37,678 (13.2) |
| Gastrointestinal problem | 37 (5.3) | 138 (5.3) | 161 (10.1)** | 38 (7.2)** | 28 (4.8) | 123 (4.0) | 13,323 (4.7) |
| Diabetes | 150 (21.5) | 526 (20.1) | 364 (22.5)** | 115 (21.7) | 123 (20.5) | 630 (20.3) | 56,387 (19.6) |
| Joint pain | 361 (51.3) | 1,495 (56.7)** | 782 (47.8)** | 306 (57.4)** | 280 (46.5)* | 1,434 (45.9)** | 147,409 (51.1) |
| Difficulty completing activitiesb | 357 (50.4)** | 1,217 (46.2)** | 764 (47.0)** | 286 (53.6)** | 355 (59.2)** | 1,336 (43.1) | 121,847 (42.3) |
| Time since cancer diagnosis | |||||||
| <2 years | 203 (28.6) | 533 (20.1) | 366 (22.3) | 59 (11.0) | 316 (52.1) | 679 (21.7) | N/A |
| 2–5 years | 162 (22.8) | 565 (21.3) | 385 (23.4) | 57 (10.6) | 101 (16.6) | 771 (24.6) | N/A |
| ≥5 years | 345 (48.6) | 1551 (58.6) | 894 (54.4) | 422 (78.4) | 190 (31.3) | 1,683 (53.7) | N/A |
| Cancer Severity | |||||||
| In Situ/Localized | 516 (86.3) | 1,802 (79.6) | 859 (61.1) | 390 (86.5) | 243 (46.3) | 2366 (78.3) | N/A |
| Regional/Distant | 82 (13.7) | 462 (20.4) | 546 (38.9) | 61 (13.5) | 282 (53.7) | 657 (21.7) | N/A |
| Urinary Incontinence (UI) | |||||||
| Yes | 202 (28.8) | 921 (35.2)** | 461 (28.5) | 214 (40.2)** | 177 (29.7) | 1,024 (33.1)** | 77,725 (27.1) |
| Major Depressive Disorder (MDD) | |||||||
| Yes | 173 (24.4)* | 587 (22.2)* | 362 (22.0) | 127 (23.6) | 207 (34.1)** | 602 (19.2) | 59,465 (20.5) |
| Coexisting UI and MDD | |||||||
| Yes | 71 (10.1) | 283 (10.8)** | 148 (9.1) | 64 (12.0)** | 85 (14.2)** | 286 (9.2) | 24,727 (8.6) |
| Physical Component Score (PCS) | |||||||
| Mean (SD) | 37.3 (11.6) | 37.7 (12.0) | 37.8 (11.7) | 36.9 (12.0) | 32.2 (11.4)*** | 39.7 (11.8) | 39.8 (12.0) |
| Bodily Pain (BP) | |||||||
| Mean (SD) | 62.8 (28.0) | 64.0 (27.7) | 64.8 (27.3) | 63.4 (28.2) | 55.9 (30.0)*** | 67.9 (27.3) | 66.5 (27.4) |
| Role-physical (RP) | |||||||
| Mean (SD) | 45.2 (43.4) | 48.5 (31.5) | 46.4 (43.7) | 47.3 (42.3) | 33.2 (38.9) | 51.0 (43.3) | 53.9 (43.8) |
| Physical Functioning (PF) | |||||||
| Mean (SD) | 54.7 (32.0) | 52.4 (31.5) | 52.9 (32.0) | 49.0 (31.5) | 40.0 (30.4)*** | 59.8 (31.7) | 58.3 (31.8) |
| General Health (GH) | |||||||
| Mean (SD) | 51.6 (21.5) | 55.7 (22.4) | 53.7 (23.0) | 56.5 (22.7) | 40.4 (23.1)*** | 54.9 (22.6) | 57.9 (22.4) |
| Social Functioning (SF) | |||||||
| Mean (SD) | 73.2 (28.2) | 76.3 (27.8) | 73.7 (28.5) | 75.6 (27.8) | 61.6 (31.9)*** | 76.7 (27.1) | 78.5 (26.9) |
| Role-emotional (RE) | |||||||
| Mean (SD) | 69.0 (40.1) | 72.1 (39.7) | 67.6 (41.5) | 71.9 (42.3) | 57.4 (43.8)*** | 72.0 (40.1) | 73.3 (39.5) |
| Vitality (VT) | |||||||
| Mean (SD) | 51.4 (22.4) | 53.3 (22.4) | 53.2 (22.4) | 52.9 (21.4) | 42.2 (24.6)*** | 55.9 (22.8) | 55.9 (22.4) |
Two-tailed p-value for chi-squared test, comparing distribution of covariate of cancer group to no cancer group where applicable, or t-test for HRQoL scores.
Difficulty defined as difficulty completing one or more activities (getting out of a chair, using the toilet, walking, bathing, dressing, eating)
p <0.05
p <0.01
Significance for PCS and SF defined using a minimally important difference (MID) equal to 1/3SD
The prevalence of co-occurring UI and MDD risk was highest in those with lung cancer (14.2%) and endometrial/uterine cancer (12.0%) whereas among those without cancer the prevalence was 8.6%. The prevalence ranged from 9.2% to 10.8% in all other cancer types.
Factors associated with MDD risk among Medicare beneficiaries with and without cancer are presented in Table II. Being diagnosed with lung cancer (POR= 1.66, 95% CI: 1.37, 2.01) was associated with the largest increase in odds of risk for MDD across cancer types; whereas being diagnosed with other cancer diagnoses (breast, colorectal, endometrial/uterine and prostate) was not associated with elevated MDD risk. Another significant factor associated with MDD was having difficulty completing daily activities (POR= 2.55, 95% CI: 2.50, 2.61). UI was in particular significantly associated with MDD (POR=1.68, 95%CI: 1.63, 1.70), as was being a current smoker (POR= 1.40, 95% CI: 1.35, 1.44). Other variables with significant POR above 1.2 included being not married, having less education, stroke, chronic lung disease, gastrointestinal problems, joint pain and cardiovascular disease.
Table II.
Logistic regression results for associations with major depressive disorder (MDD) compared to older Americans without cancer.
| Variable | POR | 95% CI | P | |
|---|---|---|---|---|
| Urinary Leakage | ||||
| UI | 1.68 | (1.63, 1.70) | <.0001 | |
| Cancer typea | ||||
| Bladder | 1.21 | (1.00, 1.47) | 0.05 | |
| Breast | 1.00 | (0.90, 1.12) | 0.9 | |
| Colorectal | 1.06 | (0.92, 1.21) | 0.4 | |
| Endometrial/Uterine | 0.99 | (0.79, 1.24) | 0.9 | |
| Lung | 1.66 | (1.37, 2.01) | <.0001 | |
| Prostate | 1.03 | (0.93, 1.14) | 0.6 | |
| Demographicsb | ||||
| Age (65–74) | 1.19 | (1.15, 1.23) | <.0001 | |
| Age (75–84) | 1.03 | (0.99, 1.06) | <.0001 | |
| Current Smoker | 1.40 | (1.35, 1.44) | <.0001 | |
| Race (non-white) | 1.17 | (1.14, 1.20) | <.0001 | |
| Gender (male) | 0.96 | (0.94, 0.98) | 0.001 | |
| Marital Status (not married) | 1.47 | (1.44, 1.50) | <.0001 | |
| Education (> high school) | 0.70 | (0.69, 0.72) | <.0001 | |
| Comorbid conditionsb | ||||
| High blood pressure | 1.06 | (1.04, 1.09) | <.0001 | |
| Stroke | 1.45 | (1.40, 1.50) | <.0001 | |
| Chronic lung disease | 1.39 | (1.35, 1.42) | <.0001 | |
| Gastrointestinal problems | 1.80 | (1.72, 1.87) | <.0001 | |
| Diabetes | 1.14 | (1.11, 1.16) | <.0001 | |
| Joint Pain | 1.32 | (1.29, 1.35) | <.0001 | |
| Cardiovascular disease | 1.31 | (1.29, 1.34) | <.0001 | |
| Activities of daily living | ||||
| Difficulty | 2.55 | (2.50, 2.61) | <.0001 |
Noncancer participants are referent for cancer type
Demographics and comorbidities adjustment set (index, referent): age at survey (65–74, 75–84, 85+), smoker (yes, no), race (other, white), gender (male, female), marital status (other, married), education (> high school, ≤ high school), high blood pressure, stroke, chronic lung disease (includes COPD, emphysema or asthma), gastrointestinal problems (including Crone’s, ulcerative colitis, or inflammatory bowel disease) diabetes, joint pain, cardiovascular disease, and difficulty completing one or more activities (getting out of chair, use of toilet, walking, eating, dressing, bathing)
The estimates for factors associated with MDD risk among only the cancer survivors and when taking into account time since diagnosis and cancer severity are similar in magnitude to the results presented in Table II. When fitting the same model only among cancer patients, a slight decrease in odds of MDD (Table III; POR=0.83, 95%CI 0.72, 0.97) was observed for cancer survivors who were more than 5 years from diagnosis relative to those less than 2 years from diagnosis. Cancer severity was not significantly related with MDD risk.
Table III.
Logistic regression results for associations with major depressive disorder (MDD) among cancer cases, controlling for cancer severity and time since diagnosis.
| Variable | POR | 95% CI | P | |
|---|---|---|---|---|
| Urinary Leakage | ||||
| UI | 1.62 | (1.43, 1.83) | <.0001 | |
| Cancer typea | ||||
| Bladder | 1.20 | (0.92, 1.56) | 0.2 | |
| Breast | 0.95 | (0.77, 1.18) | 0.7 | |
| Colorectal | 1.00 (ref) | -- | -- | |
| Endometrial/Uterine | 0.98 | (0.72, 1.19) | 0.9 | |
| Lung | 1.36 | (1.04, 1.77) | 0.02 | |
| Prostate | 0.96 | (0.78, 1.19) | 0.7 | |
| Demographicsb | ||||
| Age (65–74) | 1.35 | (1.10, 1.64) | 0.001 | |
| Age (75–84) | 1.13 | (0.94, 1.36) | 0.7 | |
| Current Smoker | 1.37 | (1.12, 1.67) | 0.002 | |
| Race (non-white) | 1.04 | (0.89, 1.21) | 0.6 | |
| Gender (male) | 1.02 | (0.82, 1.27) | 0.9 | |
| Marital Status (not married) | 1.54 | (1.35, 1.75) | <.0001 | |
| Education (> high school) | 0.68 | (0.60, 0.80) | <.0001 | |
| Comorbid conditionsb | ||||
| High blood pressure | 1.10 | (0.97, 1.26) | 0.1 | |
| Stroke | 1.38 | (1.15, 1.67) | 0.007 | |
| Chronic lung disease | 1.46 | (1.25, 1.71) | <.0001 | |
| Gastrointestinal problems | 1.93 | (1.54, 2.42) | <.0001 | |
| Diabetes | 0.96 | (0.82, 1.11) | 0.5 | |
| Joint Pain | 1.31 | (1.15, 1.49) | <.0001 | |
| Cardiovascular disease | 1.24 | (1.09, 1.41) | 0.0009 | |
| Time from cancer to survey | ||||
| <2 years | 1.00 (ref) | -- | -- | |
| 2–5 years | 0.86 | (0.72, 1.02) | 0.08 | |
| ≥5 years | 0.83 | (0.72, 0.97) | 0.02 | |
| Cancer Severity | ||||
| In situ/Localized | 1.00 (ref) | -- | -- | |
| Regional/Distant | 1.07 | (0.93, 1.22) | 0.4 | |
| Activities of daily living | ||||
| Difficulty | 2.80 | (2.44, 3.20) | <.0001 |
Colorectal cancer patients within 2 years of treatment, with in situ/localized cancer and those in the referent group of all demographic and comorbid conditions are referent group in model.
Demographics and comorbidities adjustment set (index, referent): age at survey (65–74, 75–84, 85+), smoker (yes, no), race (other, white), gender (male, female), marital status (other, married), education (> high school, ≤ high school), high blood pressure, stroke, chronic lung disease (includes COPD, emphysema or asthma), gastrointestinal problems (including Crone’s, ulcerative colitis, or inflammatory bowel disease) diabetes, joint pain, cardiovascular disease, and difficulty completing one or more activities (getting out of chair, use of toilet, walking, eating, dressing, bathing)
Results from linear regression of co-occurrence of MDD and UI and cancer types associated with PCS and physical HRQOL subscales (BP, RP, PF and GH) adjusted for demographic factors and comorbid conditions are presented in Table IVa. Decrements in PCS and physical subscales associated with UI, MDD and coexisting UI and MDD are illustrated in Figure 1. The estimate for the intercept in this model represents the adjusted mean PCS or physical subdomain score for the non-cancer group without any comorbid conditions. A statistical interaction (p <0.001) was observed between UI and MDD with PCS, BP, RP and PF, and therefore the results are presented by the combined prevalence of these two conditions. In this analysis, the co-occurrence of MDD and UI was also associated with an almost 3-point decrease in PCS (adjusted mean score= 47.36, 95% CI: 47.22, 47.51), which was not significant based on the MID criteria. However, the co-occurrence of MDD and UI was significantly associated with decreased HRQOL as defined by the MID criterion for BP (adjusted mean score=73.48, 95%CI: 74.12, 74.82), RP (adjusted mean score=68.81, 95%CI: 68.10, 69.52) and GH (adjusted mean score=62.31, 95%CI: 62.00, 62.62). For PCS and GH, lung cancer diagnosis was also significantly associated with decreased scores.
Table IVa.
Adjusted mean scores for HRQOL subscales for combined major depressive disorder (MDD) and urinary incontinence (UI) among older Americans diagnosed with cancer.a
| PCS | BP | RP | PF | GH | |||||||
|---|---|---|---|---|---|---|---|---|---|---|---|
| Variable | Mean | 95% CI | Mean | 95% CI | Mean | 95% CI | Mean | 95% CI | Mean | 95% CI | |
| Intercept | 50.19 | (50.11, 50.28) | 87.00 | (86.92, 87.37) | 88.40 | (87.95, 88.81) | 83.85 | (83.60, 84.08) | 74.88 | (74.70, 75.06) | |
| Major Depressive Disorder and Urinary Incontinence | |||||||||||
| No MDD + UI | 48.32 | (48.21, 48.44) | 83.10 | (84.11, 84.63) | 80.50 | (79.95, 81.05) | 79.73 | (79.43, 80.04) | 72.36 | (72.12, 72.59 ) | |
| MDD + No UI | 48.44 | (48.31, 48.57) | 76.57* | (76.23, 76.90) | 72.01* | (71.38, 72.64) | 77.38 | (77.02, 77.73) | 64.91* | (64.63, 65.18) | |
| MDD + UI | 47.36 | (47.22, 47.51) | 73.48* | (74.12, 74.82) | 68.81* | (68.10, 69.52) | 73.35 | (72.95, 73.75) | 62.31* | (62.00, 62.62) | |
| Cancer typeb | |||||||||||
| Bladder | 49.07 | (48.40, 49.74) | 85.09 | (83.61, 86.94) | 84.37 | (81.24, 87.50) | 83.23 | (81.41, 85.05) | 71.47 | (70.06, 72.88) | |
| Breast | 49.34 | (49.00, 49.70) | 86.79 | (86.09, 87.84) | 85.63 | (83.95, 87.30) | 81.92 | (80.97, 82.87) | 73.28 | (72.58, 74.01 ) | |
| Colorectal | 49.28 | (48.83, 49.72) | 86.32 | (85.38, 87.60) | 85.90 | (83.77, 88.03) | 81.57 | (80.37, 82.78) | 72.77 | (71.83, 73.70 ) | |
| Endometrial/Uterine | 49.85 | (49.08, 50.61) | 88.38 | (86.59, 90.04) | 89.11 | (85.43, 92.78) | 81.68 | (79.61, 83.76) | 75.28 | (73.67, 76.89 ) | |
| Lung | 45.80* | (45.08, 46.52) | 81.97 | (80.33, 83.93) | 77.53 | (74.28, 80.78) | 74.32 | (72.35, 76.28) | 64.20* | (62.68, 65.72) | |
| Prostate | 49.82 | (49.48, 50.15) | 86.88 | (86.15, 87.81) | 85.97 | (84.40, 87.54) | 83.73 | (82.82, 84.63) | 73.06 | (72.36, 73.76) | |
PCS= Physical component score; BP= bodily pain; RP= role-physical; PF= physical functioning; GH= general health.
Demographics and comorbidities adjustment set (index, referent): age at survey (65–74, 75–84, 85+), smoker (yes, no), race (other, white), gender (male, female), marital status (other, married), education (> high school, ≤ high school), high blood pressure, stroke, chronic lung disease (includes COPD, emphysema or asthma), gastrointestinal problems (including Crone’s, ulcerative colitis, or inflammatory bowel disease) diabetes, difficulty completing one or more activities (getting out of chair, use of toilet, walking, eating, dressing, bathing), joint pain, cardiovascular disease
Noncancer participants are referent for cancer type
Clinical significance for HRQOL scales defined using a minimally important difference (MID) equal to 1/3SD
Figure 1.
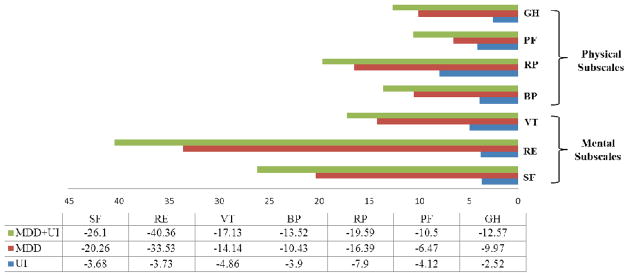
Decrements in physical and mental HRQOL subscalesa associated with urinary incontinence (UI), major depressive disorder (MDD) and coexisting MDD and UI among Medicare beneficiaries, adjusting for demographics and comorbid conditionsb.
aBP= bodily pain; RP= role-physical; PF= physical functioning; GH= general health; SF= social functioning; RE= role-emotional; VT=vitality
bDemographics and comorbidities adjustment set (index, referent): age at survey (65–74, 75–84, 85+), smoker (yes, no), race (other, white), gender (male, female), marital status (other, married), education (> high school, ≤ high school), high blood pressure, stroke, chronic lung disease (includes COPD, emphysema or asthma), gastrointestinal problems (including Crone’s, ulcerative colitis, or inflammatory bowel disease) diabetes, difficulty completing one or more activities (getting out of chair, use of toilet, walking, eating, dressing, bathing), joint pain, cardiovascular disease
The results for the co-occurrence of MDD and UI and cancer types associated with mental HRQOL subscales (SF, RE, and VT) are presented in Table IVb. Decrements in mental subscales associated with UI, MDD and coexisting UI and MDD are also illustrated in Figure 1. For the three mental subdomains included in this analysis, the co-occurrence of MDD and UI was significantly associated with decreased HRQOL scores. This was especially prominent for RE, with an average decrease of 40 points for those with MDD and UI (adjusted mean score=55.33, 95%CI: 54.65, 56.02). Similarly for SF scores, the co-occurrence of both MDD and UI was associated with a large observed decrease in SF (adjusted mean score=71.5, 95%CI: 71.14, 71.87). Similarly to PCS and GH, Medicare beneficiaries with lung cancer had the lowest SF (adjusted mean score=88.06, 95%CI: 86.14, 89.98) and VT score across cancer types (adjusted mean score=65.33, 95%CI: 63.85, 66.80).
Table IVb.
Adjusted mean scores for HRQOL subscalesa for combined major depressive disorder (MDD) and urinary incontinence (UI) among older Americans diagnosed with cancerb
| SF | RE | VT | |||||
|---|---|---|---|---|---|---|---|
| Variable | Mean | 95% CI | Mean | 95% CI | Mean | 95% CI | |
| Intercept | 97.60 | (97.39, 97.82) | 95.69 | (95.28, 96.10) | 72.90 | (72.73, 73.08) | |
| Major Depressive Disorder and Urinary Incontinence | |||||||
| No MDD + UI | 93.92 | (93.64, 94.20) | 91.96 | (91.42, 92.49) | 68.04 | (67.81, 68.27) | |
| MDD + No UI | 77.34* | (77.02, 77.67) | 62.16* | (61.55, 62.77) | 58.76* | (58.49, 59.02) | |
| MDD + UI | 71.50* | (71.14, 71.87) | 55.33* | (54.65, 56.02) | 55.77* | (55.47, 56.07) | |
| Cancer typec | |||||||
| Bladder | 95.88 | (94.16, 97.60) | 95.20 | (92.19, 98.21) | 71.50 | (70.13, 72.86) | |
| Breast | 96.82 | (95.93, 97.70) | 96.16 | (94.55, 97.77) | 71.26 | (70.54, 71.96) | |
| Colorectal | 95.29 | (94.16, 96.41) | 93.71 | (91.65, 95.77) | 71.92 | (71.02, 72.83) | |
| Endometrial/Uterine | 98.78 | (96.85, 100.70) | 99.11 | (95.56, 102.65) | 73.12 | (71.56, 74.68) | |
| Lung | 88.06* | (86.14, 89.98) | 88.85 | (85.71, 91.98) | 65.33* | (63.85, 66.80) | |
| Prostate | 96.85 | (96.01, 97.69) | 94.65 | (93.14, 96.17) | 73.14 | (72.47, 73.83) | |
SF= social functioning; RE= role-emotional; VT=vitality.
Demographics and comorbidities adjustment set (index, referent): age at survey (65–74, 75–84, 85+), smoker (yes, no), race (other, white), gender (male, female), marital status (other, married), education (> high school, ≤ high school), high blood pressure, stroke, chronic lung disease (includes COPD, emphysema or asthma), gastrointestinal problems (including Crone’s, ulcerative colitis, or inflammatory bowel disease) diabetes, difficulty completing one or more activities (getting out of chair, use of toilet, walking, eating, dressing, bathing), joint pain, cardiovascular disease
Noncancer participants are referent for cancer type
Clinical significance for HRQOL scales defined using a minimally important difference (MID) equal to 1/3SD
Discussion
There has been considerable previous research that has demonstrated that UI has been associated with higher prevalence of depression and anxiety in the general population [15, 38, 39]. However, this is the first study, to our knowledge, to assess the co-occurrence of MDD risk and UI in a population of older Americans with and without cancer. The results of this study have high public health impact potential due to the substantial prevalence of MDD risk. In this population of Medicare beneficiaries, MDD risk was prevalent, ranging between 20–34% among cancer survivors and older Americans without cancer. This study found that the co-occurrence of MDD risk and UI had a large negative impact on RE and SF scores, as well as a similar decrease among other HRQOL scales although to a lesser extent. We did not observe significant changes in PCS meeting our MID criteria except for a 4-point decrement among lung cancer participants compared to those without cancer; however, the decrease observed may not have clinical relevance when considering other MIDs proposed for PCS in the literature [40, 41].
While high prevalence of MDD risk was observed in this study population, only a history of a lung cancer diagnosis had a strong association with reporting symptoms associated with MDD. This could be due to the poor prognosis typical of lung cancer diagnoses, as well as the fact that approximately half of lung cancer patients were within 2 years of diagnosis with more severe disease and thus, were likely in active treatment [42]. Reporting MDD was associated with many demographic and clinical factors, with the strongest factors being UI and having physical difficulty completing activities. Due to the fact that MDD is often underdiagnosed, the results of this study highlight particular factors that may be useful in identifying MDD and improving diagnosis and treatment of it among older Americans with and without cancer [43]. A longitudinal study among men found that untreated depressive symptoms at baseline to be associated with an almost 3-fold increased risk of nocturia at follow-up [44]. Therefore, identification and subsequent treatment of MDD may aid in the prevention of future UI symptoms. [45]
While cancer severity was not found to be associated with MDD, the results do suggest that increasing years from time of diagnoses among cancer survivors was associated with decreased odds of reporting MDD. Prevalence of depression being the highest immediately after diagnosis and decreasing over time has been previously reported among breast cancer survivors [46, 47] but was not observed in a New Zealand cohort of cancer survivors [48]. These differences could be due to geographic differences in the study populations or differing medical and treatment experiences. A population-based study of long-term cancer survivors did not find an increased risk of MDD compared to the general population [49], which supports the finding reported here that suggests MDD risk might be more relevant in the first two years after a diagnosis.
We also found age at time of survey to be inversely associated with risk of MDD, although this effect was not strong in magnitude. Previous reports investigating the effect of aging on risk of MDD or depressive symptoms have been inconsistent [50–52]. Although not established, it has been hypothesized that increased age after a certain threshold may be associated with a decreased susceptibility to depressive symptoms or anxiety due to decreased emotional responsiveness [51].
The prevalence of MDD reported in this study is comparable to depression estimates previously reported among elderly populations [9]. Our method of defining MDD risk was based on a previous published algorithm for determining risk MDD based on a similar questionnaire [32]. A sensitivity analysis defining ‘depressive symptoms’ as an affirmative response to any one of the three MDD questions increased the prevalence but did not significantly alter results of conclusions for the predictors of MDD or the associations with HRQOL scales.
Decrements across multiple HRQOL scales (PCS, GH, SF and VT) were associated with lung cancer diagnoses. However, for many of the HRQOL subscales the lowest average adjusted mean score was observed for the coexistence of both MDD and UI; this decrement was particularly strong for SF and RE. The decrements observed ranged in magnitude from almost 10 points on the PF to almost 40 on RE; changes this large in magnitude are considered moderate to large clinically important differences [40]. This suggests that these two conditions together have a considerable impact on the emotional and social lives of Medicare beneficiaries, more so than the cancer diagnoses investigated in this analysis. Improved awareness of the emotional and social impact of these conditions, among other HRQOL decrements, may promote the advancement of strategies for detection and treatment of both MDD and UI.
This study is limited by the cross-sectional nature, and thus we cannot draw conclusions about temporality between MDD, UI and HRQOL. In addition, there were predictors of MDD or UI that could not be included in this analysis such as history of MDD, treatment of MDD, cognitive impairment and social contacts [53]. There were also unmeasured risk factors for UI such as other urological conditions and reproductive history [54, 55] that could be relevant to prevalent UI and thus, HRQOL scales. In addition, we could not take into account cancer treatments due to large amounts of missing data which could have impacted the relationship between MDD, UI and HRQOL scores.
This analysis has many strengths, in particular it benefits from the large sample size and the extensive information available in the linked SEER-MHOS database and the ability to compare across cancer types as well as between cancer survivors and those without cancer. Many previous reports about MDD in cancer survivors have been limited to investigating the association in one cancer diagnosis type (eg: breast) [56, 57] or have been conducted in younger populations [58]. We were also able to adjust for relevant covariates, such as demographics, comorbid conditions and clinical characteristics that are associated with MDD and HRQOL scales.
As the population of both cancer survivors and the elderly continue to grow in the U.S., it will be important to identify health concerns that contribute to quality of life. In particular, this report highlights two conditions, MDD and UI, which are prevalent in elderly populations and the co-occurrence result in significant decrements in HRQOL. Both MDD and UI are often underdiagnosed, but treatable conditions [38, 44]. The predictors of MDD identified in this paper could be useful in screening for these conditions in older Americans with and without cancer, a population already susceptible for lower HRQOL. By better understanding the predictors of MDD and the joint impact of MDD and UI among cancer survivors, survivorship efforts can be focused to address these conditions and improve the HRQOL of this growing population.
Acknowledgments
Supported in part by grant ES07018 from the National Institute of Environmental Health Sciences and by the UNC Lineberger Cancer Control Education Program (R25 CA57726).
Footnotes
Competing Interests
The authors have no conflicts of interest or financial disclosures.
References
- 1.Centers for Disease Control and Prevention. The State of Aging and Health in America Center for Disease Control. 2007 [cited 2012 1 December 2012]; Available from: http://apps.nccd.cdc.gov/SAHA/Default/Default.aspx.
- 2.Ries LAG, et al. SEER Cancer Statistics Review, 1975–2004. 2007 [cited 2012 1 December 2012]; Available from: http://seer.cancer.gov/csr/1975_2004/
- 3.Howlander N, et al. SEER Cancer Statistics Review, 1975–2009 (Vintage 2009 Populations),2011. 2012 Apr; Available from: http://seer.cancer.gov/csr/1975_2009_pops09/ based on November 2011 SEER data submission, posted to the SEER web site.
- 4.Siegel R, et al. Cancer treatment and survivorship statistics, 2012. CA Cancer J Clin. 2012;62(4):220–41. doi: 10.3322/caac.21149. [DOI] [PubMed] [Google Scholar]
- 5.Bellizzi KM, Rowland J. The Role of Comorbidity, Symptoms and Age in the Health of Older Survivors Following Treatment for Cancer. Aging and Health. 2007;3:625635. [Google Scholar]
- 6.Rao AV, Demark-Wahnefried W. The older cancer survivor. Critical reviews in oncology/hematology. 2006;60(2):131–143. doi: 10.1016/j.critrevonc.2006.06.003. [DOI] [PubMed] [Google Scholar]
- 7.CDC. Current Depression Among Adults --- United States, 2006 and 2008. 2010;2010 [cited 2012; Available from: http://www.cdc.gov/mmwr/preview/mmwrhtml/mm5938a2.htm?s_cid=mm5938a2_e%0d%0a. [PubMed] [Google Scholar]
- 8.Kessler RC, et al. The epidemiology of major depressive disorder: results from the National Comorbidity Survey Replication (NCS-R) JAMA. 2003;289(23):3095–105. doi: 10.1001/jama.289.23.3095. [DOI] [PubMed] [Google Scholar]
- 9.Serby M, Yu M. Overview: depression in the elderly. Mt Sinai J Med. 2003;70(1):38–44. [PubMed] [Google Scholar]
- 10.Pirl WF. Evidence report on the occurrence, assessment, and treatment of depression in cancer patients. J Natl Cancer Inst Monogr. 2004;(32):32–9. doi: 10.1093/jncimonographs/lgh026. [DOI] [PubMed] [Google Scholar]
- 11.Gelenberg AJ. The prevalence and impact of depression. J Clin Psychiatry. 2010;71(3):e06. doi: 10.4088/JCP.8001tx17c. [DOI] [PubMed] [Google Scholar]
- 12.Anger JT, et al. The prevalence of urinary incontinence among community dwelling men: results from the National Health and Nutrition Examination survey. The Journal of urology. 2006;176(5):2103–8. doi: 10.1016/j.juro.2006.07.029. discussion 2108. [DOI] [PubMed] [Google Scholar]
- 13.Anger JT, et al. The prevalence of urinary incontinence among community dwelling adult women: results from the National Health and Nutrition Examination Survey. The Journal of urology. 2006;175(2):601–604. doi: 10.1016/S0022-5347(05)00242-9. [DOI] [PubMed] [Google Scholar]
- 14.Markland AD, et al. Prevalence and trends of urinary incontinence in adults in the United States, 2001 to 2008. The Journal of urology. 2011;186(2):589–593. doi: 10.1016/j.juro.2011.03.114. [DOI] [PMC free article] [PubMed] [Google Scholar]
- 15.Coyne KS, et al. The impact of overactive bladder, incontinence and other lower urinary tract symptoms on quality of life, work productivity, sexuality and emotional well-being in men and women: results from the EPIC study. BJU international. 2008;101(11):1388–1395. doi: 10.1111/j.1464-410X.2008.07601.x. [DOI] [PubMed] [Google Scholar]
- 16.Girman CJ, et al. Health-related quality of life associated with lower urinary tract symptoms in four countries. Urology. 1998;51(3):428–436. doi: 10.1016/s0090-4295(97)00717-6. [DOI] [PubMed] [Google Scholar]
- 17.O’Donnell M, et al. Help-seeking behaviour and associated factors among women with urinary incontinence in France, Germany, Spain and the United Kingdom. European urology. 2005;47(3):385–92. doi: 10.1016/j.eururo.2004.09.014. discussion 392. [DOI] [PubMed] [Google Scholar]
- 18.Rosen RC, Giuliano F, Carson CC. Sexual dysfunction and lower urinary tract symptoms (LUTS) associated with benign prostatic hyperplasia (BPH) European urology. 2005;47(6):824–837. doi: 10.1016/j.eururo.2004.12.013. [DOI] [PubMed] [Google Scholar]
- 19.Kwong PW, et al. Urinary incontinence and quality of life among older community-dwelling Australian men: the CHAMP study. Age Ageing. 2010;39(3):349–54. doi: 10.1093/ageing/afq025. [DOI] [PubMed] [Google Scholar]
- 20.Manchana T. Long-term lower urinary tract dysfunction in gynecologic cancer survivors. Asian Pacific journal of cancer prevention : APJCP. 2011;12(1):285–288. [PubMed] [Google Scholar]
- 21.Parsons BA, Evans S, Wright MP. Prostate cancer and urinary incontinence. Maturitas. 2009;63(4):323–328. doi: 10.1016/j.maturitas.2009.06.005. [DOI] [PubMed] [Google Scholar]
- 22.Porter MP, Penson DF. Health related quality of life after radical cystectomy and urinary diversion for bladder cancer: a systematic review and critical analysis of the literature. The Journal of urology. 2005;173(4):1318–1322. doi: 10.1097/01.ju.0000149080.82697.65. [DOI] [PubMed] [Google Scholar]
- 23.Reeve BB, et al. Impact of diagnosis and treatment of clinically localized prostate cancer on health-related quality of life for older Americans: A population-based study. Cancer. 2012;188(22):5679–87. doi: 10.1002/cncr.27578. [DOI] [PMC free article] [PubMed] [Google Scholar]
- 24.White AJ, et al. Urinary incontinence and health-related quality of life among older Americans with and without cancer: a cross-sectional study. BMC Cancer. 2013;13:377. doi: 10.1186/1471-2407-13-377. [DOI] [PMC free article] [PubMed] [Google Scholar]
- 25.Non-surgical Treatments for Urinary Incontinence in Adult Women: Diagnosis and Comparative Effectiveness Comparative Effectiveness Review Summary Guides for Clinicians. Rockville MD: 2007. [Google Scholar]
- 26.Collado Serra A, et al. AdVance/AdVance XP Transobturator Male Slings: Preoperative Degree of Incontinence as Predictor of Surgical Outcome. Urology. 2013;81(5):1034–9. doi: 10.1016/j.urology.2013.01.007. [DOI] [PubMed] [Google Scholar]
- 27.Plotti F, et al. Urinary incontinence after radical vulvectomy treated with Macroplastique implantation. J Minim Invasive Gynecol. 2008;15(1):113–5. doi: 10.1016/j.jmig.2007.08.607. [DOI] [PubMed] [Google Scholar]
- 28.Plotti F, et al. Post radical hysterectomy urinary incontinence: a prospective study of transurethral bulking agents injection. Gynecol Oncol. 2009;112(1):90–4. doi: 10.1016/j.ygyno.2008.09.022. [DOI] [PubMed] [Google Scholar]
- 29.Avery JC, et al. Identifying the quality of life effects of urinary incontinence with depression in an Australian population. BMC Urol. 2013;13:11. doi: 10.1186/1471-2490-13-11. [DOI] [PMC free article] [PubMed] [Google Scholar]
- 30.Ambs A, et al. Overview of the SEER--Medicare Health Outcomes Survey linked dataset. Health care financing review. 2008;29(4):5–21. [PMC free article] [PubMed] [Google Scholar]
- 31.National Cancer Institute. Surveillance, Epidemiology and End Results. [cited 2012 1 December]; Available from: seer.cancer.gov.
- 32.Rost K, Burnam MA, Smith GR. Development of screeners for depressive disorders and substance disorder history. Med Care. 1993;31(3):189–200. doi: 10.1097/00005650-199303000-00001. [DOI] [PubMed] [Google Scholar]
- 33.Whooley MA, et al. Case-finding instruments for depression. Two questions are as good as many. J Gen Intern Med. 1997;12(7):439–45. doi: 10.1046/j.1525-1497.1997.00076.x. [DOI] [PMC free article] [PubMed] [Google Scholar]
- 34.Fleishman JA, Selim AJ, Kazis LE. Deriving SF-12v2 physical and mental health summary scores: a comparison of different scoring algorithms. Qual Life Res. 2010;19(2):231–41. doi: 10.1007/s11136-009-9582-z. [DOI] [PubMed] [Google Scholar]
- 35.Ware JE, Kosinski MA. Interpreting SF-36 Summary Health Measures: A Response. doi: 10.1023/a:1012588218728. [cited 2012 1 December]; Available from: http://www.sf-36.org/news/qolrsupplement.pdf. [DOI] [PubMed]
- 36.Jones N, 3rd, Jones SL, Miller NA. The Medicare Health Outcomes Survey program: overview, context, and near-term prospects. Health Qual Life Outcomes. 2004;2:33. doi: 10.1186/1477-7525-2-33. [DOI] [PMC free article] [PubMed] [Google Scholar]
- 37.Hays RD, Farivar SS, Liu H. Approaches and recommendations for estimating minimally important differences for health-related quality of life measures. COPD. 2005;2(1):63–7. doi: 10.1081/copd-200050663. [DOI] [PubMed] [Google Scholar]
- 38.Felde G, Bjelland I, Hunskaar S. Anxiety and depression associated with incontinence in middle-aged women: a large Norwegian cross-sectional study. Int Urogynecol J. 2012;23(3):299–306. doi: 10.1007/s00192-011-1564-3. [DOI] [PubMed] [Google Scholar]
- 39.Sims J, et al. Urinary incontinence in a community sample of older adults: prevalence and impact on quality of life. Disabil Rehabil. 2011;33(15–16):1389–98. doi: 10.3109/09638288.2010.532284. [DOI] [PubMed] [Google Scholar]
- 40.Wyrwich KW, et al. A comparison of clinically important differences in health-related quality of life for patients with chronic lung disease, asthma, or heart disease. Health Serv Res. 2005;40(2):577–91. doi: 10.1111/j.1475-6773.2005.00373.x. [DOI] [PMC free article] [PubMed] [Google Scholar]
- 41.Kosinski M, et al. Determining minimally important changes in generic and disease-specific health-related quality of life questionnaires in clinical trials of rheumatoid arthritis. Arthritis Rheum. 2000;43(7):1478–87. doi: 10.1002/1529-0131(200007)43:7<1478::AID-ANR10>3.0.CO;2-M. [DOI] [PubMed] [Google Scholar]
- 42.Siegel R, Naishadham D, Jemal A. Cancer statistics, 2013. CA Cancer J Clin. 2013;63(1):11–30. doi: 10.3322/caac.21166. [DOI] [PubMed] [Google Scholar]
- 43.Bell JR. Underdiagnosis of depression in primary care: by accident or design? JAMA. 1997;277(18):1433. [PubMed] [Google Scholar]
- 44.Hakkinen JT, et al. Depressive symptoms increase the incidence of nocturia: Tampere Aging Male Urologic Study (TAMUS) J Urol. 2008;179(5):1897–901. doi: 10.1016/j.juro.2008.01.037. [DOI] [PubMed] [Google Scholar]
- 45.Tannenbaum C, et al. Comorbidities associated with bladder dysfunction. Int J Clin Pract. 2013;67(2):105–13. doi: 10.1111/ijcp.12085. [DOI] [PubMed] [Google Scholar]
- 46.Avis NE, et al. Age-related longitudinal changes in depressive symptoms following breast cancer diagnosis and treatment. Breast Cancer Res Treat. 2013;139(1):199–206. doi: 10.1007/s10549-013-2513-2. [DOI] [PMC free article] [PubMed] [Google Scholar]
- 47.Giese-Davis J, et al. Decrease in depression symptoms is associated with longer survival in patients with metastatic breast cancer: a secondary analysis. J Clin Oncol. 2011;29(4):413–20. doi: 10.1200/JCO.2010.28.4455. [DOI] [PMC free article] [PubMed] [Google Scholar]
- 48.Bennett JA, et al. Time since diagnosis as a predictor of symptoms, depression, cognition, social concerns, perceived benefits, and overall health in cancer survivors. Oncol Nurs Forum. 2010;37(3):331–8. doi: 10.1188/10.ONF.331-338. [DOI] [PubMed] [Google Scholar]
- 49.Pirl WF, et al. Major depressive disorder in long-term cancer survivors: analysis of the National Comorbidity Survey Replication. J Clin Oncol. 2009;27(25):4130–4. doi: 10.1200/JCO.2008.16.2784. [DOI] [PMC free article] [PubMed] [Google Scholar]
- 50.Palsson SP, Ostling S, Skoog I. The incidence of first-onset depression in a population followed from the age of 70 to 85. Psychol Med. 2001;31(7):1159–68. doi: 10.1017/s0033291701004524. [DOI] [PubMed] [Google Scholar]
- 51.Roberts RE, et al. Does growing old increase the risk for depression? Am J Psychiatry. 1997;154(10):1384–90. doi: 10.1176/ajp.154.10.1384. [DOI] [PubMed] [Google Scholar]
- 52.Forsell Y, Winblad B. Incidence of major depression in a very elderly population. Int J Geriatr Psychiatry. 1999;14(5):368–72. doi: 10.1002/(sici)1099-1166(199905)14:5<368::aid-gps919>3.0.co;2-y. [DOI] [PubMed] [Google Scholar]
- 53.Djernes JK. Prevalence and predictors of depression in populations of elderly: a review. Acta Psychiatr Scand. 2006;113(5):372–87. doi: 10.1111/j.1600-0447.2006.00770.x. [DOI] [PubMed] [Google Scholar]
- 54.Gyhagen M, et al. The prevalence of urinary incontinence 20 years after childbirth: a national cohort study in singleton primiparae after vaginal or caesarean delivery. BJOG : an international journal of obstetrics and gynaecology. 2012 doi: 10.1111/j.1471-0528.2012.03301.x. [DOI] [PubMed] [Google Scholar]
- 55.Bodhare TN, Valsangkar S, Bele SD. An epidemiological study of urinary incontinence and its impact on quality of life among women aged 35 years and above in a rural area. Indian journal of urology : IJU : journal of the Urological Society of India. 2010;26(3):353–358. doi: 10.4103/0970-1591.70566. [DOI] [PMC free article] [PubMed] [Google Scholar]
- 56.Delgado-Sanz MC, et al. Heath-related quality of life in Spanish breast cancer patients: a systematic review. Health Qual Life Outcomes. 2011;9:3. doi: 10.1186/1477-7525-9-3. [DOI] [PMC free article] [PubMed] [Google Scholar]
- 57.Johansson M, Ryden A, Finizia C. Mental adjustment to cancer and its relation to anxiety, depression, HRQL and survival in patients with laryngeal cancer - a longitudinal study. BMC Cancer. 2011;11:283. doi: 10.1186/1471-2407-11-283. [DOI] [PMC free article] [PubMed] [Google Scholar]
- 58.Jorngarden A, Mattsson E, von Essen L. Health-related quality of life, anxiety and depression among adolescents and young adults with cancer: a prospective longitudinal study. Eur J Cancer. 2007;43(13):1952–8. doi: 10.1016/j.ejca.2007.05.031. [DOI] [PubMed] [Google Scholar]