

Abstract
The binding of proteins and ligands is generally associated with the loss of translational, rotational, and conformational entropy. In many cases, however, the net entropy change due to binding is positive. To develop a deeper understanding of the energetics of entropically driven protein–ligand binding, we calculated the absolute binding free energies and binding entropies for two HIV-1 protease inhibitors Nelfinavir and Amprenavir using the double-decoupling method with molecular dynamics simulations in explicit solvent. For both ligands, the calculated absolute binding free energies are in general agreement with experiments. The statistical error in the computed ΔG(bind) due to convergence problem is estimated to be ≥2 kcal/mol. The decomposition of free energies indicates that, although the binding of Nelfinavir is driven by nonpolar interaction, Amprenavir binding benefits from both nonpolar and electrostatic interactions. The calculated absolute binding entropies show that (1) Nelfinavir binding is driven by large entropy change and (2) the entropy of Amprenavir binding is much less favorable compared with that of Nelfinavir. Both results are consistent with experiments. To obtain qualitative insights into the entropic effects, we decomposed the absolute binding entropy into different contributions based on the temperature dependence of free energies along different legs of the thermodynamic pathway. The results suggest that the favorable entropic contribution to binding is dominated by the ligand desolvation entropy. The entropy gain due to solvent release from binding site appears to be more than offset by the reduction of rotational and vibrational entropies upon binding.
INTRODUCTION
Understanding and accurately predicting the energetics of specific binding between small molecules and proteins is an important goal in biophysical chemistry and drug discovery.1,2 Although several methods are available for modeling protein–ligand interactions at different levels of sophistication, the double decoupling method based on the alchemical free energy simulation currently represents the most rigorous approach to the calculation of absolute binding free energy.3–7 In recent years, a number of applications of this powerful method have been published and in several cases good correlations between the calculated and the experimentally determined binding affinities were obtained.8–15 Since many of the studies involved relatively small ligands, there is considerable interest in applying the double decoupling method to study more complex drug–protein systems to further validate the method for structure-based drug discovery and lead optimization.2
Because binding thermodynamics is determined by the complex interplay between enthalpy and entropy, a quantitative description of these factors is critical for elucidating the molecular driving forces for binding.16–19 The phenomenon of entropy–enthalpy compensation is frequently encountered in rational drug design, where an increase in the strength of protein–ligand interaction is partially canceled by a corresponding decrease in binding entropy, resulting in a smaller than desired change in free energy. The opposite case, the entropy–enthalpy reinforcement, is less common but it has also been observed.20 Therefore, the net change of binding free energy caused by ligand modifications can be difficult to predict based on chemical intuition. In these situations, computer simulation studies of entropy and enthalpy at the atomic detail can provide useful insights into binding mechanisms. The calculation of binding entropy and enthalpy also provides additional and more stringent tests of both the force field parametrization and simulation methodologies. In this work, we apply free energy simulations in explicit solvent to study the binding energetics of the inhibitors of human immunodeficiency virus type 1 aspartyl protease (HIV-1 PR).
HIV-1 protease performs proteolytic activity essential for the maturation of protein components of the AIDS virus.21,22 The enzyme is a homodimer composed of two symmetrically related monomers. The active site lies in a tunnel formed by the two monomers. The two flaps on top of the tunnel control the access to the active site. Because of the important role of HIV-1 PR in antiviral treatment of AIDS,23,24 the ligand binding to the enzyme has been the subject of a number of computational studies.25–31 Two empirical free energy methods, the linear interaction energy (LIE) approach32 and the molecular mechanics Poisson–Boltzmann (or generalized Born) surface area (MM-PB(GB)/SA) method,33 have been used in these studies to estimate binding affinities. The LIE approach requires parametrization against known experimental binding affinities. The majority of the calculations of the HIV-1 PR inhibitors were based on the MM-PB(GB)/SA methods.25,27–31 Since MM-PB(GB)/SA calculations are mainly used for estimating relative binding free energy,34,35 the method can be limited in predicting absolute binding affinity. In the case of HIV-1 PR inhibitors, the calculated binding free energies can deviate from experimental values by ten or more kcal/mol.27–30
The double decoupling method (DDM) is based on a more rigorous, statistical mechanical treatment of molecular association,36 and its accuracy is only limited by the quality of force fields and the extent of sampling. In this approach, rather than simulating the physical process of the protein–ligand separation in solution, a series of alchemical free energy simulations is performed during which the interactions between the ligand and its environment (binding pocket, solvent) are gradually turned off. The binding free energy is obtained from the difference in the reversible work of the two alchemical processes: the ligand decoupling from the binding pocket and that from the solvent. To obtain converged results, it is important that restraints are used to prevent the ligand from escaping the binding pocket during the ligand–protein decoupling step.8 The bias caused by the restraints must be corrected in the final calculation of the binding free energy. The methodology of DDM has been thoroughly described in two seminal papers.6,7 The latest development and applications have recently been reviewed.37 The main drawback of the method is the high computational cost required for convergence, but the continued progress in computing technology and simulation algorithm are making the DDM calculations feasible for realistic protein–ligand complexes.
Despite the fact that the ligand binding to HIV-1 protease is characterized by large favorable entropy changes,38–40 the dominant effect of entropy has not been addressed. Previous computational studies on the HIV-1 PR binding mainly focused on binding affinities or certain entropic components such as ligand configurational entropy.30,31,41 Here, we calculate the absolute binding entropy of HIV-1 PR-inhibitors using the thermodynamic formula ΔS = −(∂G/∂T)N,P by taking the finite differences of the binding free energies computed at several temperatures.15–17,42 In contrast to the direct approach based on the standard formula ΔG = ΔH − TΔS, the temperature derivative approach avoids direct evaluation of the total energy. However, the entropy calculation is still very challenging, because the generally small variations in free energy translate into relatively large errors in the total entropy contribution due to the T/ΔT factor.16,17 Careful equilibration of the enzyme–inhibitor complex and extensive sampling in each alchemical window are needed to obtain converged results.
In the present study, we choose to calculate the binding thermodynamics of Nelfinavir (NFV) and Amprenavir (APV) in complex with HIV-1 PR (Figures 1 and 2). Experimentally, both ligands exhibit strong binding affinities toward the protease, but their binding thermodynamics are very different: while the NFV binding is due to large favorable entropy, the APV binding is driven by both entropy and enthalpy.39 The calculation of the binding free energies of NFV and APV appeared to be a difficult case in previous computational studies, as both the ranking order of calculated binding affinities and the absolute binding free energies differ substantially from the experimental results.25,27–30 Using free energy simulations, we determined the absolute binding free energies and their ranking order in agreement with experiments. Our calculation also gives a semiquantitative estimate and provides insights on the entropy effects in the binding of the two HIV-1 PR inhibitors.
Figure 1.

Structure of HIV-1 PR (ribbon), with a bound Nelfinavir (ball and stick) and crystallographically resolved water molecules (red dot).
Figure 2.

HIV-1 PR inhibitors Nelfinavir and Amprenavir.
METHODS
Absolute Binding Free Energy and Entropy Calculations
Based on statistical mechanics, the standard (absolute) binding free energy for the reaction
| (1) |
is expressed in terms of the configurational integrals (Z = ∫ e−U(r)/kBT dr) for reactants and products6,7
| (2) |
Here ZX, N denotes the configurational integral of species X in a solution of N solvent molecules. Z0,N is the configurational integral of N solvent molecules. V is the volume of a system of one solute molecule solvated by N solvent molecules. V0 is the volume per solute at the standard concentration c0. Note that a pressure–volume term, PΔV, arising from the volume change upon binding is ignored in writing eq 2.7
In the double decoupling approach to the calculation of ΔG0, the binding reaction of eq 1 is replaced by the following transformations:6,7
| (3) |
| (4) |
In the first step, described by eq 3, a water-solvated ligand is transformed into a gas phase molecule denoted by Lgas; in the second step, illustrated by eq 4, a gas phase ligand is first harmonically restrained to stay in the binding pocket (Lgas* denotes a translationally restrained, gas phase ligand). Then the ligand is noncovalently coupled to its environment (the binding pocket and solvent), under the harmonic restraint.
Mathematically, the transformation depicted by eq 3 and 4 is equivalent to inserting intermediate terms into eq 2 for ΔG0:
| (5) |
where ZL*,0 and ZL,0 are the configurational integrals of gas phase ligands with and without the translational restraint, respectively. The absolute binding free energy ΔG0 is thus obtained from the calculation of three free energy contributions, i.e.
| (6) |
with
| (7) |
| (8) |
| (9) |
Here, the ΔGgas→gas* is the free energy of restraining the center of mass of a ligand, which is evaluated analytically as4
| (10) |
where K is the force constant of the harmonic restraint potential.
In the present study, the two interaction free energies ΔGgas*→complex and ΔGgas→water of eq 6 were determined using thermodynamic integration (TI)36 by simulating the decoupling of a ligand from the binding pocket and from the solvent using the coupling parameter λ. The Hamiltonian derivative 〈∂U/∂λ〉λ at a series of λ from 0 to 1 were collected and integrated to obtain the free energy difference, i.e. ΔG(λ: 0 → 1) ∫01〈∂U/∂λ〉λ dλ. During the two decoupling simulations, the electrostatic interactions between the ligand and its environment were first reversibly turned off; then the van der Waals interactions between the neutral ligand and its environment was gradually reduced to zero. The electrostatic decoupling was performed using linearly interpolated hybrid Hamiltonian from λ = 0 to 1; the van der Waals decoupling was carried out via nonlinear soft-core function43 to circumvent the singularity caused by the decoupled ligand near the end of the alchemical transformation. In calculating ΔGgas*→complex, the following λ values were used for the electrostatic decoupling: 0.1, 0.3, 0.5, 0.7, and 0.9; for the van der Waals decoupling, the following intermediate λ values were used: 0.07, 0.12, 0.2, 0.3, 0.4, 0.5, 0.55, 0.6, 0.65, 0.7, 0.75, 0.8, 0.85, 0.9, 0.94, and 0.985. Similar λ values were used in calculating ΔGgas→water. The free energy derivatives at the end points were obtained by extrapolation. To restrain ligand to the binding site during the ligand-protein decoupling, we applied a distance restraint between the ligand center of mass and the center of mass of the binding cavity. The latter is defined as the center of mass of the following residues: Asp25, Ile50, Asp25′, and Ile50′. The force constant for the harmonic distance restraint is k = 12 kcal mol−1 Å−1, which was chosen based on the equilibrium configuration volume occupied by the ligand center within the binding pocket.4,8 This volume was determined from 10 ns equilibrium simulations of the protein–ligand complexes.
Absolute binding entropies were determined using the thermodynamic relation ΔS = −(∂G/∂T): the binding free energies were computed at several temperatures (260, 275, 290, 305, and 320 K) within a small range of T, and the slope of the data points was determined from linear fit to yield estimate of binding entropy.
MD Simulation
The simulation systems of the HIV-1 PR-inhibitor complexes were prepared using the crystal structures from PDB (Nelfinavir: 1OHR; Amprenavir: 1HPV). The protein complexes were solvated in rectangular TIP3P44 water box using the tleap program of AMBER 10.45 The solute atoms were separated from nearest walls of the water box by at least 12 Å. Sodium chloride counterions were added to make the solution charge neutral. The simulation systems of the solvated inhibitors were prepared in a similar way. The solvated enzyme–inhibitor boxes contain about 34000 atoms. The solvated inhibitor systems contain about 4200 atoms.
The Amber ff99SB parameter set46 was used to model the protein in aqueous solutions. The force field parameters of the ligand were obtained using the Antechamber program47 of AMBER 10. The AM1-BCC method48 was used to assign the atomic charges for the ligands. In the present study, all the MD simulations were performed using the GROMACS program version 4.04.49 The AMBER 10 generated parameters/topology files were converted to the GROMACS format using a Perl script developed by Pande’s group.50 Electrostatic interactions were computed using the particle-mesh Ewald (PME) method,51 with a real space cutoff of 11 Å and a grid spacing of 1.0 Å. A switching function between 9 Å and 10 Å was used for van der Waals interactions. SHAKE52 was used to constrain bond lengths involving hydrogen atoms. A stochastic Langevin dynamics integrator with a friction constant of 0.4 ps−1 and a time step of 2 fs was used to integrate the equations of motion and to provide constant temperature control. The following protocol has been used to minimize and equilibrate the solvated system: the solvent alone was first minimized for 500 steps using steepest descent method followed by 500 steps of conjugated gradient method. Following the minimization steps, the system was equilibrated at the target temperature for 200 ps. The equilibration was performed in the NPT ensemble using Berendsen’s weak coupling method for constant pressure control. Finally, the equilibrated system was simulated in the production MD in the NVT ensemble.
To obtain well equilibrated initial configurations for the decoupling simulations, the solvated enzyme–inhibitor complex and the solvated ligand were equilibrated for 10 and 5 ns, respectively. For ligand–protein decoupling calculation, 11 ns simulation was performed on the solvated enzyme–inhibitor complex at each λ value. The first halves of the trajectory were treated as equilibration and the rest of trajectory were used in the thermodynamic integration. For ligand-water decoupling, 1.2 ns simulation was carried out on the solvated ligands at each λ; the data collected in the last 1 ns were used in the calculation. A total of >3 μs free energy simulation data were collected in the current work. The plots of Hamiltonian derivative 〈∂U/∂λ〉λ obtained from the decoupling simulations were shown in the Supporting Information (SI).
RESULTS AND DISCUSSION
Error and Convergence Analysis
We first estimate the errors and convergence of the calculation by comparing the ΔGbind obtained using the first half and second half of the trajectory segments at each λ. The results for the two ligands at five temperatures are given in Tables S1 and S2, SI. The deviations between the ΔGbind from the two trajectory segments are ≤1.55 kcal/mol. The error bars shown in Figure 4–6 are based on these fluctuations.
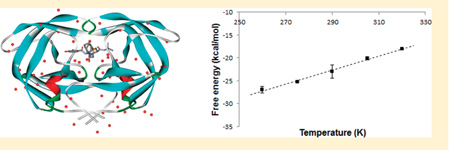
Figure 4.

Temperature dependence of the calculated absolute binding free energies of HIV-1 PR ligands: (a) NFV and (b) APV.
Figure 6.

Temperature dependence of the free energies of coupling APV with (a) the solvent and (b) the binding pocket of HIV-1 PR.
We also extended the ligand-protein decoupling simulations from 11 to 16 ns at T = 305 K. Table S3 compares the ΔGbind calculated using the 5–11 ns and extended 11–16 ns trajectories. The calculations using the extended trajectories changed the ΔGbind by about 1.6 and 1.9 kcal/mol for NFV and APV, respectively (Table S3). It is noted that the calculated relative binding free energy remains unchanged and the correct ranking order is reproduced using the different trajectory segments.
To estimate the statistical errors in the calculated ligand desolvation free energies, we performed independent ligand-water decoupling simulations at T = 305 K, starting from different initial velocities. The results for the two ligands are shown in Table S4. For APV, the fluctuations in ΔG(coupl)gas→water is about 1 kcal/mol; for NFV, while the standard deviation inΔG(coupl)gas→water is 1.39 kcal/mol, discrepancies between individual runs can reach 2.6 kcal/mol (between set 2 and set 3 runs for NFV: see Table S4).
These results together show that the statistical errors in the computed free energies are about ~1 kcal/mol for the ligand–protein decoupling and another ~1 kcal/mol for the ligand–water decoupling. The total error in the computed binding free energies due to limited sampling is about~2 kcal/mol. Since the simulations are started from the same equilibrated coordinates and different momentum distributions, the true statistical error is likely to be larger than the estimated ~2 kcal/mol. Therefore, caution should be taken in interpreting the absolute values of the binding free energies and entropies calculated here. The error analysis of the present results also suggests that the published protocols9,10 that use shorter simulations may not yield good convergence for systems with medium to large sized ligand.
Absolute Binding Free Energy Calculations
An important factor in the study of HIV-1 PR inhibitors binding is the protonation state of two catalytic aspartates D25 and D25′, which can depend on the type of the bound ligands. On the basis of energetics and structural analysis, Feig and colleagues have determined the probable protonation states for a series of HIV-1 PR ligands.29 They predicted that D25′ is protonated and D25 is anionic upon the binding of NFV or APV. We adopted this protonation assignment in the present calculation. The general agreement between our calculation and the experiments further justifies the assigned protonation states.
In this study, the ligand–protein decoupling simulations were started from the closed conformation of HIV-1 PR. Spontaneous conversion to the predominant apo structure of the enzyme, the semiopen form, did not occur throughout the decoupling simulations. In principle, the absolute binding free energy should be corrected to account for the protein reorganization free energy associated with the semiopen→closed conformational transition, i.e., ΔGbind = ΔGbind(calc) + ΔG(semi→closed). A confine-and-release method was developed to calculate the free energies of protein conformational change upon ligand binding.53 The ΔG(semi→closed) term in unliganded HIV-1 PR has been estimated using different methods. On the basis of replica exchange simulations in an implicit solvent, we estimated that at T = 314 K, ΔG(semi→closed) ≈ 0.6 kcal/mol.54 Sadiq et al. performed numerous 50 ns long explicit solvent MD simulations at 300 K and estimated that ΔG(semi→closed) ≈ 2.4 kcal/mol.55 These estimates are consistent with the fact that crystal structures containing the semiopen and closed forms have both been observed for unliganded HIV-1 PR,56 indicating that the free energy difference of the two conformations is not large. Furthermore, including the correction for the ΔG(semi→closed) would not affect the relative binding free energies between different ligands. Because of these considerations, we did not include the ΔG(semi→closed) correction in the calculation of ΔGbind.
Table1 and Table 2 show the absolute binding free energies and the related coupling free energies calculated at 305 K. The calculated ΔG(bind) (NFV: −10.5 ± 0.9 kcal/mol; APV: −14.9 ± 0.9 kcal/mol) are in good agreement with the experimentally determined values (NFV: −12.4 kcal/mol; APV: −13.5 kcal/mol).39,40,57,58 This result suggests that the calculations captured the physical forces responsible for the binding affinity and specificity in the two enzyme–inhibitor complexes.
Table 1.
Calculation of the Absolute Binding Free Energy of HIV-1 PR Inhibitor Nelfinavira
| gas→water | gas*→complex | ΔΔ: gas*→complex − gas→water | gas→gas* | water→complex | |
|---|---|---|---|---|---|
| ΔG(elec) | −25.13 | −25.29 | −0.16 | ||
| ΔG(vdw) | 5.02 | −10.84 | −15.95 | ||
| ΔG(coupl) | −20.11 | −36.12 | −16.01 | ||
| ΔG(restraint) | 5.53 | ||||
| ΔG(bind)calc | −10.48 ± 0.9 | ||||
| ΔG(bnd)expt | −12.4 ± 0.5 |
T = 305 K; Standard concentration is 1 M; Unit: kcal/mol. ΔG(coupl) = ΔG(elec) + ΔG(vdw). ΔG(bind)calc = ΔG(coupl)gas*→complex − ΔG(coupl)gas→water + ΔG(restraint) = [ΔG(elec)gas*→complex − ΔG(elec)gas→water] + [ ΔG(vdw)gas*→complex − ΔG(vdw)gas→water] + ΔG(restraint) = ΔΔG(elec) + ΔΔG(vdw) + ΔG(restraint). The error bars are estimated from the first half and second half of the simulation trajectories.
Table 2.
Same as Table 1, except for Amprenavir
| gas→water | gas*→complex | ΔΔ: gas*→complex − gas→water | gas→gas* | water→complex | |
|---|---|---|---|---|---|
| ΔG(elec) | −27.01 | −32.61 | −5.60 | ||
| ΔG(vdw) | 3.57 | −11.27 | −14.84 | ||
| ΔG(coupl) | −23.44 | −43.88 | −20.44 | ||
| ΔG(restraint) | 5.53 | ||||
| ΔG(bind)calc | −14.91 ± 0.9 | ||||
| ΔG(bind)expt | −13.5 ± 0.4 |
The calculated binding free energies and the ranking order are significantly more accurate compared with previous studies on the binding of NFV and APV toward HIV-1 PR.25–29 It is noteworthy that all of the previous calculations incorrectly favor the larger ligand NFV over the smaller APV in the computed binding free energies.25–29 The systematic bias that favors the larger ligand is likely due to two factors. First, it has been shown from explicit solvent simulations8 that ordered waters near the binding pockets stabilize the binding of HIV-1 PR inhibitors. The effect of individual bound waters was likely not adequately modeled by the MM-PB(GB)/SA and LIE calculations. Second, the configuration entropy of the bound state relative to the unbound state may not be captured in the MM-PB(GB)/SA and structural analysis, Feig and colleagues have determined the probable protonation states for a series of HIV-1 PR ligands.29 They predicted that D25′ is protonated and D25 is anionic upon the binding of NFV or APV. We adopted this protonation assignment in the present calculation. The general agreement between our calculation and the experiments further justifies the assigned protonation states.
In this study, the ligand–protein decoupling simulations were started from the closed conformation of HIV-1 PR. Spontaneous conversion to the predominant apo structure of the enzyme, the semiopen form, did not occur throughout the decoupling simulations. In principle, the absolute binding free energy should be corrected to account for the protein reorganization free energy associated with the semiopen→closed conformational transition, i.e., ΔGbind = ΔGbind(calc) + ΔG(semi→closed). A confine-and-release method was developed to calculate the free energies of protein conformational change upon ligand binding.53 The ΔG(semi→closed) term in unliganded HIV-1 PR has been estimated using different methods. On the basis of replica exchange simulations in an implicit solvent, we estimated that at T = 314 K, ΔG(semi→closed) ≈ 0.6 kcal/mol.54 Sadiq et al. performed numerous 50 ns long explicit solvent MD simulations at 300 K and estimated that ΔG(semi→closed) ≈ 2.4 kcal/mol.55 These estimates are consistent with the fact that crystal structures containing the semiopen and closed forms have both been observed for unliganded HIV-1 PR,56 indicating that the free energy difference of the two conformations is not large. Furthermore, including the correction for the ΔG(semi→closed) would not affect the relative binding free energies between different ligands. Because of these considerations, we did not include the ΔG(semi→closed) correction in the calculation of ΔGbind.
Table1 and Table 2 show the absolute binding free energies and the related coupling free energies calculated at 305 K. The calculated ΔG(bind) (NFV: −10.5 ± 0.9 kcal/mol; APV: −14.9 ± 0.9 kcal/mol) are in good agreement with the experimentally determined values (NFV: −12.4 kcal/mol; APV: −13.5 kcal/mol).39,40,57,58 This result suggests that the calculations captured the physical forces responsible for the binding affinity and specificity in the two enzyme–inhibitor complexes.
The calculated binding free energies and the ranking order are significantly more accurate compared with previous studies on the binding of NFV and APV toward HIV-1 PR.25–29 It is noteworthy that all of the previous calculations incorrectly favor the larger ligand NFV over the smaller APV in the computed binding free energies.25–29 The systematic bias that favors the larger ligand is likely due to two factors. First, it has been shown from explicit solvent simulations8 that ordered waters near the binding pockets stabilize the binding of HIV-1 PR inhibitors. The effect of individual bound waters was likely not adequately modeled by the MM-PB(GB)/SA and LIE calculations. Second, the configuration entropy of the bound state relative to the unbound state may not be captured in the MM-PB(GB)/SA and LIE calculations. As a result, the smaller ligands would be incorrectly assigned a less favorable binding free energy because their configuration entropy in the bound state is underestimated.
Decomposition of the Absolute Binding Free Energy
The free energy decomposition based on the DDM calculation provides insights into the mechanisms of ligand–protein binding and ligand solvation. Unlike the total binding free energy, the decomposition of free energy depends on the choice of alchemical path. Therefore, while the decompositionmay be useful for understanding the nature of binding, the information it provides is qualitative and should be taken with caution. Here, we first examine the components of the ligand solvation free energy ΔG(coupl)gas→water. The strongly negative electrostatic contribution ΔG(elec)gas→water (NFV: −25.13 kcal/mol; APV: −27.01 kcal/mol) arises from the Coulombic attractions between the polar groups on the ligand and the polarized solvent. The van der Waals contribution ΔG(vdw)gas→water contains two opposing terms: the ligand–water dispersion interaction which favors the ligand insertion and the solute cavity creation term which opposes ligand solvation. The positive sign and the magnitude ofΔG(vdw)gas→water for the two uncharged ligands (NFV: 5.02 kcal/mol; APV: 3.57 kcal/mol) are consistent with the nature of hydrophobic solvation, in which the cavity creation term dominates the solute–solvent dispersion interaction.59,60
The free energy of coupling the restrained gas-phase ligand to the binding pocket, ΔG(coupl)gas*→complex, also consists of electrostatics and nonpolar components. The electrostatics component ΔG(elec)gas*→complex (NFV: −25.29 kcal/mol; APV: −32.58 kcal/mol) strongly favors the ligand insertion into the binding pockets. This strong attraction reflects the Coulombic interactions involving the ligand, the protein residues, and the bridging waters. The presence of these interactions is confirmed by the direct and water-mediated hydrogen bonds between the ligand and the protein residues identified in the crystal structure of the complex (Figure 3). The van der Waals coupling free energy ΔG(vdw)gas*→complex reflects the interplay of several compensating enthalpic and entropic contributions: (1) the direct van der Waals interaction between the ligand and the binding pocket is mainly attractive and enthalpic in nature; (2) the release of the water molecules upon binding can have both enthalpic and entropic components, and can be favorable, unfavorable or neutral to ligand binding; (3) the loss of the ligand rotational entropy, and the loss of the vibrational entropy for both ligand and protein residues, upon coupling the ligand to the binding pocket. The net result is the negative ΔG(vdw)gas*→complex for both ligands (NFV: −10.84 kcal/mol; and APV: −11.27 kcal/mol), suggesting that the unfavorable contribution from the rotational and vibrational entropy loss is overcome by other free energy contributions that favor binding.
Figure 3.

Structural basis for the electrostatic interactions involving Nelfinavir (blue line), HIV-1 PR, and the bridging water molecules (red sphere). Hydrogen bonds are highlighted by green dashed lines.
The calculation shows that the large ligand-protein coupling free energy ΔG(coupl)gas*→complex (NFV: −36.12 kcal/mol; APV: −43.88 kcal/mol) is partially offset by the ligand solvation free energy ΔG(coupl)gas→water (NFV: −20.11 kcal/mol; APV: −23.44 kcal/mol) and by the free energy associated with restraining the ligand to near the binding pocket ΔGgas→gas*(5.53 kcal/mol). Among the components of ΔG(coupl)gas*→complex, the electrostatics term ΔG(elec)gas*→complex is larger in magnitude than the van der Waals term ΔG(vdw)gas*→complex, but the strong electrostatics attraction is largely compensated by the electrostatics contribution to ligand solvation ΔG(elec)gas*→complex, resulting in a small overall electrostatics contribution to binding ΔΔG(elec) (NFV: −0.16 kcal/mol; APV: −5.57 kcal/mol). The result also reveals the difference in the binding mechanism for the two inhibitors: while the binding of NFV is driven entirely by the nonpolar contribution ΔΔG(vdw) of −15.95 kcal/mol (the ΔΔG(elec) is only −0.16 kcal), the binding of APV is favored by both the nonpolar contribution ΔΔG(vdw) (−14.86 kcal/mol) and the electrostatics contribution ΔΔG(elec) (−5.57 kcal/mol). This difference in the binding mechanisms is consistent with the relative hydrophobicity of the two ligands: the log P values of APV and NFV are 2.2 and 6.0, respectively. As shown in Figure 2, the APV molecule contains two more polar groups and smaller nonpolar groups compared with NFV. The difference in the binding mechanisms revealed by the DDM calculations also correlate with the experimental observation that NFV binding is entropically driven, a signature for binding of hydrophobic ligands in general. By contrast, APV binding benefits from both the enthalpy and entropy changes and, therefore, is not solely due to the hydrophobic effect.
Absolute Binding Entropy Calculations
To determine the absolute binding entropy using the temperature derivative method, we calculated the absolute binding free energies of NFV and APV at the following temperatures: 260, 275, 290, 305, and 320 K. As can be seen from Figure 4a, the binding free energy of NFV exhibited an approximately linear temperature dependency. The linear fit leads to the calculated absolute binding entropy contribution −TΔS ≈ −20.1 ± 3 kcal/mol for T = 298 K, which is in fair agreement with the experimental binding entropy of −15.9 kcal/mol at the same temperature.39 Since the ΔG(bind) is on the order of −10 kcal/mol (Table 1), the calculations show that, in agreement with experiments, the binding of NFV is driven by entropy and opposed by enthalpy. The temperature dependency of the binding free energy of APV is very different from that of NFV: see Figure 4b. Except for the lowest temperature of 260 K, the binding free energies of APV do not change significantly with T, which implies that near the room temperature the estimated binding entropy of APV is small. The calculated ΔG(bind) above 260 K can be fitted by an almost horizontal line, which gives a −TΔS of ~0.7 ± 5 kcal/mol. Our calculation therefore predicted that the binding of APV is entirely driven by enthalpy. Experimentally, however, the APV binding is found to be favored by both enthalpy (ΔH: −6.9 ± 0.2 kcal/mol) and entropy (−TΔS: −6.3 kcal/mol).39 Thus, our calculation underestimated the favorable entropy contribution to the binding of APV by ~7 kcal/mol. Taken these results together, we can see that the calculation of absolute binding entropy is still challenging: while the experimental ranking order of the binding entropies (Experiment: NFV: −15.9 kcal/mol; APV: −6.3 kcal/mol) is correctly reproduced in our entropy calculation, the difference between the calculated −TΔS (Calculated: NFV: −20.1 kcal/mol; APV: 0.7 kcal/mol) and the experimental values can be as large as 7 kcal/mol. The uncertainties in the calculated binding entropies are also larger than those in the calculated binding free energies: see Tables 1–3.
Table 3.
Decomposition of the Absolute Binding Entropy of HIV-1 PR Inhibitors Nelfinavir and Amprenavira
| TΔSgas→water | −TΔSgas*→complex | −TΔS(restraint) | −TΔS(bind)calc | −TΔSexpt | |
|---|---|---|---|---|---|
| Nelfinavir | −45.6 | 20.9 | 4.6 | −20.1 ± 3 | −15.9 |
| Amprenavir | −35.0 | 31.1 | 4.6 | 0.7 ± 5 | −6.3 |
−TΔS(bind)calc = TΔSgas→water − TΔSgas*→complex − TΔS(restraint). Unit: kcal/mol. Standard concentration: 1 M. Error bars are based on the first half and second half of the trajectories.
Decomposition of the Absolute Binding Entropy
To gain a qualitative understanding of the entropic effect in the protein–ligand binding, we decompose the binding entropy into different contributions based on the thermodynamic pathway used in DDM. The total binding entropy is expressed as the sum of the entropies associated with different transformations leading to the complex formation, i.e.
| (11) |
Here ΔS(coupl)gas→water is the entropy of ligand solvation, ΔS(coupl)gas*→complex represents the entropy of coupling a restrained ligand to the binding pocket, and ΔSgas→gas*accounts for the entropy of restraining the ligand center of mass. Among these entropy components, ΔSgas→gas* is evaluated analytically (eq 10); ΔS(coupl)gas*→complex and ΔS(coupl)gas→water are obtained from the slope of the temperature dependency of ΔG(coupl)gas*→complex and ΔG(coupl)gas→water, respectively. Table 3 shows the computed entropy contributions for the two HIV-1 PR inhibitors. The temperature dependency plots used to obtain ΔS(coupl)gas*→complex and ΔS(coupl)gas→water are shown in Figures 5 and 6. The different entropic contributions of Table 3 are discussed in more detail below.
For both ligands, the binding is favored by the large ligand desolvation entropy TΔS(coupl)gas→water (NFV: −45.6 kcal/mol; APV: −35.0 kcal/mol). This term contains two contributions, both of which are favorable to the ligand desolvation from the solvent. The first is from the cavity creation related to the hydrophobic effect. The second component in ΔS(coupl)gas→water arises from the ordering of the neighboring solvent molecules due to the attractive solute–solvent electrostatics and dispersion interactions. It is noted that the ligand desolvation entropy contribution of NFV is more negative than that of APV by −10.6 kcal/mol (Table 3). This is probably due to the fact that NFV contains relatively larger nonpolar groups, which leads to stronger hydrophobic effect and more favorable entropy contribution for ligand desolvation.
The contribution −TΔSgas→gas* accounts for the entropy cost of tying a ligand to a fixed point in space via center of mass restraint. This term is dependent on the strength of the force constant of the restraint and in general cannot be equated with the translation entropy loss upon binding.7 However, since the force constant was chosen according to the equilibrium configuration volume occupied by the ligand center of mass within the binding pocket (see the Methods section), the computed −TΔSgas→gas* provides a measure of the ligand translational entropy loss; the result of 4.6 kcal/mol is of the same magnitude as the translational entropy loss estimated in previous studies.61,62
The binding is strongly disfavored by the ligand-protein coupling entropy −TΔS(coupl)gas*→complex for both ligands (NFV: 20.9 kcal/mol; APV: 31.1 kcal/mol). This term reflects different entropy effects associated with the ligand-protein coupling: (a) the release of bound waters from the binding site to bulk solvent, causing an increase in entropy; (b) the reduction in the protein and ligand vibrational entropy, as well as the ligand rotational entropy. The magnitudes of the individual entropy components have been estimated by previous studies. For example, for the binding of APV with HIV-1 PR, Chang et al. estimated the reduction of ligand configurational entropy to be as high as 25 kcal/mol,41 which is comparable to the −TΔS(coupl)gas*→complex calculated in the present study. Comparing the binding pockets at the two end states of the ligand-protein decoupling simulation, we found that between 10 and 15 bound water molecules were displaced due to the binding of APV, suggesting that the associated entropy increase could be substantial. However, as seen from Table 3, the calculated −TΔS(coupl)gas*→complex are strongly positive. Assuming that the entropy is additive, the positive −TΔS(coupl)gas*→complex suggests that the entropy gain from the water release due to ligand binding is more than offset by the reduction in the vibrational and rotational entropies of the ligand and protein.
Figure 5.

Temperature dependence of the free energies of coupling NFV with (a) the solvent and (b) the binding pocket of HIV-1 PR.
Using the entropy decomposition scheme given by eq 11, we may also gain insights into the possible causes of the error in the computed binding entropy. Consider the temperature dependency of coupling free energies ΔG(coupl)gas*→complex and ΔG(coupl)gas→water shown in Figures 5 and 6. While the ligand solvation free energy ΔG(coupl)gas→water vary almost perfectly linearly with temperature (Figures 5a and 6a), the data points of ligand-protein coupling free energy ΔG(coupl)gas*→complex are somewhat curved (Figures 5b and 6b). The deviation from linearity in the calculated ΔG(coupl)gas*→complex affects the quality of the linear fitting. In Figures 5b and 6b, it is noted that the curvature would be smaller if the data point at 260 K is excluded. Since sampling problem tends to be most pronounced at the lowest temperature, we suspect that the curvature reflects the difficulty of sampling the ligand decoupling from the binding site, rather than the curvature arising from the binding heat capacity change with temperature, a higher order effect than entropy and even more difficult to determine from simulation. To compute ΔG(coupl)gas*→complex, the fluctuations need to be sampled adequately include the protein and ligand reorganization, and the water reentry into the binding pocket (Figure S9). By contrast, the sampling problem in calculating the ligand-solvent coupling free energy ΔG(coupl)gas→water is relatively simpler, as the movement of water molecules are not hindered when the ligand is decoupled from the solvent. These observations are consistent with the fact that the curves of 〈∂U/∂λ〉λ for the ligand–protein decoupling contain some kinks and are not as smooth as the ligand-water decoupling curves (see Figure S1–S8, SI). These together with the nonlinearity in the entropy fitting reflect sampling/convergence problems in the ligand–protein decoupling simulations. They suggest that the key to accurate TΔS estimation is to improve sampling for the ligand–protein decoupling process at the relevant temperatures.
CONCLUSIONS
An important question in computational biophysical chemistry is whether the classical molecular mechanics simulation with the current generation force fields provides a complete description for the entropy and enthalpy of protein–ligand binding. To help address this question and to obtain insights into the entropically driven binding reaction, we computed the absolute binding free energies and entropies ofHIV-1 PR inhibitors Nelfinavir and Amprenavir using free energy simulations.
The present results demonstrated that absolute binding free energies of realistic drug-enzyme complexes can be determined with reasonable accuracy using the double decoupling method with relatively long simulations. Due to the limited sampling, the convergence errors in the calculated ΔG(bind) is estimated to be ≥2 kcal/mol. Using the temperature derivative approach, we have shown that the calculation correctly estimated the ranking order of the absolute binding entropies for the two ligands, and gave a semiquantitative estimate for the absolute values of TΔS(bind). However, the errors in the computed absolute binding entropies are substantially larger than that in the calculated absolute ΔG(bind). Analysis of the entropy results suggests that the error in the binding entropy calculation may be reduced by a significant improvement in sampling the ligand–protein decoupling process.
To understand the detailed molecular mechanism of binding, we have analyzed the different components of the absolute binding free energy and binding entropy. The decomposition of ΔG(bind) and ΔS(bind) was based on the thermodynamic pathway used in the double decoupling method. The results indicated that while the binding of Nelfinavir is driven by the nonpolar interaction, the binding of Amprenavir is favored by both the nonpolar and the electrostatic forces. The decomposition of the binding entropy yielded the ligand desolvation entropy and the entropy associated with the ligand-protein coupling. Our analysis suggests that the favorable entropy contribution to the binding of the HIV-1 PR inhibitors is provided by the ligand desolvation entropy. For both inhibitors, the entropy of the ligand–protein coupling was found to strongly disfavor binding, suggesting that the entropy gain originating from the solvent release upon ligand binding is more than offset by the reduction of rotational and vibrational entropy.
ACKNOWLEDGMENT
We thank Mr. Daqi Yu for help with the computational work and Dr. Emilio Gallicchio for helpful discussion. This work was supported in part by the Ministry of Science and Technology of China (to L.L.) and the 111 Project (No. B08001, to support N.J.D.’s visit at Peking University).
Footnotes
Supporting Information. Tables and figures that illustrate the ligand-protein decoupling and ligand desolvation simulations. The topology/parameter files and starting coordinates for the simulations are also deposited. This material is available free of charge via the Internet at http://pubs.acs.org.
REFERENCES
- 1.Jorgensen WL. Science. 2004;303:1813–1818. doi: 10.1126/science.1096361. [DOI] [PubMed] [Google Scholar]
- 2.Gilson MK, Zhou H-X. Annu. Rev. Biophys. Biomol. Struct. 2007;36:21–42. doi: 10.1146/annurev.biophys.36.040306.132550. [DOI] [PubMed] [Google Scholar]
- 3.Jorgensen WL, Buckner JK, Boudon S, Tirado-Rives J. J. Chem. Phys. 1988;89:3742. [Google Scholar]
- 4.Roux B, Nina M, Pomes R, Smith J. Biophys. J. 1996;71:670–681. doi: 10.1016/S0006-3495(96)79267-6. [DOI] [PMC free article] [PubMed] [Google Scholar]
- 5.Helms V, Wade RC. J. Am. Chem. Soc. 1998;120:2710–2713. [Google Scholar]
- 6.Gilson M, Given J, Bush B, Mccammon J. Biophys. J. 1997;72:1047–1069. doi: 10.1016/S0006-3495(97)78756-3. [DOI] [PMC free article] [PubMed] [Google Scholar]
- 7.Boresch S, Tettinger F, Leitgeb M, Karplus M. J. Phys. Chem. B. 2003;107:9535–9551. [Google Scholar]
- 8.Hamelberg D, McCammon JA. J. Am. Chem. Soc. 2004;126:7683–7689. doi: 10.1021/ja0377908. [DOI] [PubMed] [Google Scholar]
- 9.Fujitani H, Tanida Y, Ito M, Jayachandran G, Snow CD, Shirts MR, Sorin EJ, Pande VS. J. Chem. Phys. 2005;123:084108. doi: 10.1063/1.1999637. [DOI] [PubMed] [Google Scholar]
- 10.Wang J, Deng Y, Roux B. Biophys. J. 2006;91:2798–2814. doi: 10.1529/biophysj.106.084301. [DOI] [PMC free article] [PubMed] [Google Scholar]
- 11.Deng Y, Roux B. J. Chem. Theory Comput. 2006;2:1255–1273. doi: 10.1021/ct060037v. [DOI] [PubMed] [Google Scholar]
- 12.Mobley DL, Graves AP, Chodera JD, McReynolds AC, Shoichet BK, Dill KA. J. Mol. Biol. 2007;371:1118–1134. doi: 10.1016/j.jmb.2007.06.002. [DOI] [PMC free article] [PubMed] [Google Scholar]
- 13.Mobley DL, Chodera JD, Dill KA. J. Chem. Phys. 2006;125:084902. doi: 10.1063/1.2221683. [DOI] [PMC free article] [PubMed] [Google Scholar]
- 14.Jiao D, Golubkov PA, Darden TA, Ren P. Proc. Natl. Acad. Sci. 2008;105:6290–6295. doi: 10.1073/pnas.0711686105. [DOI] [PMC free article] [PubMed] [Google Scholar]
- 15.Yu H, Rick SW. J. Am. Chem. Soc. 2009;131:6608–6613. doi: 10.1021/ja809696s. [DOI] [PubMed] [Google Scholar]
- 16.Levy RM, Gallicchio E. Annu. Rev. Phys. Chem. 1998;49:531–567. doi: 10.1146/annurev.physchem.49.1.531. [DOI] [PubMed] [Google Scholar]
- 17.Wan S, Stote RH, Karplus M. J. Chem. Phys. 2004;121:9539. doi: 10.1063/1.1789935. [DOI] [PubMed] [Google Scholar]
- 18.Chang C-E, Gilson MK. J. Am. Chem. Soc. 2004;126:13156–13164. doi: 10.1021/ja047115d. [DOI] [PubMed] [Google Scholar]
- 19.Chen J, Brooks CL, Scheraga HA. J. Phys. Chem. B. 2008;112:242–249. doi: 10.1021/jp074355h. [DOI] [PMC free article] [PubMed] [Google Scholar]
- 20.Gallicchio E, Kubo MM, Levy RM. J. Am. Chem. Soc. 1998;120:4526–4527. [Google Scholar]
- 21.Kohl N. Proc. Natl. Acad. Aci. U.S. A. 1988;85:4686–4690. doi: 10.1073/pnas.85.13.4686. [DOI] [PMC free article] [PubMed] [Google Scholar]
- 22.Turner BG, Summers MF. J. Mol. Biol. 1999;285:1–32. doi: 10.1006/jmbi.1998.2354. [DOI] [PubMed] [Google Scholar]
- 23.Wlodawer A, Vondrasek J. Annu. Rev. Biophys. Biomol. Struct. 1998;27:249–284. doi: 10.1146/annurev.biophys.27.1.249. [DOI] [PubMed] [Google Scholar]
- 24.Wlodawer A. Annu. Rev. Med. 2002;53:595–614. doi: 10.1146/annurev.med.53.052901.131947. [DOI] [PubMed] [Google Scholar]
- 25.Wang W. Proc. Natl. Acad. Sci. 2001;98:14937–14942. doi: 10.1073/pnas.251265598. [DOI] [PMC free article] [PubMed] [Google Scholar]
- 26.Zoete V, Michielin O, Karplus M. J. Comput. Aided Mol. Des. 2003;17:861–880. doi: 10.1023/b:jcam.0000021882.99270.4c. [DOI] [PubMed] [Google Scholar]
- 27.Lepšík M, Kříž Z, Havlas Z. Proteins. 2004;57:279–293. doi: 10.1002/prot.20192. [DOI] [PubMed] [Google Scholar]
- 28.Thorsteinsdottir HB, Schwede T, Zoete V, Meuwly M. Proteins. 2006;65:407–423. doi: 10.1002/prot.21096. [DOI] [PubMed] [Google Scholar]
- 29.Wittayanarakul K, Hannongbua S, Feig M. J. Comput. Chem. 2008;29:673–685. doi: 10.1002/jcc.20821. [DOI] [PubMed] [Google Scholar]
- 30.Kožíšek M, Bray J, Řezáčová P, Šašková K, Brynda J, Pokorná J, Mammano F, Rulíšek L, Konvalinka J. J. Mol. Biol. 2007;374:1005–1016. doi: 10.1016/j.jmb.2007.09.083. [DOI] [PubMed] [Google Scholar]
- 31.Ode H, Matsuyama S, Hata M, Neya S, Kakizawa J, Sugiura W, Hoshino T. J. Mol. Biol. 2007;370:598–607. doi: 10.1016/j.jmb.2007.04.081. [DOI] [PubMed] [Google Scholar]
- 32.Åqvist J, Medina C, Samuelsson J-E. Protein Eng., Des. Sel. 1994;7:385–391. doi: 10.1093/protein/7.3.385. [DOI] [PubMed] [Google Scholar]
- 33.Srinivasan J, Cheatham TE, Cieplak P, Kollman PA, Case DA. J. Am. Chem. Soc. 1998;120:9401–9409. [Google Scholar]
- 34.Stoica I, Sadiq SK, Coveney PV. J. Am. Chem. Soc. 2008;130:2639–2648. doi: 10.1021/ja0779250. [DOI] [PubMed] [Google Scholar]
- 35.Deng N-J, Cieplak P. Phys. Chem. Chem. Phys. 2009;11:4968. doi: 10.1039/b820961h. [DOI] [PMC free article] [PubMed] [Google Scholar]
- 36.Simonson T. Computational biochemistry and biophysics. Marcel Dekker: New York; 2000. [Google Scholar]
- 37.Deng Y, Roux B. J. Phys. Chem. B. 2009;113:2234–2246. doi: 10.1021/jp807701h. [DOI] [PMC free article] [PubMed] [Google Scholar]
- 38.Velazquez-Campoy A, Todd MJ, Freire E. Biochemistry. 2000;39:2201–2207. doi: 10.1021/bi992399d. [DOI] [PubMed] [Google Scholar]
- 39.Ohtaka H, Schön A, Freire E. Biochemistry. 2003;42:13659–13666. doi: 10.1021/bi0350405. [DOI] [PubMed] [Google Scholar]
- 40.Shuman CF, Hämäläinen MD, Danielson UH. J. Mol. Recognit. 2004;17:106–119. doi: 10.1002/jmr.655. [DOI] [PubMed] [Google Scholar]
- 41.Chang C, Chen W, Gilson MK. Proc. Natl. Acad. Sci. 2007;104:1534–1539. doi: 10.1073/pnas.0610494104. [DOI] [PMC free article] [PubMed] [Google Scholar]
- 42.Carlsson J, Aqvist J. Phys. Chem. Chem. Phys. 2006;8:5385. doi: 10.1039/b608486a. [DOI] [PubMed] [Google Scholar]
- 43.Beutler T. Chem. Phys. Lett. 1994;222:529–539. [Google Scholar]
- 44.Jorgensen WL, Chandrasekhar J, Madura JD, Impey RW, Klein ML. J. Chem. Phys. 1983;79:926. [Google Scholar]
- 45.Case DA. AMBER 10. San Francisco, CA: University of California; 2008. [Google Scholar]
- 46.Hornak V, Abel R, Okur A, Strockbine B, Roitberg A, Simmerling C. Proteins. 2006;65:712–725. doi: 10.1002/prot.21123. [DOI] [PMC free article] [PubMed] [Google Scholar]
- 47.Wang J, Wolf RM, Caldwell JW, Kollman PA, Case DA. J. Comput. Chem. 2004;25:1157–1174. doi: 10.1002/jcc.20035. [DOI] [PubMed] [Google Scholar]
- 48.Jakalian A, Bush BL, Jack DB, Bayly CI. J. Comput. Chem. 2000;21:132–146. [Google Scholar]
- 49.Hess B, Kutzner C, van der Spoel D, Lindahl E. J. Chem. Theory Comput. 2008;4:435–447. doi: 10.1021/ct700301q. [DOI] [PubMed] [Google Scholar]
- 50.Amb2gmx.pl. http://chemistry.csulb.edu/ffamber. [Google Scholar]
- 51.Essmann U, Perera L, Berkowitz ML, Darden T, Lee H, Pedersen LG. J. Chem. Phys. 1995;103:8577. [Google Scholar]
- 52.Ryckaert J, Ciccotti G, Berendsen H. J. Comput. Phys. 1977;23:327–341. [Google Scholar]
- 53.Mobley DL, Chodera JD, Dill KA. J. Chem. Theory Comput. 2007;3:1231–1235. doi: 10.1021/ct700032n. [DOI] [PMC free article] [PubMed] [Google Scholar]
- 54.Deng N, Zheng W, Gallicchio E, Levy RM. J. Am. Chem. Soc. 2011;133:9387–9394. doi: 10.1021/ja2008032. [DOI] [PMC free article] [PubMed] [Google Scholar]
- 55.Sadiq SK, De Fabritiis G. Proteins. 2010;78:2873–2885. doi: 10.1002/prot.22806. [DOI] [PubMed] [Google Scholar]
- 56.Robbins AH, Coman RM, Bracho-Sanchez E, Fernandez MA, Gilliland CT, Li M, Agbandje-McKenna M, Wlodawer A, Dunn BM, McKenna R. Acta Crystallogr. D Biol. Crystallogr. 2010;66:233–242. doi: 10.1107/S0907444909054298. [DOI] [PMC free article] [PubMed] [Google Scholar]
- 57.Maschera B, Darby G, Palú G, Wright LL, Tisdale M, Myers R, Blair ED, Furfine ES. J. Biol. Chem. 1996;271:33231–33235. doi: 10.1074/jbc.271.52.33231. [DOI] [PubMed] [Google Scholar]
- 58.Kaldor SW, Kalish VJ, Davies JF, Shetty BV, Fritz JE, Appelt K, Burgess JA, Campanale KM, Chirgadze NY, Clawson DK, Dressman BA, Hatch SD, Khalil DA, Kosa MB, Lubbehusen PP, Muesing MA, Patick AK, Reich SH, Su KS, Tatlock JH. J. Med. Chem. 1997;40:3979–3985. doi: 10.1021/jm9704098. [DOI] [PubMed] [Google Scholar]
- 59.Gallicchio E, Kubo MM, Levy RM. J. Phys. Chem. B. 2000;104:6271–6285. [Google Scholar]
- 60.Chandler D. Nature. 2005;437:640–647. doi: 10.1038/nature04162. [DOI] [PubMed] [Google Scholar]
- 61.Lazaridis T, Masunov A, Gandolfo F. Proteins. 2002;47:194–208. doi: 10.1002/prot.10086. [DOI] [PubMed] [Google Scholar]
- 62.Swanson JMJ, Henchman RH, McCammon JA. Biophys. J. 2004;86:67–74. doi: 10.1016/S0006-3495(04)74084-9. [DOI] [PMC free article] [PubMed] [Google Scholar]