Abstract
During the past decade the interactions of fluorophores with metallic particles and surfaces has become an active area of research. These near-field interactions of fluorophores with surface plasmons have resulted in increased brightness and directional emission. However, using metals provide some disadvantages, like quenching at short fluorophore-metal distances, increased rates of energy dissipation due to lossy metals. These unfavorable effects are not expected in dielectrics. In this paper we describe the interactions of fluorophores with one-dimensional (1D) photonic crystals (PCs), which have alternating layers of dielectrics with dimensions that create a photonic bandgap (PBG). Freely propagating light at the PBG wavelength will be reflected. However, similar with metals, we show that fluorophores within near-field distances of the 1DPC interacts with the structure. Our results demonstrated that these fluorophores can interact with both Internal Modes (IM) and Bloch Surface Waves (BSW) of the 1DPC. For fluorophores on the surface of the 1DPC the emission dominantly occurs through the 1DPC and into the substrate. We refer to these two phenomena together as Bragg Grating-Coupled Emission (BGCE). Here we describe our preliminary results on BGCE. 1DPCs are simple to fabricate and can be handled and reused without damage. We believe BGCE provide opportunities for new formats for fluorescence detection and sensing.
Keywords: Radiative Decay Engineering, One-Dimensional Photonic Crystals, Bragg Grating-Coupled Emission, Surface Plasmon-Coupled Emission, Near-Field Interactions, Photonic Bandgap
INTRODUCTION
During the past decade there has been a growing interest in plasmonics and in the near-field interactions of fluorophores with metallic structures. Metallic surfaces and particles display surface plasmons, which can result in enhanced and selective excitation of nearby fluorophores. Additionally, these nearby excited state fluorophores can interact with the photonic mode density (PMD) created by the plasmons, which increases the emission rates and decreases the lifetimes. The PMD is also referred to as the Density of States (DoS). The spatial distribution of light from the fluorophore can be changed from the usual omnidirectional distribution to a more narrow spatial distribution, which is determined by wavevector matching at the metallic surfaces [1-5].
The use of metals with fluorescence does have some disadvantages. For metal-enhanced fluorescence (MEF) the metal must display a plasmon resonance at wavelengths where its intrinsic absorption is low. This limits the practical metals to Ag, Au and Al, with a few other metals in occasional use for MEF [6-10]. There is an optimal distance for metal enhancement near 10 nm from the metal surface because fluorophores at closer distances are often quenched. Metals are lossy and quickly dissipate the optical energy. As a result, MEF often occurs with an increased excitation-relaxation cycling rate. In spite of these disadvantages, MEF and its related phenomena have found widespread use in fluorescence sensing [11-15], for novel probes [16-18], single molecule detection [19-21] and sub-diffraction limited microscopy [22-25].
To avoid the energy losses found in metals we have now extended our studies to near-field interactions of dielectric photonic crystals with fluorophores. Photonic crystals (PCs) are defined according to their dimensionality [26-27]. One-dimension (1D) PCs are multi-layers of dielectrics with different refractive indices. One well known example is Bragg gratings (BG) or notch filters for optical spectroscopy [26]. Two-dimensional (2D) PCs have periodicity in two dimensions, such as an array of closely spaced cylinders. Three-dimensional (3D) PCs have periodicity in three directions, a typical case being closely packed colloidal spheres. PCs have unusual optical properties because they can display photonic bandgaps (PBG), which are optical frequencies (or wavelengths) that cannot propagate in a given structure. The PBGs give a colored appearance to structures without the presence of chromophores. The intensive scientific interest in PCs and PBGs gives the impression that this topic has a long scientific history, but this topic developed relatively recently. The first reports of PBGs appeared in 1987 [28-29].
Surprisingly, there are relatively few reports on the use of PCs to modify fluorescence and even fewer reported applications. Most of these reports are focused on the physics of dipoles in a PBG [30-33]. There have been some important contributions to sensing using PCs [34-36]. The local radiative optical density of states (LRDoS) increases near the edge of a PBG and then becomes smaller and approaches zero at the PBG [37-38]. As will be described in the Discussion below it is preferable to consider the local radiative density of the state (LRDoS) which takes into account the dipole location and orientation. Since the dipole radiation rate depends on the DoS a frequent goal has been to use the PBG to prevent emission. An excited fluorophore (dipole) in a perfect 3D PBG is expected to remain indefinitely in the excited state because there is no photonic mode density to allow emission. The attempts to increase lifetimes in 3DPCs have been somewhat successful. Lifetimes have been increased about 2-fold [39] with the record being about 10-fold [40]. The use of fluorescence with 3D photonic crystals has not found more widespread applications for several reasons. First, if a fluorophore is in a 3DPC it is difficult to excite and cannot emit because the PBG prevents entry of incident light and exiting of the emission. Some groups have used two-photon excitation or introduced defects to allow excitation [41]. A second difficulty with 3DPCs, and also 2DPCs, is the need for nanoscale structural features, which require complex nanofabrication using either top-down or self-assembly methods [42-43]. Thirdly, most bioassays are performed on surfaces or volumes accessible from the liquid phase. It is difficult to make photonic structures, which are permeable to biomolecules and retain the dimensional stability needed for stable photonic effects [44-45]. And finally, to our knowledge, biomedical applications, which make use of the longer lifetimes, have not been reported.
In this initial report, we describe our observations of the effects on fluorescence of one-dimensional (1D) photonic structures. These structures are robust and easy to fabricate using only vapor deposition methods. A 1DPC consist of multiple layers of dielectrics with alternating low (L) and high (H) dielectric constants. These structures can display a partial photonic bandgap and become completely reflective for particular wavelengths and incidence angles. However, this complete reflection refers to plane wave light incident from the far-field. Our studies of fluorophores near metallic structures showed that fluorophores in the near-field can interact with metals when plane wave illumination at the same frequency is reflected [46-47]. In the present report we show that a similar effect occurs with 1DPCs. We found that fluorophores can also undergo near-field interactions and couple with modes of the 1DPC at the same wavelengths where far-field illumination results in reflection. These interactions were found to modify the directionality and polarization of the coupled emission. We refer to this phenomenon as Bragg grating coupled emission (BGCE). There are several potential advantages when using dielectric structures. Metals are lossy, which means they rapidly dissipate energy. Dielectrics dissipate less energy than metals, which can allow sharp resonances and strong local fields. Fluorophores will not be quenched when close to the surface and hence enhanced emission is possible for the entire evanescent field, not just the region beyond 3 nm from the surface. A wide variety of dielectrics are available to cover a wide range of wavelengths and the optical properties can scale closely with dimensions. And finally, the substrates are not as fragile as metal surfaces and can be cleaned and used multiple times.
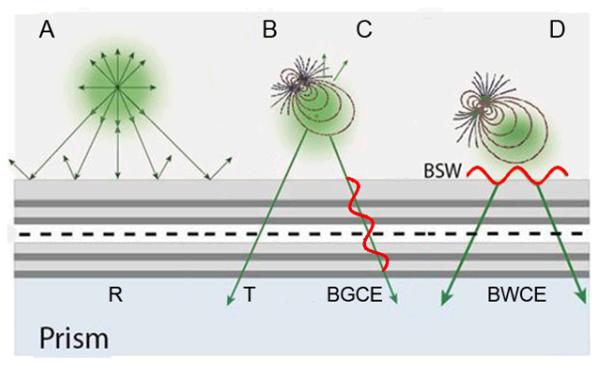
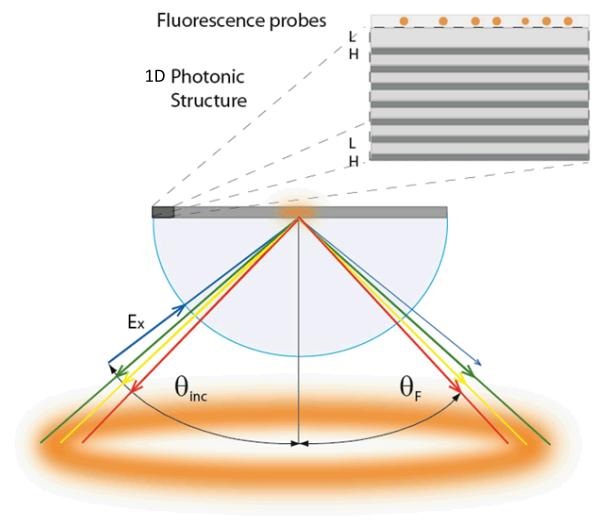
Our concept is shown in Figure 1. We anticipate that excited state fluorophores can interact with 1DPCs in several ways. If the fluorophore is more than about one wavelength away, the energy propagates as free-space radiation. If the wavelength overlaps with the PBG then it is reflected (R). This effect was used in several reports as a way to collect a greater fraction of the emission [48-49]. Alternatively, if the wavelength is much longer or much shorter than the thickness of the layers the light can be transmitted (T). If the wavelength is comparable to the layer thickness the emission can display near-field coupling with optical modes of the 1DPC. One possibility is coupling to internal optical modes (IM) of the 1DPC. At first glance it seems that this energy would be trapped by total internal reflection (TIR). However, as shown in this report, the majority of the radiation appears below the sample as coupled emission. This effect presumably occurs because these modes are leaky [50-51], which depends on imperfections in the structure. We expect a cone of emission and the angles in the substrate to be dependent upon wavelengths so that the 1DPC also provides spectral resolution (Figure 2).
Figure 1.
Schematic of a fluorophore interacting with a 1DPC. Depending upon conditions the emission can be reflected (A), transmitted (B), transmitted by coupling with internal BG modes (C) or transmitted by interaction with BSWs (D). The dash line is free space behavior.
Figure 2.
Expected spatial distribution of the Bragg grating-coupled emission.
There is yet another possible fluorophore-1DPC interaction. It is now known that there are surface states on PCs. These surface states were recognized only recently [52-53] and their use in applications is even more recent [54-60]. In these states the electromagnetic energy is trapped on the surface. The energy cannot propagate into the sample because of the PBG, and cannot radiate away from the surface because of total internal reflection (TIR). These states are called Bloch Surface Waves (BSW). The BSW are analogous to surface plasmons, which are also surface-trapped states. Because of the low losses in dielectrics the BSWs display high quality factors and very sharp angular resonances. This provides an opportunity for nearby fluorophores to interact with their surface modes and display Bloch surface-wave coupled emission (BWCE). The BSW provides opportunities for both selective excitation of surface-bound fluorophores and for a sharp angular distribution in the coupled emission (Figure 1, right). Although not stated explicitly, BSWs may have contributed to increased rates of excitation reported in [61-62]. Because of these unusual effects we believe 1DPCs offer opportunities for new formats for fluorescence detection and sensing.
MATERIALS AND METHODS
The apparatus for measuring angle-dependent fluorescence has been previously described in detail [46-47]. Excitation was with a CW 532 nm Nd-YVO4 laser with polarizers between the laser and sample. The emission was collected with a 1 mm diameter fiber positioned 2 cm from the sample with a polarizer between the sample and fiber input. Emission spectra were measured using a Model SD2000 Ocean Optics spectrometer with 1 nm resolution. A 550 nm long-pass emission filter was also placed between the sample and fiber input to remove scattered light at 532 nm.
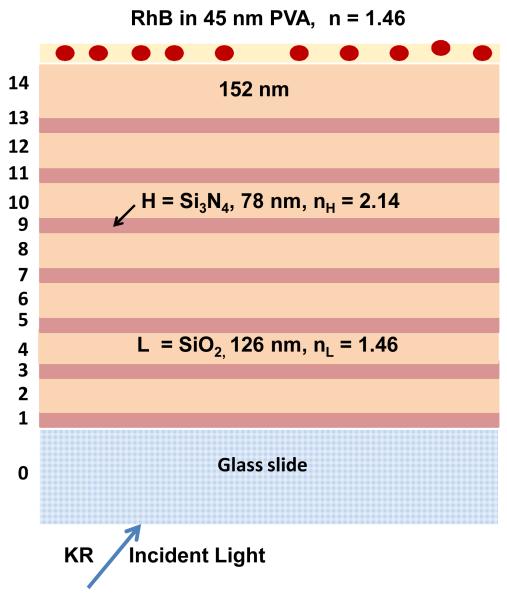
The BG substrate was made by plasma-enhanced chemical vapor deposition (PECVD) of SiO2 and Si3N4 on standard microscope slides. This structure consisted of alternating layers of SiO2, with a low (L) refractive index, and Si3N4 as the (H) refractive index dielectric, in the form H7,L6 and a top SiO2(L) layer, which has a thickness of 152 nm (Figure 3). The targeted thicknesses were chosen because this structure was previously shown to display BSWs [63]. The actual thickness and optical constants were determined using a N and K Model 1200 instrument and are listed in Table 1. The sample was subsequently coated with rhodamine B (RhB)-doped polyvinyl alcohol (PVA) in water, 1% PVA (mw 16,000-23,000), 3000 rpm for 1 minute [64], which yielded a thickness of 45 nm.
Figure 3.
Schematic of the SiO2 - Si3N4 multilayer 1DPC and the measured optical constants. Also shown is the final PVA layer which contains RhB.
Table I.
Measured Optical Constants for the Bragg Grating Structure
| Sample | Thickness (nm) |
n or κ* |
270 nm | 550 nm | 633 nm | 900 nm |
|---|---|---|---|---|---|---|
| SiO2 on Si (κ = 0.0) | 126 | n | 1.496 | 1.460 | 1.457 | 1.452 |
| Si3N4 on Si | 78 | n | 2.473 | 2.196 | 2.144 | 2.051 |
| κ | 0.536 | 0.033 | 0.016 | 0.0007 | ||
| 1% PVA on Ag mirror (κ = 0.0) | 45 | n | 1.496 | 1.459 | 1.457 | 1.452 |
| Final SiO2 layer (κ = 0.0) | 152 | n | 1.496 | 1.460 | 1.457 | 1.452 |
The complex refractive index is defined as
Simulations of transmission and reflectance spectra were performed using several software packages, based on the Transfer Matrix method [26], all of which yielded nearly identical results. These packages are BR Project Institute of Electronic Materials Technology, Warsaw, Poland and TFCalc from Software Spectra, Inc. The calculations were independently confirmed by code written by one of the authors (E.D.).
RESULTS
Optical Properties of the 1DPC
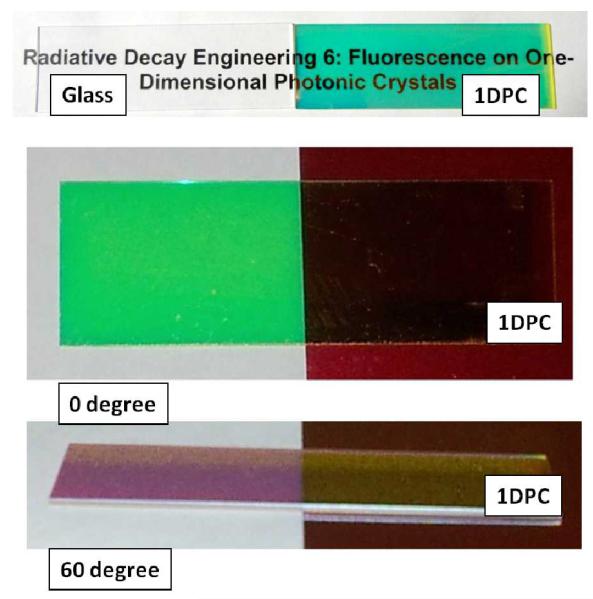
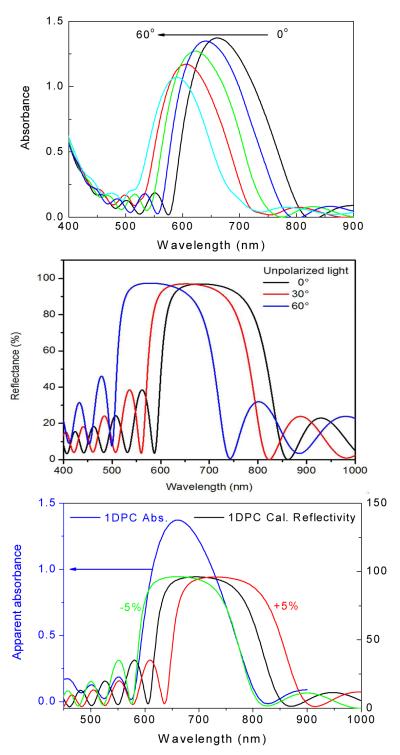
The goal of the present paper is to both describe our experimental results with BGCE and to explain the optical concepts to a wider audience of chemists and biologists. From this perspective it is advantageous to first describe the experimental observations, which are followed by an interpretation of the results using simulations of the optical properties of the 1DPC. Figure 4 shows real color photographs of our 1DPC. The top panel shows the 1DPC on a printed page in white light. The high quality and uniformity can be seen from the visible green color and ability to read the underlying text. The lower panels show the slide on adjacent white and red backgrounds. The darkness on the red background indicates the sample is less transmissive at red wavelengths (middle). The photonic properties of the sample are shown by the photograph taken at 60°, which shows a red color on the white paper (bottom). These angle-dependent properties can be seen in the measured transmission spectra (Figure 5, top). As the angle is increased there is more transmission of red wavelength below 700 nm. The high absorption near 670 nm is due to the PBG and overlaps the emission of RhB. As expected for a BG, the spectra shift to shorter wavelengths as the incidence angle is increased. We used simulated spectra to confirm that the structure displayed the expected spectra. The simulated reflectance spectra (middle) are in good agreement with the measured spectra and display a similar dependence on incident angle. The harmonics on each side of the PBG are due to Fabry-Perot effects due to the finite thickness of the sample [26]. These oscillations are smaller for the measured spectra probably because of a less - perfect cavity. The lower panel shows simulated spectra for 1DPC with the dimensions of all layers changed by ±5%. The measured spectra are most consistent with the dimensions reduced by 5% and are in agreement with the measured thickness values for our 1DPC those are listed in Table 1.
Figure 4.
Real color photograph of our 1DPC in white light on a printed page to demonstrate optical clarity (top). The lower panel shows photographs of the samples on adjacent white or red background at normal (0 degree) and 60 degree observation.
Figure 5.
Absorption spectra (top) and calculated reflectivity (middle) of the 1DPC at various angles of incidence. The lower panel shows the effect of increasing or decreasing the thickness of all layers by 5% on the calculated reflectivity.
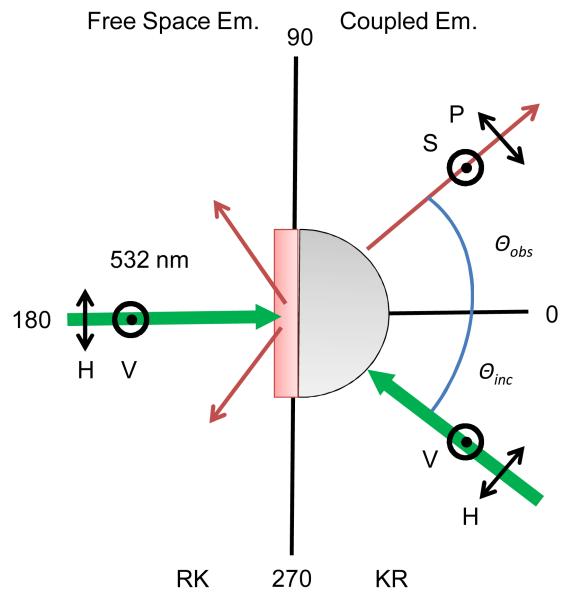
The geometry and polarization conditions of the measurements can be confusing and are thus described in detail (Figure 6). The vertical axis in the laboratory corresponds to the out-of-plane axis in Figure 6. The 1DPC sample is placed on a hemi-cylindrical prism with an index matching fluid (Figure 6). The prism is needed to admit the incident light above the critical angle (θc). We used two modes of excitation. Light incident through the prism is called the Kretschmann (KR) configuration, and above θc allows selective excitation of fluorophores adjacent to the top surface of the 1DPC. The sample will also be excited with illumination from the sample side, which is called the Reverse Kretschmann (RK) configuration [46-47]. In this case fluorophores are excited through the entire thickness of the sample and the incident light is reflected by the 1DPC. The emission can also be observed from either side of the sample. We refer to the emission measured through the sample and prism as KR emission and the free-space emission is called RK emission. The emission through the prism is expected to be polarized due to coupling to various modes in the 1DPC. When describing BG structures the S- and P-polarizations are defined relative to the planar surfaces of the sample. Hence the E-field for S-polarized light is parallel to the surfaces, and P-polarized light has its E-field across the interfaces. Since the out-of-plane axis is the laboratory vertical axis we also refer to S as vertically (V) polarized and P as horizontally (H) polarized. In the RK configuration illumination was normal to the sample plane but we used the same definitions for V and H to indicate the incident polarization relative to the observation polarization.
Figure 6.
Experimental geometry and polarization used with the 1DPC.
Spatial Distribution of Emission
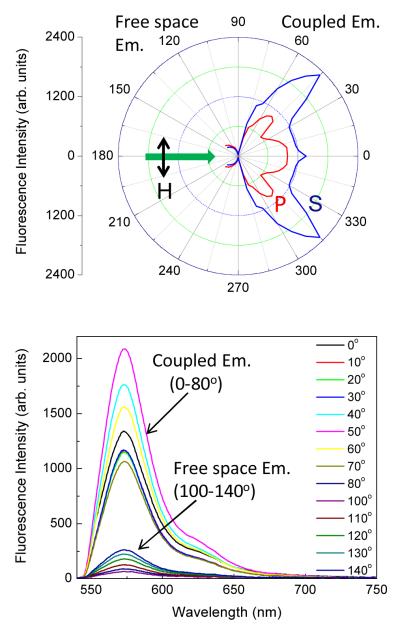
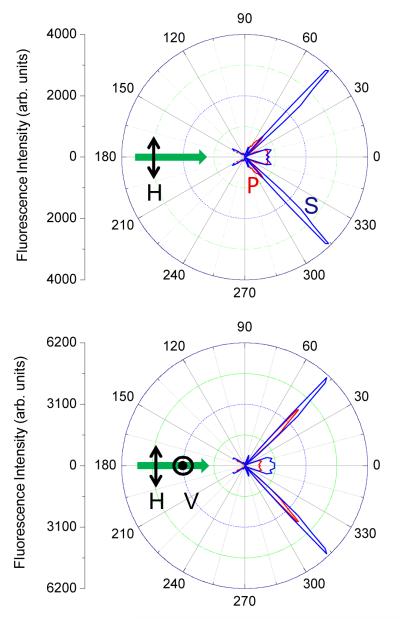
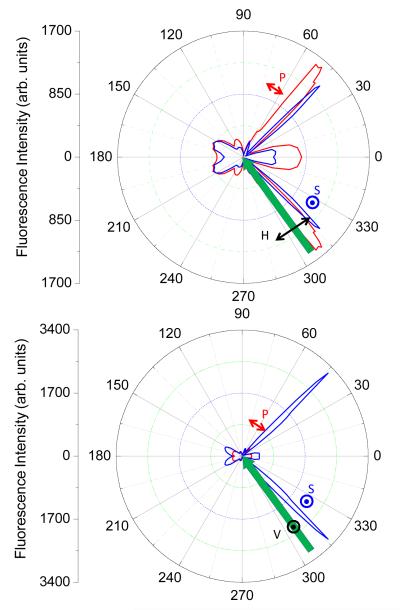
As a control experiment we first measured the RhB emission on a plain glass slide (Figure 7). The emission occurs over a wide range of angles. As expected the majority of the emission occurs into the slide due to its higher refractive index. We found no shifts in the emission spectra for any observation angle. In contrast to the results shown below for the 1DPC, we found that the RhB emission on the glass slide is only partially polarized. Next we examined the RhB emission distribution on the 1DPC with RK excitation (Figure 8). With RK excitation we do not expect selective excitation of the fluorophores closest to the 1DPC so that the excited fluorophores are not initially coupled to any modes in the 1DPC. Even without selective excitation the emission was found to be highly polarized and sharply distributed over a small range of angles. We observed the S-polarized emission at an angle closer to the normal axis than the P-polarized emission (top). This distribution was observed for all the samples independent of RK or KR excitation. The angle and intensity of the S-polarized emission was mostly independent of the excitation polarization (bottom). These results demonstrate that the fluorophores display near-field coupling with the 1DPC even when excitation occur independent of optical modes in the 1DPC.
Figure 7.
RhB in PVA emission on glass. Top, angular distribution. Bottom, H-illumination S-polarized emission spectra from coupled (0 to 80°) and free space (100 to 140°) angles.
Figure 8.
Top, Angular distribution of RhB S- and P-polarized emission with RK excitation. Bottom, S-polarized emission for RhB on 1DPC where the red and blue lines are using H- and V-polarized excitation, respectively. The distribution of S-polarized or P-polarized emissions are similar with V- or H-polarized incident light.
Next we examined the angular emission pattern with KR illumination (Figure 9). The incident angle was adjusted to obtain the highest emission intensities and thus corresponds to a reflectivity minimum or to be in resonances with a mode in the 1DPC. We observed the emission intensities to depend strongly on the incident polarization. With H-illumination we found higher intensities in the P-polarized emission (top). With V-illumination the S-polarized emission was dominant (bottom). These intensities are consistent with alignment of the polarizers. H-illumination is in the same plane with P-emission, and V-illumination is in-plane with the S-emission. It is interesting to note that the smaller angle emission band is S-polarized. This is opposite to that found with metallic surfaces and surface plasmon-coupled emission (SPCE) where the smallest angle emission is P-polarized [46-47]. As will be described below this difference is due to the different polarizations of the modes for plasmons or BSWs.
Figure 9.
Angular distribution of RhB S- and P-polarized emission with KR excitation. Top, H-polarized excitation. Bottom V-polarized excitation.
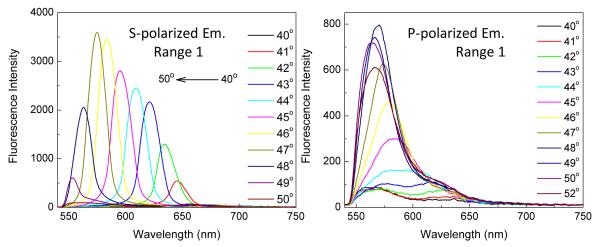
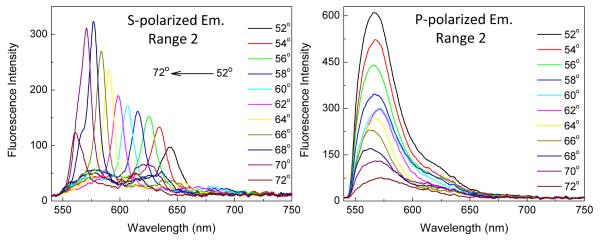
In the case of SPCE we found that different wavelengths appeared at slightly different angles because of dispersion in the optical properties of the metals [46-47]. We reasoned a similar effect may occur with the 1DPC. Figures 10 and 11 shows the emission spectra for KR emission in angle Range 1 (40-52°) and angle Range 2 (52-72°), respectively. In both angle ranges we found the S-polarized emission wavelength to depend strongly to the observation angle and the P-polarized emission to be relatively insensitive to the observation angle (Figures 10 and 11). Additionally, the widths of the recorded spectra were narrower for Range 2 than for Range 1. As will be described below we believe the different widths are due to coupling to a BSW (Range 1) or an internal mode of the PC with higher dispersion (Range 2).
Figure 10.
Effect of observation angle in Range 1 (40-52 degree) on the RhB emission spectra with V-polarized RK excitation for S-polarized (left) and P-polarized emission (right).
Figure 11.
Effect of observation angle in Range 2 (52-72 degree) on the RhB emission spectra with V-polarized RK excitation for S-polarized (left) and P-polarized emission (right).
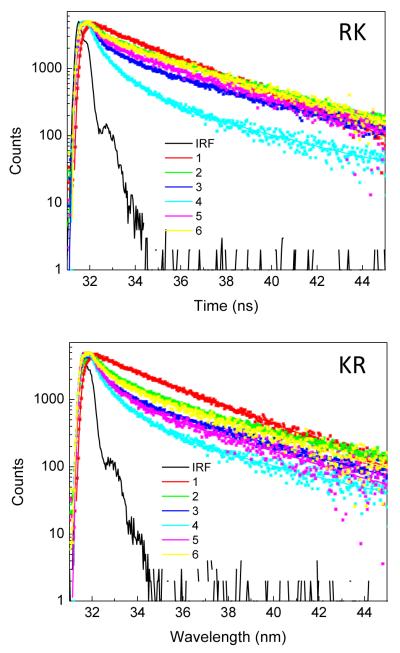
It is known that the interaction of fluorophores with surface plasmons on metals result in decreased lifetimes [65-66]. In contrast, it is known that fluorophores in a complete PBG cannot radiate or decay and longer lifetimes are expected and have been observed [37,40]. Complete PBGs can exist in 2D and 3D photonic crystals, but not in a 1DPC [26]. To the best of our knowledge intensity decays have not been reported for fluorophores on a 1D photonic structure. Figure 12 shows the RhB intensity decays measured on glass and on the 1DPC with different polarizer orientations. At this time we cannot completely interpret the individual decays but several trends are informative. First, all the intensity decays on the 1DPC are more rapid (shorter lifetimes) than on glass. This result indicates that the structure is not slowing the decay rate due to an altered DoS. The more rapid decays on the 1DPC suggests that coupling of the fluorophores with the 1DPC provide a pathway for more rapid decay, which we presume is due to an increased DoS near the PBG [26]. Since we do not expect fluorophores to be quenched by the dielectric 1DPC it seems likely that the more rapid decay is due to an increase in the radiative decay rate (Γ) and not due to an increased rate of non-radiative decay (knr). Secondly, the decay rates on the 1DPC are only weakly dependent on the polarization of the incident light. And finally, the intensity decays appears to be somewhat faster for the P-polarized emission than the S-polarized emission. We were surprised by this result because we knew the S-polarized modes have much higher quality factors than the P-polarized modes [67].
Figure 12.
RhB intensity decays with RK (top) and KR (bottom) illumination. RhB on glass (1), RhB on IDPC for P- (2) and S-polarized (3) emission at 44 degree observation angle (Range 1). Traces (4) and (5) are corresponding P- and S- polarized emissions at 64 degree angle (Range 2). Trace 6 is for RhB free space emission at 120 degree angle. Also shown in the figures is instrument response function (IRF).
Optical Modes in the 1DPC and RhB Emission
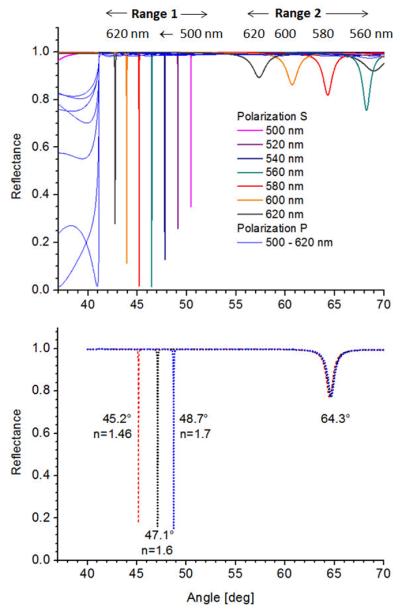
We reasoned the angular distribution and wavelength dispersion of the BGCE is linked to the angle-dependent optical properties of the 1DPC. We investigated the optical modes of the PC by simulations of the reflectivity spectra. In the physics literature these calculations are often presented as dispersion plots, which contain both frequency (energy) and angle-dependent values. These plots will be shown below. However, it can be difficult to use these plots to visualize the connections between the calculations and the experimental data. Hence we first describe a subset of these plots, in particular the effect of reflectivity on incident angle and how this depends on wavelength. For these calculations we could not use the exact measured optical constants because the BSWs are extremely narrow if there are no optical losses. It is very likely that our 1DPC displays some optical losses due to imperfections in the multiple layers [67]. These losses would not be seen in our measurements of the optical constants of single dielectric layers. We added small imaginary components (which are described below) that added finite widths to the BSWs. We found two angle ranges where the reflectivity decreases (Figure 13 top panel). Range 1 shows very sharp resonances and Range 2 shows wider resonances. In both cases the calculated resonances appears only for S-polarized light. The reflectivity of the P-polarized light is high and mostly independent of incident angle above the critical angle. For both angle ranges the S-polarized reflectivity is dependent on incident wavelength in a manner comparable to the wavelength shifts in the emission spectra (Figures 10 and 11). The sharp resonances in Range 1 are highly dependent on the imaginary part of the refractive index (κ). It was necessary to include finite, non-zero values of κ. Otherwise, the sharp resonances could be missed with the finite angular resolution of the calculations. In Range 2 the resonances are independent of small κ values. From the shapes and distribution of the resonances we reasoned that the Range 1 band was due to BSWs and Range 2 due to internal modes of the 1DPC.
Figure 13.
Top, Calculated angle-dependent reflectivity for the 1DPC shown in Figure 2. For all simulations we used nL = 1.46, kL = 1×10⁻⁵, nH = 2.14, kH = 3×10⁻⁴, nPVA = 1.46, kPVA = 1×10⁻⁵. Bottom, calculated reflectivity with different assumed values of the refractive indices of the top layer 45 nm thick.
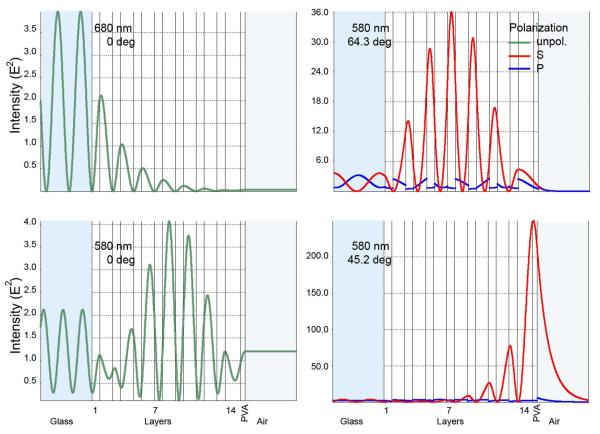
To identify the resonances we simulated the electric field intensities (∣E2∣) for our 1DPC for several wavelengths and incident angles (Figure 14). For normal incidence at 680 nm, which is at the center of the PBG, the E2-field is localized at the surface and decays exponentially in the IDPC (top left). This effect occurs because the light is reflected that is the 680 nm light cannot propagate in the sample. Reflectance by a BG is different than with a metal mirror. For a mirror the field is sharply localized at the surface and penetrates only the skin depth of the mirror, which is typically near 20 nm [68]. For a BG the attenuation occurs over distances comparable to or larger than the wavelength. For normal incidence at 580 nm, which is outside or near the edge of the PBG (Figure 5), the E2-field exists within the 1DPC and the 1DPC is partially transmissive (Figure 14, lower left). This E2-field corresponds to the reflectivity drop shown in Figure 13 for 580 nm in Range 2, indicating that the Range 2 dips are due to internal optical modes in the 1DPC.
Figure 14.
Illumination-induced electric field intensity (∣E2∣) calculated for the 1DPC shown in Figure 2.
We also calculated the E2-field for 580 nm for selected incident angles in Range 1 and Range 2. In Range 2 at 64.3 degrees and the E2-field is centered in the 1DPC structure (Figure 14, top right). A remarkably different result is found for 45.2 degrees at 580 nm in Range 1. In this case this E2-field is strongly localized on the surface of the 1DPC (bottom right). Additionally, the field intensity is much higher, almost 100-fold higher than for a reflected wavelength. These results demonstrate that the Range 1 resonances are BSWs, which have high quality factors that allow the energy to build up at the surface [63]. The potential fields in 1DPC are much higher than with metal films because of their higher dissipation loses in the latter case.
Figure 14 shows that the E2-field due to the BSW penetrates into the sample, but the other E2-field are inside the 1DPC. This suggests that only the BSW mode should be sensitive to the optical properties of the sample. We confirmed this speculation by changing the refractive index of the top layer, which in the sample is 45 nm of PVA. A change in refractive index caused an angular shift in Range 1 but not in Range 2 (Figure 13 bottom), confirming our assignment of the resonances.
The previous calculations allow assignment of the fluorescence spectral data with optical modes in the 1DPC. In both Range 1 and Range 2 the measured emission maxima shift to shorter wavelengths at large observation angles (Figures 10 and 11), which is the same trend found in the simulations (Figure 14). We assign the emission in angle Range 1 to BSW-coupled emission and in Range 2 to internal mode-coupled emission (IMCE). The emission spectra are narrower in Range 2 than in Range 1. At first glance this is counterintuitive because of the wider resonances in Range 2. However, the angle-wavelength dispersion is higher in Range 2. As a result, we believe a smaller range of wavelengths is captured by the optical fiber aperture in Range 2, leading to the more narrow spectra. The overall dispersion and spectral narrowing in the S-polarized emission might be the result of modifications in the density-of-states (DoS) by the PBG (vide infra).
Explanation of Dispersion diagrams
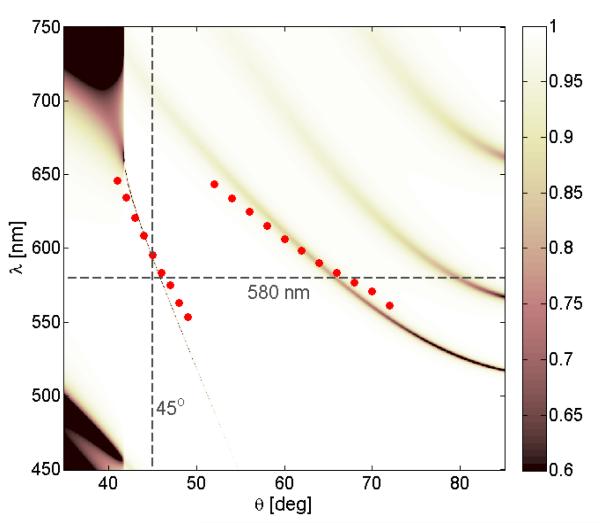
We expect BGCE to become widely used in chemistry and biology. This can be most effectively accomplished with an understanding of the optics and physics literature on PCs. We now take the opportunity to compare the simulations in Figure 13 with the dispersion diagrams as presented by the optics community. These dispersion diagrams are presented in varying degrees of complexity. An intuitive dispersion diagram is shown in Figure 15. Such plots are used because the reflectivity depends on both wavelength and incidence angle. This is in contrast to chromophores in which the absorption occurs at a fixed wavelength and does not depend on incidence angle. At first glance it can be difficult to correlate Figure 15 with the experimental results. This correlation is aided by considering the reflectivity at a selected wavelength, which is shown by straight lines in Figure 15. Consider the line at 580 nm. As the incident angle is increased there is a narrow reflectivity dip near 45 degrees. This corresponds to the BSW resonance seen at 580 nm in Figure 13. As the incidence angle is increased further in Figure 15 there is a wider reflectivity dip near 65°, which corresponds to the wider resonances, seen in Figure 13 at this angle. For all wavelengths the resonance angle increase as the wavelength decreases, consistent with Figure 13.
Figure 15.
Dispersion diagram for the 1DPC shown in Figure 2. The figure shows the reflectivity for a range of wavelengths and incidence angles. The dots represent the emission maxima and respective angles from Figures 10 (left) and 11 (left).
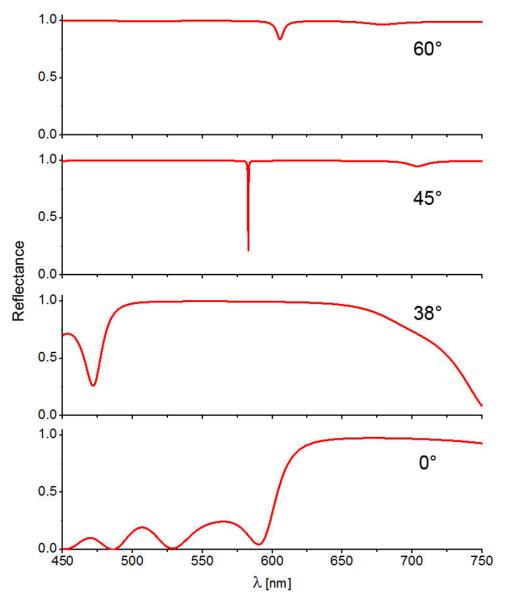
Another way to interpret these plots is to consider the reflectivity spectra at a given angle. Consider a vertical line on Figure 15 at 38° (not shown in the figure for clarity). There is a wide region of high reflectivity (white area) from 500 to 700 nm, and the reflectivity decreases above and below these wavelengths. This spectrum can be seen in Figure 16 from the progression from low (≈450 nm) to high (≈600 nm) to low (≈750 nm) reflectivity at the 38°. The spectrum in Figure 16 at 0° corresponds to the reflectivity spectrum at normal incidence shown in Figure 5. Now consider the reflectivity spectrum at 45° (Figure 16). In this case the sharp BSW resonance is seen at about 550 nm. The BSW is not seen with a higher than 60° angle of incidence. The dispersion diagram in Figure 15 contains all this reflectivity information, but slices across this diagram in Figure 16 clarify the effects measured in the laboratory.
Figure 16.
Angle-dependent reflectivity spectra from the dispersion plot shown in Figure 15.
We compared the calculated reflectivity with the angle-dependent emission spectra shown in Figures 10 and 11. The measured emission maximum at each angle are in excellent agreement with the BSW resonance in Range 1 and the internal mode in Range 2 (Figure 15). The small deviations are probably due to small differences between the optical properties of the single measured layers and the total composite structure.
Explanation of General Dispersion Diagrams
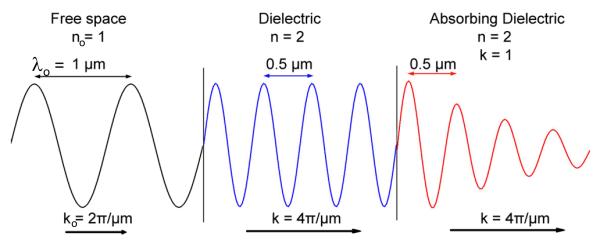
The dispersion diagrams used in the physics literature can be more abstract than Figure 15. In order to understand these dispersion diagrams, it is helpful to review the description of light using wavevectors and to have an intuitive understanding of k vectors [69]. Consider an electromagnetic wave with a wavelength of 1 μm in free space in a transparent isotropic medium propagating along the x-axis (Figure 17). The electric field at any position and time is given by
| (1) |
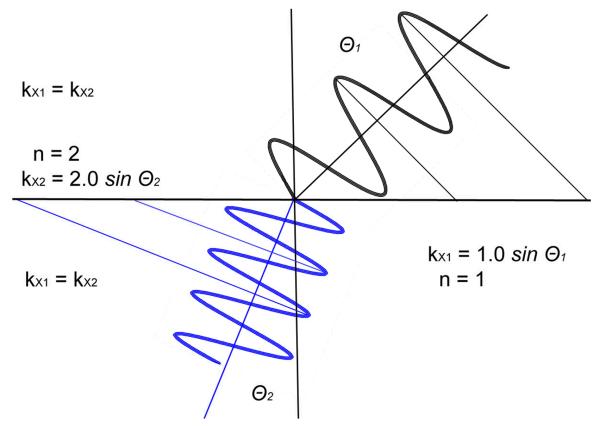
where E is the electric field amplitude, ν is the frequency in cycles/sec and x is the distance. The wavelength and speed of light depends on the medium but the frequency remains the same in different media. In a vacuum (n0 = 1), the wavelength is λ0, and the speed of light is c0. If the wave passes into a medium with a higher n value its speed is decreased to c = c0/n and the wavelength is also deceased by the same factor to λ = λ0/n (Figure 17). The decrease in wavelength can be somewhat confusing to the chemists and biologist for whom the wavelength always refers to the free-space wavelength. However, the optical properties of a structure depend on the wavelength in the structure, which in turn depends on the value of n. To avoid using different wavelengths, which can imply different energies; it is convenient to use the wavevector. A convenient way to interpret the wavevector is to imagine the wave at a single point in time. At this instant the E-field amplitude varies along the x-axis as cos[(2πν/c)x]. The units of 2πν/c are radians/μm. This term is called the wavevector k = 2πν/c. In free space k0 = 2πν/c0 and in a medium with a higher n = 2 the wavevector is k = n 2πν/c0 = nk0 (Figure 17). This means that at an instant in time the field along × changes more quickly with distance, from k0 radians/μm in air to k radians/μm in the dielectric. To match the incident wave, the refracted wave, and the reflected wave at the interface, all waves must have equal projections of their wavevectors on the interface plane.
Figure 17.
Schematic of a 1 μm wave in various media with different optical constants.
It is informative to consider how the wave vector at the interface (kx) varies with incidence angle. The spatial field distribution at the interface depends on the angle of incidence. If the wave is parallel to the interface the field changes with distance at the highest possible rate, so k along the x-axis is kx = k. If the wave is perpendicular to the interface the field at the interface is the same at any position of x at a given instant in time and kx = 0. At different angles kx = k sin θI where θI (Figure 17) is the angle of incidence. If a free-space wave encounters a glass plate then kx = k0 sin θI. If a wave in glass encounters a vacuum then at the boundary kx = k sin θI = nk0 sin θI. In fact this is the origin of Snell’s law for refraction at an interface n1 sin θ1 = n2 sin θ2. The tangential components of the electric field are equal on both sides of the interface. In the case of TE-polarized light electric field perpendicular to the plane of incidence this results in a continuity condition for the electric field.
Equation 1 describes a wave in a non-absorbing medium. A medium which absorbs or attenuates light is described by an imaginary refractive index . In this case E(x,t) is given in complex notation as shown in Equation 2. The wave in this absorbing medium has the same wavevector but its amplitude is attenuated with distance (Figure 17, right side).
| (2) |
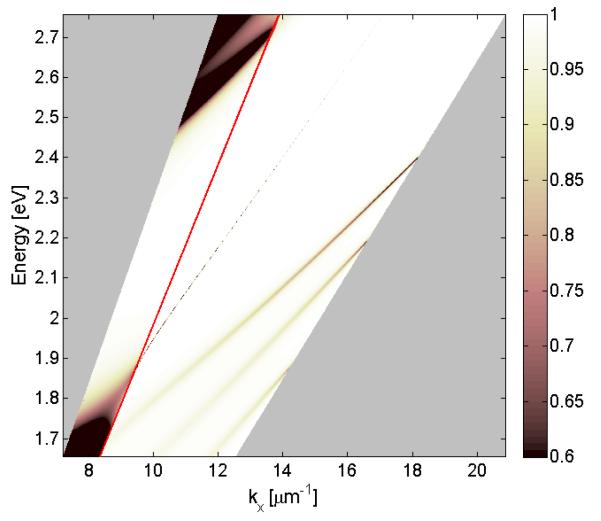
We now consider the more general dispersion diagram of our 1DPC (Figure 19). The light energy is usually presented in energy units of frequency or eV. The x-axis can be more confusing because it no longer explicitly contains the experimental incidence angle. Instead, the axis is presented in terms of the projection of the incident wavevector (k) onto the x-axis, which is given by kx = nk0 sin θ, where k0 is the free-space wavevector and θ is the incident angle. The area which shows reflectivity values corresponds to the area (λ–θ) shown in Figure 15. This figure also contains regions of wavelength-vs-wavelength space which are not present in the experiments. The region to the left of the red line represents conditions where light can propagate freely in air (n = 1.0). The dashed region on the right is determined by the maximum wave vector possible in the sample. Wavevectors in this region can only exist in a sample with a higher effective refractive index. The edge of this region is when the incident light is at 90°, parallel to the surface to maximize the kx wavevector.
Figure 19.
General dispersion diagram for the 1DPC shown in Figure 2. The reflectivity is shown for the area presented in Figure 15. The two areas with a pattern are outside Figure 15.
DISCUSSION
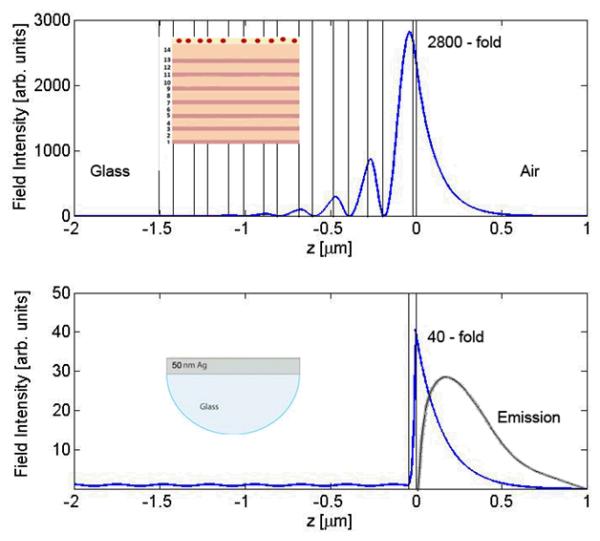
We believe that fluorescence detection with one-dimensional photonic structures can become widely used in the biosciences, particularly for high-throughput testing and clinical applications. These uses will be facilitated by the favorable structural and optical properties of 1DPCs. These structures do not require top-down nanofabrication methods, and can be produced using only vapor deposition. Dielectrics with suitable optical parameters are already known. The refractive index of Si3N4 can be adjusted by the relative amounts of silane and ammonia during deposition [70-71]. The fabrication IDPC structures have also been reported using other methods such as layer-by-layer assembly and spin-coating methods [72-73]. Low-loss dielectric provides high quality factors for resonances, which will probably provide selective excitation of surface-bound species. The top layer can be silica or alumina for which provides well-known surface chemistry easy conjugation of biomolecules. The possible uses of PC-coupled emission are increased by the presence of two types of coupling that is coupling to internal modes and to BSWs of the PC. For a solid PC the internal modes are confined within the structure and expected to be mostly insensitive to the sample on the structure. Coupling to these modes can serve as an unchanging reference. In contrast the energy of the BSWs extends into the sample and can thus be used for selective excitation or coupled emission. Additionally, the fraction of the energy which resides in the PC or in the sample can be adjusted by minor changes in the dimensions or optical constants [74-75]. BSWs can be created with both S- and P-polarized incident light [76] and can propagate on surfaces over distances of 200 microns [77]. Another favorable property of PCs is the possibility of large enhancements of local fields with BSW. Figure 20 shows a comparison of the field intensities for our 1DPC and for a continuous silver film on a glass prism. The high losses in the Ag film limits the evanescent field intensities to about 50-fold. Additionally, the emission is quenched at distances below 5 nm from the metal surfaces. In contrast, the evanescent fields can be increased 1000-fold or more with a BSW on a 1DPC. This is possible because of the lower losses in the dielectrics. Also, we do not expect quenching for fluorophores, which are directly on the top surface. We note that the BSW intensity profile is very sensitive to the assumed value of κ for energy losses. These considerations suggest that highly selective excitation of surface-bound fluorophores is possible with 1DPCs and BSWs.
Figure 20.
Comparison of the light induced fields with BSWs (top) and with a silver film (bottom).
A potential disadvantage of the use of 1DPCs is the sharp angular dependence of the BSWs. This angular dependence can be avoided by the use of RK excitation, which excites the fluorophores directly. With regards to emission we expect future structures will provide emission at an angle closer to the surface normal. We have recently reported this phenomenon in a metal-dielectric-metal structure [78]. If needed, the sharp angular dependence of the BSW can be diminished (the resonance mode wider) by introducing scattering or dissipation loses into the structure [67]. We expect our structures to be useful for microscopy because the resonances angles are within the collection angle of most high NA immersion objectives. In a recent paper we showed that BSW-coupled emission can be seen in microscopy [79].
A one-dimensional PC offers a rich variety of opportunities for modifying fluorophore emission. These opportunities can be seen by considering the local radiative density-of-states (LRDoS) in a 1DPC. The DoS is the number of optical modes that can exist in a given range of energies. It is known that the radiative rate (Γ) of a dipole is dependent upon to the surrounding DoS. This is known as Fermi’s Golden Rule. The situation becomes more complex near a photonic crystal because the LRDoS depends on the precise location near the structure. Additionally, the interaction of a dipole with the LRDoS depends on its orientation relative to the field directions in that precise location. As a result the radiative rate of a fluorophore varies with position, orientation and direction of the emitted radiation. To account for this complexity we can consider a simplified equation for the radiative rate (Γ) which depends on position and orientation (r) and frequency (ω)
| (3) |
where Γ0 is the radiative rate for homogeneous environment with n = 1.0. The term represents the LRDoS) normalized by the free space DoS, far away from the photonic crystal. The LRDoS is a complex function of the structural details of the 1DPC and the spectral properties, location and orientation of the fluorophores. For our purposes represents a proportionality factor which modifies the free space emission rate of the fluorophore (Γ0). The reader is referred to the original publications for a precise definition of the LRDoS [80-81].
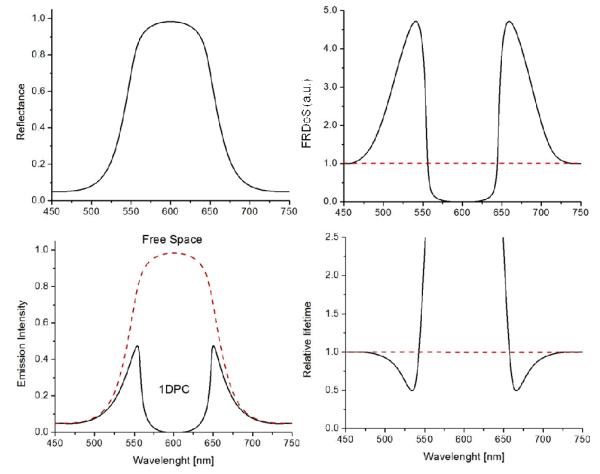
In a homogeneous solution, such as a fluorophore in water, the LRDoS is essentially constant in all locations, in all directions and for all orientations of the dipole. In contrast the LRDoS can vary dramatically near a photonic crystal. This is shown schematically in Figure 21. Figure 21 does not show calculated LRDoS but rather increases or decreases relative to the free-space density of states which have been reported in the literature. The LRDoS approaches zero in the PBG, which is seen by the increase in reflectivity at the center of the PGB (top two panels). A less well-known effect is the increase in the LRDoS at the edges of the PBG. Depending on wavelength and orientation a fluorophore can display either an increased lifetime for a low LRDoS or a decreased lifetime for a high LRDoS. The emission spectrum can be reduced at wavelengths where there is a low LRDoS and increased for a high LRDoS (lower two panels). An indication of such changes in the emission spectra was noticed with S-polarized emission shown in Figures 10 and 11. However, at this time we do not know if fluorophores will couple as efficiently with the LRDoS near photonic crystals as do fluorophores couple with plasmonic structures. That is we do not yet know the range of lifetimes that can be obtained with 1DPCs. The actual situation is more complex than shown in Figure 21 because the actual effect will depend on the location and orientation of the fluorophore, and on the direction of the emission. These factors are described the LRDoS, which occurs for a specific set of conditions [82-85]. These conditions show that the 1DPC provide multiple and diverse opportunities for near-field control of dipole emission.
Figure 21.
Schematic of the effects of the Fractional Radiative Density-of-States on fluorophores.
CONCLUSION
In summary, we anticipate that Bragg grating-coupled emission from 1DPCs provides a new approach to the design formats. The development of simple, robust devices for sensing, methodologies in biotechnology and medical applications may take advantages of 1DPCs assisted directional and wavelength-resolved emission [86-88]. This prediction is supported by the known ability to modify the direction of BSWs by refraction [89-90]. For the past decade metallic structures have been the main focus for sub-diffraction-limited detection, as exemplified by sensing in metallic nanoholes [91-92]. Recent reports have shown that Bloch surface waves can provide sub-diffraction limited resolution [93-96]. The use of photonic structures is a promising addition to the ongoing studies of fluorophores and near-field interactions.
Figure 18.
Wave vector matching across an interface.
ACKNOWLEDGMENT
We thank UMCP Fablab. This work was supported by NIH Grants RO1HG002655, RO1EB006521 and RO1HG005090. E. D. Thanks financial support from EU FP7 project BILOBA (Grant # 318035).
REFERENCES
- [1].Lakowicz JR, Ray K, Chowdhury M, Szmacinski H, Fu Y, Zhang J, Nowaczyk K. Plasmon-controlled fluorescence: a new paradigm in fluorescence spectroscopy. Analyst. 2008;133:1308–1346. doi: 10.1039/b802918k. [DOI] [PMC free article] [PubMed] [Google Scholar]
- [2].Deng W, Goldys EM. Plasmonic approach to enhanced fluorescence for applications in biotechnology and the life sciences. Langmuir. 2012;28:10152–10163. doi: 10.1021/la300332x. [DOI] [PubMed] [Google Scholar]
- [3].Lakowicz JR. Radiative decay engineering 5: Metal-enhanced fluorescence and plasmon emission. Anal. Biochem. 2005;337:171–194. doi: 10.1016/j.ab.2004.11.026. [DOI] [PMC free article] [PubMed] [Google Scholar]
- [4].Cao S-H, Cai W-P, Liu Q, Li Y-Q. Surface plasmon-coupled emission: What can directional fluorescence bring to the analytical sciences? Annu. Rev. Anal. Chem. 2012;5:317–36. doi: 10.1146/annurev-anchem-062011-143208. [DOI] [PubMed] [Google Scholar]
- [5].Lai C-F, Kuo H-C, Yu P, Lu T-C, Chao C-H, Yen H-H, Yeh W-Y. Highly-directional emission patterns based on near single guided mode extraction from GaN-based ultrathin microcavity light-emitting diodes with photonic crystals. Appl. Phys. Letts. 2010;97:0131808–1/3. [Google Scholar]
- [6].Ray K, Chowdhury MH, Lakowicz JR. Aluminum nanostructured films as substrates for enhanced fluorescence in the ultraviolet-blue spectral region. Anal Chem. 2007;79:6480–6487. doi: 10.1021/ac071363l. [DOI] [PMC free article] [PubMed] [Google Scholar]
- [7].Akbay N, Madhavi F, Lakowicz JR, Ray K. Metal-enhanced intrinsic fluorescence of nucleic acids using platinum nanostructured substrates. Chem. Phys. Letts. 2012;548:45–50. doi: 10.1016/j.cplett.2012.08.020. [DOI] [PMC free article] [PubMed] [Google Scholar]
- [8].Feng X, Liu F, Huang Y. Spontaneous emission rate enhancement of silicon nanocrystals by plasmonic bandgap on copper grating. J. Lightwave Technology. 2010;28(9):1420–1430. [Google Scholar]
- [9].Zhang Y, Aslan K, Previte MJR, Geddes CD. Metal-enhanced fluorescence from copper substrates. Appl. Phys. Letts. 2007;90:173116–1/3. [Google Scholar]
- [10].Zhang Y, Dragan A, Geddes CD. Broad wavelength range metal-enhanced fluorescence using nickel nanodeposits. J. Phys. Chem. C. 2009;113:15811–15816. [Google Scholar]
- [11].Szmacinski H, Murtaza Z, Lakowicz JR. Time-resolved fluorometric method for one-step immunoassays using plasmonic nanostructures. J. Phys. Chem. C. 2010;114:7236–7241. doi: 10.1021/jp906743m. [DOI] [PMC free article] [PubMed] [Google Scholar]
- [12].Knoben W, Offermans P, Brongersma SH, Crego-Calama M. Metal-induced fluorescence enhancement as a new detection mechanism for vapor sensing. Sensors and Acutators B: Chem. 2010;148:307–314. [Google Scholar]
- [13].Zhou L, Ding F, Chen H, Ding W, Zhang W, Chou SY. Enhancement of immunoassay’s fluorescence and detection sensitivity using three-dimensional plasmonic nano-antenna-dots array. Anal. Chem. 2012;84:4489–4495. doi: 10.1021/ac3003215. [DOI] [PubMed] [Google Scholar]
- [14].Tang F, Ma N, Tong L, He F, Li L. Control of metal-enhanced fluorescence with pH- and thermoresponsive hybrid microgels. Langmuir. 2012;28:883–888. doi: 10.1021/la203704j. [DOI] [PubMed] [Google Scholar]
- [15].Zhao J, Zhang X, Yonzon CR, Haes AJ, Van Duyne RP. Localized surface plasmon resonance biosensors. Nanomedicine. 2006;1:219–228. doi: 10.2217/17435889.1.2.219. [DOI] [PubMed] [Google Scholar]
- [16].Norton SJ, Vo-Dinh T. Plasmonics quenching and enhancement of a fluorescing molecule outside and inside a silver metallic nanoshell. IEEE Trans. Nanotechnol. 2011;10:1264–1274. [Google Scholar]
- [17].Deng W, Drozdowicz-Tomsia K, Jin D, Goldys EM. Enhanced flow cytometry based bead immunoassays using metal nanostructures. Anal. Chem. 2009;81:7248–7255. doi: 10.1021/ac900947h. [DOI] [PubMed] [Google Scholar]
- [18].Zhang J, Fu Y, Li G, Zhao RY, Lakowicz JR. Detection of CXCR4 receptors on cell surface using a fluorescent metal nanoshell. J. Biomed. Optics. 2011;16:01611–1/7. doi: 10.1117/1.3528623. [DOI] [PMC free article] [PubMed] [Google Scholar]
- [19].Bharadwaj P, Novotny L. Spectral dependence of single molecule fluorescence enhancement. Optics Exp. 2007;15:14266–14274. doi: 10.1364/oe.15.014266. [DOI] [PubMed] [Google Scholar]
- [20].Fu Y, Zhang J, Lakowicz JR. Large enhancement of single molecule fluorescence by coupling to hollow silver nanoshells. ChemComm. 2012;48:9726–9728. doi: 10.1039/c2cc34025a. [DOI] [PMC free article] [PubMed] [Google Scholar]
- [21].Kinkhabwala A, Yu Z, Avlasevich Y, Mullen K, Moerner WE. Large single-molecule fluorescence enhancements produced by a bowtie nanoantenna. Nature Photonics. 2009;3:654–657. [Google Scholar]
- [22].Thongrattanasiri S, Kuhta NA, Escarra MD, Hoffman AJ, Gmachi CF, Podolskiy VA. Analytical technique for subwavelength far field imaging. Appl. Phys. Letts. 2010;97:1011031–3. [Google Scholar]
- [23].Chowdhury MH, Catchmark JM, Lakowicz JR. Imaging three-dimensional light propagation through periodic nanohole arrays using scanning aperture microscopy. Appl. Phys. Letts. 2007;91:103118–1/3. doi: 10.1063/1.2783177. [DOI] [PMC free article] [PubMed] [Google Scholar]
- [24].Vedantam S, Lee H, Tang J, Conway J, Staffaroni M, Yablonovitch E. A plasmonic dimple lens for nanoscale focusing of light. Nano Letts. 2009;9:3447–3452. doi: 10.1021/nl9016368. [DOI] [PubMed] [Google Scholar]
- [25].Rong G, Wang H, Skewis LR, Reinhard RM. Resolving sub-diffraction limit encounters in nanoparticle tracking using live cell plasmon coupling microscopy. Nano Letts. 2008;8:3386–3393. doi: 10.1021/nl802058q. [DOI] [PMC free article] [PubMed] [Google Scholar]
- [26].Saleh BEA, Teich MC. Fundamentals of Photonics. 2nd Edition Wiley-Interscience; 2007. [Google Scholar]
- [27].Joannopoulos JD, Johnson SG, Winn JN, Meade RD. Molding the Flow of Light. 2nd ed Princeton University Press; 2008. Photonic Crystals; p. 286. [Google Scholar]
- [28].Yablonovitch E. Inhibited spontaneous emission in solid-state physics and electronics. Phys. Rev. Letts. 1987;58:2059–2062. doi: 10.1103/PhysRevLett.58.2059. [DOI] [PubMed] [Google Scholar]
- [29].John S. Strong localization of photons in certain disordered dielectric superlattices. Phys. Rev. Letts. 1987;58:2486–2489. doi: 10.1103/PhysRevLett.58.2486. [DOI] [PubMed] [Google Scholar]
- [30].Lodahi P, van Driel F, Nikolaev IS, Irman A, Overgaag K, Vanmaekelbergh D, Vos WL. Controlling the dynamics of spontaneous emission from quantum dots by photonic crystals. Nature. 2004;430:654–657. doi: 10.1038/nature02772. [DOI] [PubMed] [Google Scholar]
- [31].Ganesh N, Zhang W, Mathias PC, Chow E, Soares JANT, Malyarchuk V, Smith AD, Cunningham BT. Enhanced fluorescence emission from quantum dots on a photonic crystal surface. Nature Nanotechnology. 2007;3:515–520. doi: 10.1038/nnano.2007.216. [DOI] [PubMed] [Google Scholar]
- [32].Nikolaev IS, Lodahl P, Vos WL. Fluorescence lifetime of emitters with broad homogeneous line-widths modified in optical photonic crystals. J. Phys. Chem. C. 2008;112:7250–7254. [Google Scholar]
- [33].Kubo S, Fujishima A, Sato O, Segawa H. Anisotropic accelerated emission of the chromophores in photonic crystals consisting of a polystyrene opal structure. J. Phys. Chem. C. 2009;113:11704–11711. [Google Scholar]
- [34].Block ID, Mathias PC, Ganesh N, Jones SL, Dorvel BR, Chaudhery V, Vodkin LO, Bashir R, Cunningham BT. A detection instrument for enhanced-fluorescence and label-free imaging on photonic crystal surfaces. Optics Exp. 2009;17:13222–13235. doi: 10.1364/oe.17.013222. [DOI] [PMC free article] [PubMed] [Google Scholar]
- [35].Huang C-S, George S, Lu M, Chaudhery V, Tan R, Zangar RC, Cunningham BT. Application of photonic crystal enhanced fluorescence to cancer biomarker microarrays. Anal. Chem. 2011;83:1425–1430. doi: 10.1021/ac102989n. [DOI] [PMC free article] [PubMed] [Google Scholar]
- [36].Nair RV, Vijaya R. Photonic crystal sensors: An overview. Progress in Quantum Electronics. 2010;34:89–134. [Google Scholar]
- [37].Zhu Y, Xu W, Zhang H, Wang W, Tong L, Xu S, Sun Z, Song H. Highly modified spontaneous emission in YVO4:Eu3+ inverse opal and refractive index sensing application. Appl. Phys. Letts. 2012;100:081104–1/4. [Google Scholar]
- [38].Sukhoivanov IA, Guryev IV, Lucio JAA, Mendez EA, Trejo-Duran M, Torres-Cisneros M. Photonic density of states maps for design of photonic crystal devices. Microelectronic Journal. 2008;39:685–689. [Google Scholar]
- [39].Kaniber M, Laucht A, Hurlimann T, Bichler M, Meyer R, Amann M-C, Finley JJ. Highly efficient single-photon emission from single quantum dots within a two-dimensional photonic band-gap. Phys. Rev. B. 2008;77:07331201–4. [Google Scholar]
- [40].Meistikow MD, Mosk AP, Yeganegi E, Huisman SR, Lagendijk A, Vos WL. Inhibited spontaneous emission of quantum dots observed in a 3D photonic band gap. Phys. Rev. Letts. 2011;107:193903–1/5. doi: 10.1103/PhysRevLett.107.193903. [DOI] [PubMed] [Google Scholar]
- [41].Ye JY, Ishikawa M, Yamane Y, Tsurumachi N, Nakatsuka H. Enhancement of two-photon excited fluorescence using one-dimensional photonic crystals. Appl. Phys. Letts. 1999;75:3605–3607. [Google Scholar]
- [42].Guo Y, Divin C, Myc A, Terry FL, Baker JR, Norris TB, Ye JY. Sensitive molecular binding assay using a photonic crystal structure in total internal reflection. Optics Express. 2008;16:11741–11749. doi: 10.1364/oe.16.011741. [DOI] [PMC free article] [PubMed] [Google Scholar]
- [43].Velev OD, Gupta S. Materials fabricated by micro- and nanoparticle assembly- The challenging path from science to engineering. Adv. Materials. 2009;21:1897–1905. [Google Scholar]
- [44].Holtz JH, Asher SA. Polymerized colloidal crystal hydrogel films as intelligent chemical sensing materials. Nature. 1997;389:829–332. doi: 10.1038/39834. [DOI] [PubMed] [Google Scholar]
- [45].Alexeev VL, Sharma AC, Goponenko AV, Das S, Lednev IK, Wilcox CS, Finegold DN, Asher SA. High ionic strength glucose-sensing photonic crystal. Anal. Chem. 2003;75:2316–2323. doi: 10.1021/ac030021m. [DOI] [PubMed] [Google Scholar]
- [46].Lakowicz JR. Radiative decay engineering 3. Surface plasmon-coupled directional emission. Anal. Biochem. 2004;324:153–169. doi: 10.1016/j.ab.2003.09.039. [DOI] [PMC free article] [PubMed] [Google Scholar]
- [47].Gryczynski I, Malicka J, Gryczynski Z, Lakowicz JR. Radiative decay engineering 4. Experimental studies of surface plasmon-coupled directional emission. Anal. Biochem. 2004;324:170–182. doi: 10.1016/j.ab.2003.09.036. [DOI] [PMC free article] [PubMed] [Google Scholar]
- [48].Gao J, Sarangan AM, Zhan Q. Experimental confirmation of strong fluorescence enhancement using one-dimensional GaP/SiO2 photonic band gap structure. Optical Materials Exp. 2011;1:1216–1223. [Google Scholar]
- [49].Ye JY, Ishikawa M. Enhancing fluorescence detection with a photonic crystal structure in a total-internal reflection configuration. Optics Letts. 2008;33:1729–1731. doi: 10.1364/ol.33.001729. [DOI] [PubMed] [Google Scholar]
- [50].Ding Y, Magnusson R. Resonant leaky-mode spectral-band engineering and device applications. Optics Exp. 2004;12:5661–5674. doi: 10.1364/opex.12.005661. [DOI] [PubMed] [Google Scholar]
- [51].Ganesh N, Block ID, Mathias PC, Zhang W, Chow E, Malyarchuk V, Cunningham BT. Leaky-mode assisted fluorescence excitation: application to fluorescence enhancement biosensors. Optics Express. 2008;16:21626–21640. doi: 10.1364/oe.16.021626. [DOI] [PubMed] [Google Scholar]
- [52].Ramos-Mendieta F, Halevi P. Surface electromagnetic waves in two-dimensional photonic crystals: Effect of the position of the surface plane. Phys. Rev. B. 1999;59:15112–15120. [Google Scholar]
- [53].Meade RD, Brommer KD, Rappe AM, Joannopoulos JD. Electromagnetic Bloch waves at the surface of a photonic crystal. Phys. Rev. B. 1999;44:44–49. doi: 10.1103/physrevb.44.10961. [DOI] [PubMed] [Google Scholar]
- [54].Liscidini M, Sipe JE. Enhancement of diffraction for biosensing applications via Bloch surface waves. Appl. Phys. Letts. 2007;91:253125–1/3. [Google Scholar]
- [55].Farmer A, Friedli AC, Wright SM, Robertson WM. Biosensing using surface electromagnetic waves in photonic band gap multilayers. Sensors and Actuators B: Chem. 2012;173:79–84. [Google Scholar]
- [56].Paeder V, Musi V, Hvozdara L, Herminjard S, Herzig HP. Detection of protein aggregation with a Bloch surface wave based sensor. Sensors and Actuators B: Chem. 2011;257:260–264. [Google Scholar]
- [57].Sinibaldi A, Danz N, Descrovi E, Munzert P, Schulz U, Sonntag F, Dominici L, Michelotti F. Direct comparison of the performance of Bloch surface wave and surface plasmon polariton sensors. Sensors and Actuators B. 2012;174:292–298. [Google Scholar]
- [58].Giorgis F, Descrovi E, Summonte C, Dominici L, Michelotti F. Experimental determination of the sensitivity of Bloch surface waves bases sensors. Optics Exp. 2010;18:8087–8093. doi: 10.1364/OE.18.008087. [DOI] [PubMed] [Google Scholar]
- [59].Rivolo P, Michelotti F, Frascella F, Digregorio G, Mandracci P, Dominici L, Giorgis F, Descrovi E. Real time secondary antibody detection by means of silicon-based multilayers sustaining Bloch surface waves. Sensors and Actuators B. 2012;161:1046–1052. [Google Scholar]
- [60].Frascella F, Ricciardi S, Rivolo P, Moi V, Giorgis F, Descrovi E, Michelotti F, Munzert P, Danz N, Napione L, Alvaro M, Bussolino F. A fluorescent one-dimensional photonic crystal for label-free biosensing based on Bloch surface waves. Sensors. 2013;13:2011–2022. doi: 10.3390/s130202011. [DOI] [PMC free article] [PubMed] [Google Scholar]
- [61].Ye JY, Ishikawa M. Enhancing fluorescence detection with a photonic crystal structure in a total-internal-reflection configuration. Optics Letts. 2008;33:1729–1731. doi: 10.1364/ol.33.001729. [DOI] [PubMed] [Google Scholar]
- [62].Inouye H, Arakawa M, Ye JY, Hattori T. Optical properties of a total-reflection-type one-dimensional photonic crystal. IEEE Explore. 2002;38:867–871. [Google Scholar]
- [63].Ballarini M, Frascella F, Michelotti F, Digregorio G, Rivolo P, Paeder V, Musi V, Giorgis F, Descrovi E. Bloch surface waves-controlled emission of organic dyes grafted on a one-dimensional photonic crystal. Appl. Phys. Letts. 2011;99:043302–1/3. [Google Scholar]
- [64].Gryczynski I, Malicka J, Nowaczyk K, Gryczynski Z, Lakowicz JR. Effects of sample thickness on the optical properties of surface plasmon-coupled emission. J. Phys. Chem. B. 2004;108:12073–12083. doi: 10.1021/jp0312619. [DOI] [PMC free article] [PubMed] [Google Scholar]
- [65].Lakowicz JR. Radiative decay engineering: Biophysical and biomedical applications. Anal. Biochem. 2001;298:1–24. doi: 10.1006/abio.2001.5377. [DOI] [PMC free article] [PubMed] [Google Scholar]
- [66].Lakowicz JR, Shen Y, D’Auria S, Malicka J, Fang J, Gryczynski Z, Gryczynski I. Radiative Decay Engineering. 2. Effects of Silver Island Films on Fluorescence Intensity, Lifetimes, and Resonance Energy Transfer. Anal. Biochem. 2002;301:261–277. doi: 10.1006/abio.2001.5503. [DOI] [PMC free article] [PubMed] [Google Scholar]
- [67].Michelotti F, Sinibaldi A, Munzert P, Danz N, Descrovi E. Probing losses of dielectric multilayers by means of Bloch surface waves. Optics Letts. 2013;38:616–618. doi: 10.1364/OL.38.000616. [DOI] [PubMed] [Google Scholar]
- [68].Brongersma ML, Kik PG, editors. Surface Plasmon Nanophotonics. Springer; New York: 2010. p. 268. [Google Scholar]
- [69].Griffiths DJ. Introduction to Electrodynamics. Prentice Hall; New Jersey: 1999. p. 576. [Google Scholar]
- [70].Sinibaldi A, Descrovi E, Giorgis F, Dominici L, Ballarini M, Mandracci P, Danz N, Michelotti F. Hydrogenated amorphous silicon nitride photonic crystals for improved performance surface electromagnetic wave biosensors. Biomed. Optics Exp. 2012;3:2405–2410. doi: 10.1364/BOE.3.002405. [DOI] [PMC free article] [PubMed] [Google Scholar]
- [71].Ricciardi C, Ballarini V, Galli M, Liscidini M, Andreani LC, Losurdo M, Bruno G, Lettieri S, Gesuele F, Maddalena P, Giorgis F. Amorphous silicon nitride: a suitable alloy for optical multilayered structures. J. Non-Crystalline Solids. 2006;352:1294–1297. [Google Scholar]
- [72].Inoue A, Inoue S, Yokoyama S, Kojima K, Yasui K, Ozawa M, Odoi K. One dimensional polymeric photonic crystal doped with second-order nonlinear optical chromophore. Proc. SPIE. 2009;7213:72131C–1/8. [Google Scholar]
- [73].Kurt P, Banerjee D, Cohen RE, Rubner MF. Structural color via layer-by-layer deposition: layered nanoparticle arrays with near-UV and visible reflectivity bands. J. Materials Chem. 2009;19:8920–8927. [Google Scholar]
- [74].Liscidini M, Sipe JE. Analysis of Bloch-surface-wave assisted diffraction-based biosensors. J. Opt. Soc. Am. B. 2009;26:279–289. [Google Scholar]
- [75].Guillermain E, Lysenko V, Orobtchouk R, Benyattou T, Roux S, Pillonnet A, Perriat P. Bragg surface wave device based on porous silicon and its application for sensing. Appl. Phys. Letts. 2007;90:241116–1/2. [Google Scholar]
- [76].Gao J, Saranagan AM, Zhan Q. Polarization multiplexed fluorescence enhancer using a pixelated one-dimensional photonic band gap structure. Optics Letts. 2012;37:2640–2642. doi: 10.1364/OL.37.002640. [DOI] [PubMed] [Google Scholar]
- [77].Descrovi E, Sfez T, Dominici L, Nakagawa W, Michelotti F, Giorgis F, Herzig H-P. Near-field imaging of Bloch surface waves on silicon nitride one-dimensional photonic crystals. Optics Express. 2008;16:5453–5464. doi: 10.1364/oe.16.005453. [DOI] [PubMed] [Google Scholar]
- [78].Choudhury SD, Badugu R, Nowaczyk K, Ray K, Lakowicz JR. Tuning fluorescence direction with plasmonic metal-dielectric-metal substrates. J. Phys. Chem. Lett. 2013;4:227–232. doi: 10.1021/jz301867b. [DOI] [PMC free article] [PubMed] [Google Scholar]
- [79].Angelini A, Enrico E, De Leo N, Munzert P, Boarino L, Michelotti F, Giorgis F, Descrovi E. Fluorescence diffraction assisted by Bloch surface waves on one-dimensional photonic crystals. New J. Phys. 2013 accepted. [Google Scholar]
- [80].Vats N, John S. Theory of fluorescence in photonic crystals. Phys. Rev. A. 2002;65:043808–1/3. [Google Scholar]
- [81].Nikolaev IS, Vos WL, Koenderink AF. Accurate calculation of the local density of optical states in inverse-opal photonic crystals. J. Opt. Soc. Am. B. 2009;26:987–997. [Google Scholar]
- [82].Barth M, Gruber A, Cichos F. Spectral and angular redistribution of photoluminescence near a photonic stop band. Phys. Rev. B. 2005;72:085129–1/7. [Google Scholar]
- [83].Boriskina SV, Gopinath A, Negro LD. Optical gaps, mode patterns and dipole radiation in two-dimensional aperiodic photonic structures. Physica E. 2008;41:1102–1106. [Google Scholar]
- [84].Koenderink AF, Kafesaki M, Soukoulis CM, Sandoghdar V. Spontaneous emission in the near field of two-dimensional photonic crystals. Optics Letts. 2005;30:3210–3212. doi: 10.1364/ol.30.003210. [DOI] [PubMed] [Google Scholar]
- [85].Cesa Y, Blum C, van den Broek JM, Mosk AP, Vos WL, Subramaniam V. Manipulation of the local density of photonic crystals to elucidate fluorescent protein emission rates. Phys. Chem. Chem. Phys. 2009;11:2525–2531. doi: 10.1039/b817902f. [DOI] [PubMed] [Google Scholar]
- [86].Sprik R, Van Tiggelen BA, Lagendijk A. Optical emission in periodic dielectrics. Europhysics Letts. 1996;35:265–270. [Google Scholar]
- [87].Wagner R, Heerklotz L, Kortenbruck N, Cichos F. Back focal plane imaging spectroscopy of photonic crystals. Appl. Phys. Letts. 2012;101:081904–1/4. [Google Scholar]
- [88].Frezza I, Patrini M, Liscidini M, Comoretto D. Directional enhancement of spontaneous emission in polymer flexible microcavities. J. Phys. Chem. C. 2011;115:19939–19946. [Google Scholar]
- [89].Sfez T, Descrovi E, Yu L, Quaglio M, Dominici L, Nakagawa W, Michelotti F, Giorgis F, Herzig P. Two-dimensional optics on silicon nitride multilayer: Refraction of Bloch surface waves. Appl. Phys. Letts. 2010;96:151101–1/3. [Google Scholar]
- [90].Descrovi E, Sfez T, Quaglio M, Brunazzo D, Dominici L, Michelotti F, Herzig HP, Martin OJF, Giorgis F. Guided Bloch surface waves on ultrathin polymeric ridges. Nano Lett. 2010;10:2087–2091. doi: 10.1021/nl100481q. [DOI] [PubMed] [Google Scholar]
- [91].Kelly CV, Baird BA, Craighead HG. An array of planar apertures for near-field fluorescence correlation spectroscopy. Biophys. J. 2011;100:L34–L36. doi: 10.1016/j.bpj.2011.02.034. [DOI] [PMC free article] [PubMed] [Google Scholar]
- [92].Schadt EE, Turner S, Kasarskis A. A window into third-generation sequencing. Human Molec. Genetics. 2010;19:R227–R240. doi: 10.1093/hmg/ddq416. [DOI] [PubMed] [Google Scholar]
- [93].Engelen RJP, Mori D, Baba T, Kuipers L. Subwavelength structure of the evanescent field of an optical Bloch wave. Phys. Rev. Letts. 2009;102:023902–1/4. doi: 10.1103/PhysRevLett.102.023902. [DOI] [PubMed] [Google Scholar]
- [94].Su S-Y, Yoshie T. Optical surface edge Bloch modes: low-loss subwavelength scale two-dimensional light localization. Optics Letts. 2012;37:4398–4400. doi: 10.1364/OL.37.004398. [DOI] [PubMed] [Google Scholar]
- [95].Chatterjee R, Panoiu NC, Liu K, Dios Z, Yu MB, Doan MT, Kaufman LJ, Osgood RM, Wong CW. Achieving subdiffraction imaging through bound surface states in negative refraction photonic crystals in the near-infrared range. Phys. Rev. Letts. 2008;100:187401–1/4. doi: 10.1103/PhysRevLett.100.187401. [DOI] [PubMed] [Google Scholar]
- [96].Estrada LC, Martinez OE, Brunstein M, Bouchoule S, Le-Gratiet L, Talneau A, Sagnes I, Monnier P, Levenson JA, Yacomotti AM. Small volume excitation and enhancement of dye fluorescence on a 2D photonic crystal surface. Optics Express. 2010;18:3693–3699. doi: 10.1364/OE.18.003693. [DOI] [PubMed] [Google Scholar]


