Abstract
Purpose/Background:
Injury screening methods that use three‐dimensional (3D) motion analysis accurately predict the risk of injuries, yet are expensive. There is great need for valid, cost‐effective techniques that can be used in large‐scale assessments. Utilizing two‐dimensional (2D) measures of lateral trunk motion may identify athletes at risk for lower extremity injury. The purpose of this research was to determine the strength of the relationships between 2D and 3D calculations of lateral trunk angle for female athletes performing a single‐leg cross drop landing.
Methods:
Twenty‐one high‐school female volleyball players performed a single‐leg cross drop landing onto a force plate. The 3D angular trunk motion was calculated, and four different 2D measures of lateral trunk angle were calculated for both left and right landing leg. A one‐way multivariate analysis of variance was used to compare 2D measures to the 3D measurements, and Pearson correlations were used to determine the strength of these relationships.
Results:
The angle formed by the medial shoulder joint center, medial ASIS, and vertical line (LTA4) was similar to the 3D measures of lateral trunk angle during landing (r‐values ≥ 0.62; p‐values ≤ 0.003; mean differences, ‐1.0° to 1.2°).
Conclusions:
Given the recent focus on the role of the trunk in lower extremity injury, using the 2D LTA4 assessment may expand existing assessments into a composite model that can more accurately assess female athletes at risk for injury than models that do not include trunk analysis.
Clinical Relevance:
Existing models that enable clinicians to effectively identify female athletes at risk for lower extremity injury may be enhanced by including accurate assessments of lateral trunk motion.
Keywords: Female, kinematics, risk assessment, trunk displacement
Background
Injury screening methods that use three‐dimensional (3D) motion analysis accurately predict the risk of debilitating lower extremity injuries in athletes, such as anterior cruciate ligament (ACL) rupture.1 However, 3D screening techniques are expensive and labor‐intensive, and requiring large, dedicated laboratories with costly measurement tools, which limits widespread application. This drives the need for valid, cost‐effective techniques that can be used to perform large‐scale assessments so targeted interventions can reach a greater population of athletes who are at risk for injury. Relevant tools that use two‐dimensional (2D) analyses have been developed to detect risky lower extremity biomechanics. Recently, a clinic‐based landing assessment tool using 2D measures of frontal plane knee angle as part of a composite model was developed to identify athletes at risk of having a high knee abduction load upon landing and predicted female athletes who had high knee abduction moments with 84% sensitivity and 67% specificity.2
Recently, lower extremity injury risk models that incorporate assessment of lateral trunk motion during dynamic movements have received increased interest and development. During dynamic movements, lateral trunk motion can shift the ground reaction force vector laterally from the stance limb, increasing the potential for a high knee abduction moment, a risk factor for ACL injury.3,4 The mechanical link between trunk position and increased knee abduction moment has previously been supported; Hewett et al found using 2D videographic analysis that lateral trunk motion was higher in female athletes during an ACL injury than male athletes and trended toward being higher than female controls,5 and Dingenen et al reported that combined 2D measures of lateral trunk motion and knee abduction angle were significantly correlated with peak knee abduction moment assessed using a 3D motion system.6 In order to reduce lower extremity injury risk, identification of those who demonstrate deficits in trunk control during high‐risk maneuvers may be important in accurately determining knee injury mechanics. Unfortunately, it is not known what 2D techniques are optimal to capture dynamic lateral trunk motion that may be associated with injury risk. Therefore, the purpose of this study was to explore four different 2D measures of lateral trunk motion with respect to the gold‐standard 3D measures in female athletes performing a single‐leg cross drop landing in order to determine the strength of the relationships between 2D and 3D measures of trunk movement upon landing.
Description
Participants
A team of 21 high‐school female volleyball players (mean age 15.3 SD 1.0 years; height 169 SD 4.8 cm; weight 62.8 SD 8.2 kg) volunteered for participation in this study. Participants were excluded if they had sustained a lower extremity injury that precluded them from athletic activity. Approval by the Institutional Review Board of the Cincinnati Children's Hospital Medical Center for the study protocol was received and informed consent was obtained from each participant prior to testing.
Data Collection
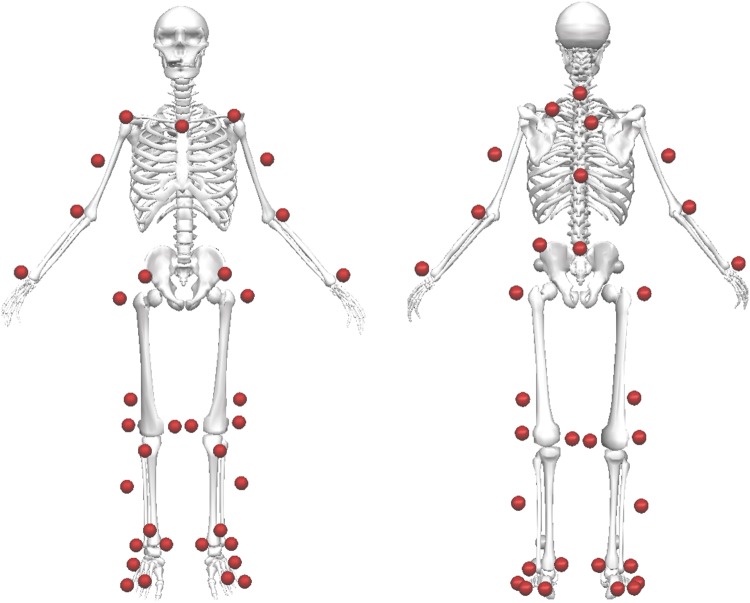
Three‐dimensional trunk angular motion was collected on each participant performing three single leg cross drop (SCD) landings on each side onto an embedded force plate (AMTI, BP600900, Watertown, MA) from a height of 31 cm. The SCD was developed in order to reproduce the effect of lateral trunk movement by perturbing the trunk in a controlled laboratory setting. One investigator prepared each participant with 43 retroreflective markers with a minimum of three markers per segment in a modified Helen‐Hayes arrangement (Figure 1).7
Figure 1.
Front and back views of the modified Helen‐Hayes marker arrangement used in this study. Markers were attached with a minimum of three markers per segment.
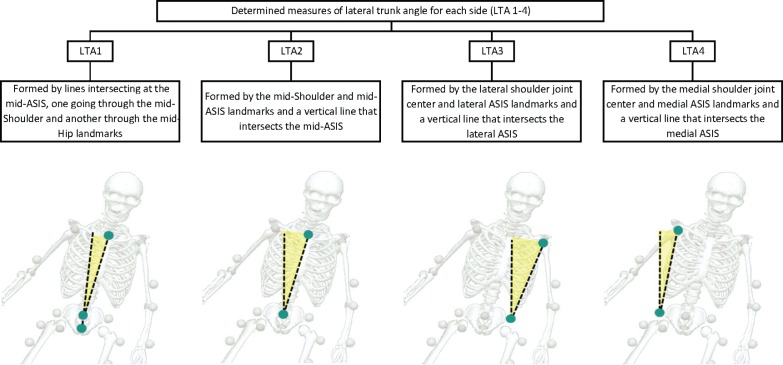
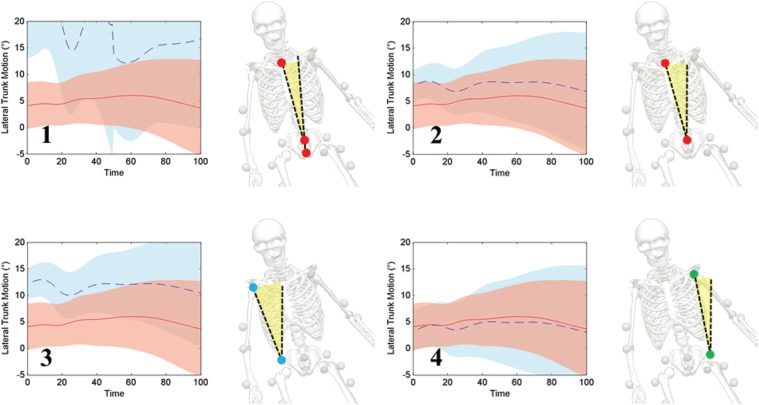
Participants wore a small backpack with three non‐collinearly placed markers to track trunk motion. Motion data was collected at 240 Hz using a 10‐camera motion capture system (Eagle, Motion Analysis Corp., Santa Rosa, CA). Marker trajectories were filtered using a low‐pass fourth order Butterworth filter at a cutoff frequency of 12 Hz and trunk angular motion was calculated using Visual3D (C‐Motion, Inc., Germantown, MD). Two‐dimensional data was calculated in Visual3D by isolating the frontal plane position data of either three landmarks or two landmarks and a vertical line of reference and determining the angle formed by these landmarks. Figure 2 illustrates the process by which each of the four measures of 2D lateral trunk angle (LTA1‐LTA4) was determined. Lateral was defined as toward the landing leg; for example, the right ASIS is lateral when landing on the right leg, and medial was defined as away from the landing leg.
Figure 2.
Flowchart describing how the four measures of lateral trunk angle (LTA 1‐4) were calculated with examples of each measure.
Experimental Task
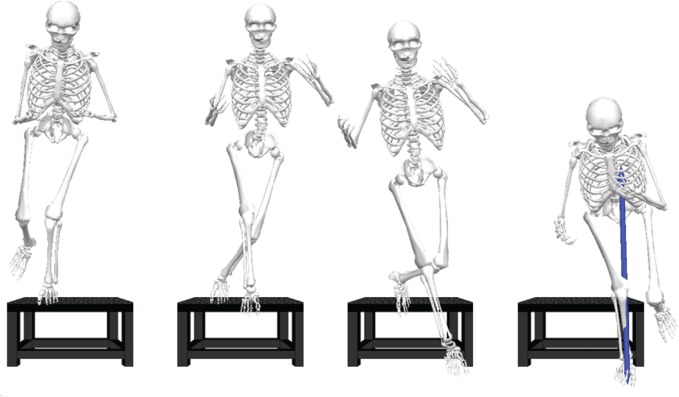
The SCD was performed by balancing on one foot, crossing the landing foot in front of the balancing foot, hopping forward and medially off of the box, and landing in the middle of the force plate and holding for a minimum of two seconds (Figure 3). Trials were repeated if participants stepped off the box instead of hopping, turned their body in the direction of the hop, or were unable to hold the landing.
Figure 3.
Illustration of the single‐leg cross drop landing for the right side.
Statistical Testing
A one‐way MANOVA with Tukey method pairwise post‐hoc testing was used to compare lateral trunk angle measurements during the landing phase, designated as 500 ms8 after initial contact with the force plate. Independent variables were method of trunk angle calculation (3D, LTA1, LTA2, LTA3, LTA4) and landing leg (left, right). Dependent variables were lateral trunk angle at initial contact, maximum medial angle, which was determined when the subject's trunk reached its most medial position, maximum lateral angle, which was determined when the subject's trunk reached its most lateral position, and range of motion (ROM), which was determined as the absolute range between initial contact and maximum lateral angle. The level of significance was set at α=0.05, and analyses were performed separately for the left and right sides. Pearson correlations were performed, in order to determine the strength of the relationships between 2D and 3D outcome measures.
Results
A main effect was found for the calculation method (p < 0.001). Mean 3D measurements for lateral trunk angle were 2.8° (SD 4.2°) at initial contact, 9.4° (SD 5.3°) at maximum lateral trunk angle, ‐1.1° (SD 5.0°) at maximum medial trunk angle, and 10.2° (SD 3.6°) lateral trunk angle ROM. Post‐hoc analysis revealed that LTA4 was the only 2D method that was similar to the 3D measurements for each dependent variable (p ≥ 0.894). LTA2 was similar to the 3D measurements at maximum lateral trunk angle (p = 0.086), maximum medial trunk angle (p = 0.284), and trunk angle ROM (p = 0.969). LTA1 only demonstrated similar values to the 3D measurements at maximum medial trunk angle (p = 0.999), while LTA3 was only similar to the 3D measurements in trunk angle ROM (p = 0.887). Mean differences (with 95% confidence intervals) for lateral trunk angles calculated by each LTA model with respect to 3D measurements are displayed in Table 1.
Table 1.
Mean differences (with 95% confidence interval) between corresponding 3D and 2D measurements of lateral trunk angle for each of all four LTA techniques
| 95% Confidence Interval | |||||
|---|---|---|---|---|---|
| Dependent Variable | Independent Variable | Mean Difference | Lower Bound | Upper Bound | p‐value |
| Initial Contact | LTA1 | ‐15.2 | ‐18.0 | ‐12.3 | .000 |
| LTA2 | ‐4.4 | ‐7.2 | ‐1.5 | .000 | |
| LTA3 | ‐8.5 | ‐11.4 | ‐5.7 | .000 | |
| LTA4 | 0.1 | ‐2.7 | 3.0 | 1.000 | |
| Max Lateral Angle | LTA1 | ‐15.3 | ‐19.4 | ‐11.3 | .000 |
| LTA2 | ‐3.7 | ‐7.8 | 0.3 | .086 | |
| LTA3 | ‐7.7 | ‐11.8 | ‐3.7 | .000 | |
| LTA4 | 0.1 | ‐3.9 | 4.2 | 1.000 | |
| Max Medial Angle | LTA1 | ‐0.4 | ‐4.7 | 3.8 | .999 |
| LTA2 | ‐3.0 | ‐7.2 | 1.2 | .284 | |
| LTA3 | ‐6.7 | ‐10.9 | ‐2.5 | .000 | |
| LTA4 | 1.2 | ‐3.0 | 5.4 | .940 | |
| Trunk Angle ROM | LTA1 | ‐14.9 | ‐18.1 | ‐11.8 | .000 |
| LTA2 | ‐0.7 | ‐3.9 | 2.4 | .969 | |
| LTA3 | ‐1.1 | ‐4.2 | 2.1 | .887 | |
| LTA4 | ‐1.0 | ‐4.2 | 2.1 | .894 | |
LTA= Lateral Trunk Angle
Note: p‐value < 0.05 indicates dependent variable mean is significantly different from 3D measurement mean.
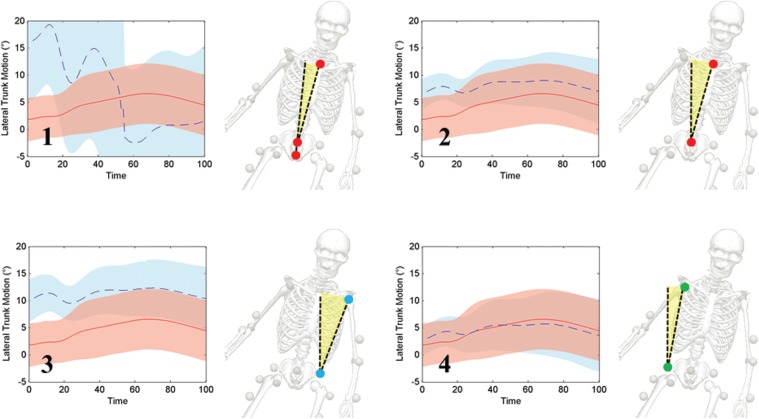
A main effect was also found between sides (p < 0.001). Mean 3D measurements for lateral trunk angle during a left side landing (Figure 4) were 1.9° (SD 4.2°) at initial contact, 9.4° (SD 5.8°) at maximum lateral trunk angle, ‐1.2° (SD 4.2°) at maximum medial trunk angle, and 10.6° (SD 3.7°) lateral trunk angle ROM. Post‐hoc analysis revealed that leg side demonstrated statistical differences in lateral trunk angle only at initial contact (p = 0.024), where lateral trunk angle values for a right leg landing (Figure 5) were 3.6° (SD 4.1°). Similarly, lateral trunk angle at initial contact was also greater for right leg landings than left leg landing in LTA1‐4. There was no main effect for method‐by‐side interaction (p = 0.352). Correlations between independent variables fell within an acceptable range to be used in a MANOVA analysis (0.319 ≤ r ≤ 0.884). Similarly, Pearson correlations revealed significant relationships (p ≤ 0.003) with moderate‐to‐excellent coefficients of 0.62‐0.89 between 3D and LTA4 outcome measures (Table 2).
Figure 4.
Landmark designations for determination of 2‐Dimensional measurements of lateral trunk angle during a cross drop onto the left leg for (1) LTA1, (2) LTA2, (3) LTA3, and (4) LTA4. Red line/shaded area is mean ± SD time‐series 3D trunk angle, and blue line/shaded area is 2D trunk angle.
Figure 5.
Landmark designations for determination of 2‐Dimensional measurements of lateral trunk angle during a cross drop onto the right leg for (1) LTA1, (2) LTA2, (3) LTA3, and (4) LTA4. Red line/shaded area is mean ± SD time‐series 3D trunk angle, and blue line/shaded area is 2D trunk angle.
Table 2.
Pearson Correlation Coefficients and p‐values between 3D and LTA4 Outcome Variables
| Dependent Variable | r‐values | p‐values |
|---|---|---|
| Initial Contact | ||
| Left | 0.64 | .002 |
| Right | 0.68 | .001 |
| Max Lateral Angle | ||
| Left | 0.89 | .000 |
| Right | 0.83 | .000 |
| Max Medial Angle | ||
| Left | 0.62 | .003 |
| Right | 0.88 | .000 |
| Trunk Angle ROM | ||
| Right | 0.84 | .000 |
| Right | 0.87 | .000 |
Note: p‐value < 0.05 indicates dependent variable mean is significantly different from 3D measurement mean.
Discussion
Determination of valid 2D techniques is imperative for clinicians who intend to reach a larger population with targeted interventions in order to attempt to prevent injury. This study assessed the validity of multiple 2D techniques used to measure lateral trunk angle during an SCD landing. Of the four techniques used in this study, LTA4, which was calculated using the medial shoulder joint center, the medial ASIS, and a vertical line of reference, most closely exemplified 3D measures of lateral trunk angle. LTA4 can serve as a proxy for clinicians who do not have access to a 3D motion system to digitize 2D lateral trunk motion.
Post‐hoc analysis indicated that the 2D method of calculation that most closely represented 3D measurements of lateral trunk angle was LTA4, showing no statistical differences for any of the four dependent variables considered by this study. Also, for separate dependent variables, LTA1, LTA2, and LTA4 each expressed a smaller mean difference from 3D measurements than the other 2D methods. This finding indicates that, at some point during landing, each of these models was the optimal choice for reproducing frontal plane 3D trunk kinematics. However, though each 2D model was comparable to 3D motion values at some point and demonstrated individual advantages at various body orientations, LTA4 presented the most robust model for matching 3D lateral trunk angle measurements throughout the landing phase. The reason LTA4 was the most accurate calculation of 2D lateral trunk angle or LTA1‐3 were less accurate may be because of the location of the vertical line of reference used in each calculation; the vertical line used in LTA4 lay medially to the trunk, whereas the vertical line overlaid the trunk itself in LTA2 and LTA3 or was not present at all (LTA1). Thus, LTA4 represents a deviation away from a medial point of reference, which may have served as the point at which frontal plane trunk angle is neutral, whereas the others do not. It is possible that the lack of statistical difference between 3D and LTA4 outcome measures was attenuated by extreme miscalculations of trunk angle cancelling each other out (for example, if one subject scored high 3D trunk displacement but low 2D displacement, and another subject scored low 3D displacement and high 2D displacement, there would be no discernible difference in the average); however, strong correlation coefficients between the outcome variables indicate that this is likely not the case.
The use of valid 2D techniques has high potential for clinicians who aim to assess injury risk and prescribe interventions to athletes but do not have access to a 3D motion analysis system. LTA4 serves as a proxy for clinicians who have access to 2D video and can record athletes performing the SCD maneuver, which can then be used to digitize the medial shoulder joint center and ASIS in order to determine lateral trunk motion. Two‐dimensional video has been shown to be reliable when comparing video measures of knee‐to‐ankle separation ratio and frontal plane knee projection angle with 3D measures, with an intraclass correlation coefficient of 0.92.9 Moreover, 2D video has been used to deliver augmented feedback for athletes to correct frontal plane knee angle while performing a tuck jump task,10 as well as to improve knee flexion angle and decrease vertical ground reaction force upon landing a jump.11
The results of the current study have clinical implications in assessing lower extremity injury risk, especially for the knee. Given the recent focus on the role of the trunk in lower extremity injuries,4 the described LTA4 method of measuring trunk angle could potentially be used in a composite model of lower extremity injury risk. A regression model that incorporated lateral trunk displacement after a sudden force release to predict female athletes who went on to suffer ACL injuries with 83% sensitivity and 76% specificity.12 During maturation, rapid increases in the height of the center of mass in female athletes make muscular control of the trunk difficult. Deficiency in neuromuscular control of the trunk contributes to increased external knee moments by compromising lower limb stability during dynamic movements.4 This deficiency is evident in greater displacement of the trunk in the frontal plane during unilateral movements such as cutting or single‐leg landings.13 Figure 6 shows the relationship between subjects' lateral trunk ROM as determined by LTA4 and peak knee abduction angle during landing. Such is an example of an application of this method that could be used to develop a composite model for injury risk prediction; however, further studies are warranted to determine the validity of this approach. That LTA1‐4 expressed the same relationships in side‐to‐side differences as 3D measurements indicates that 2D techniques may have the potential to accurately assess side‐to‐side asymmetries, which have been documented as a potential risk factor for lower extremity injuries, including ACL injury.1,14 Accordingly, in clinical situations where 3D models are not feasible to obtain, 2D models such as LT4 may still serve a clinical function as they may identify changes in performance, presence of asymmetries, and relative injury risk without difficulty of implementation.
Figure 6.
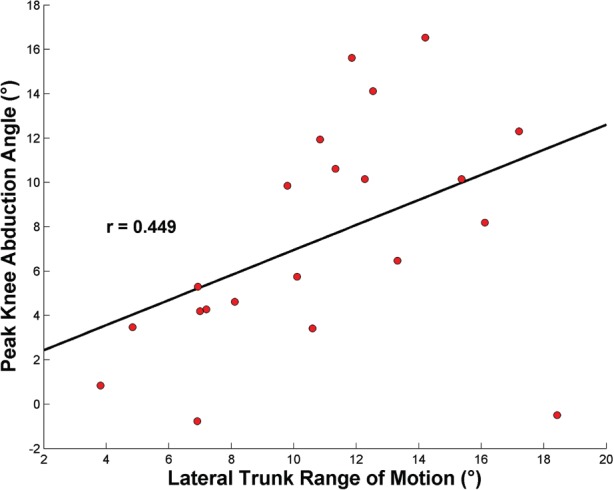
Association between average values of lateral trunk range of motion as determined by LTA4 and peak knee abduction angle that occurred within the first 500 ms after initial contact during the single‐leg cross drop.
Conclusion
While there is a pressing need to develop cost‐effective and accurate risk assessment tools for widespread clinical use, the current results provide a promising approach to the application of 2D techniques to support this need. Focusing solely on joint motion and moment may not only lead to a misinterpretation of the injury mechanism but may also prohibit the application of optimal intervention to reduce risk. Determination of lateral trunk displacement during athletic maneuvers such as the SCD has been purported to be an important indicator of injury risk. The method proposed by the study could be used to enhance or refine existing clinical and 2D models to give the clinician a more comprehensive picture of an athlete's risk for lower extremity injury.
REFERENCES
- 1.Hewett TE Myer GD Ford KR,et al. Biomechanical measures of neuromuscular control and valgus loading of the knee predict anterior cruciate ligament injury risk in female athletes: a prospective study. Am J Sports Med. 2005;33(4):492‐501 [DOI] [PubMed] [Google Scholar]
- 2.Myer GD Ford KR Khoury J Succop P Hewett TE Development and validation of a clinic‐based prediction tool to identify female athletes at high risk for anterior cruciate ligament injury. Am J Sports Med. 2010;38(10):2025‐2033 [DOI] [PMC free article] [PubMed] [Google Scholar]
- 3.Winter DA Biomechanics and Motor Control of Human Movement. 3rd ed. ed. New York: John Wiley & Sons, Inc.; 2005 [Google Scholar]
- 4.Hewett TE Myer GD The mechanistic connection between the trunk, hip, knee, and anterior cruciate ligament injury. Exerc Sport Sci Rev. 2011;39(4):161‐166 [DOI] [PMC free article] [PubMed] [Google Scholar]
- 5.Hewett TE Torg JS Boden BP Video analysis of trunk and knee motion during non‐contact anterior cruciate ligament injury in female athletes: lateral trunk and knee abduction motion are combined components of the injury mechanism. Br J Sports Med. 2009;43(6):417‐422 [DOI] [PMC free article] [PubMed] [Google Scholar]
- 6.Dingenen B Malfait B Vanrenterghem J Verschueren SM Staes FF The reliability and validity of the measurement of lateral trunk motion in two‐dimensional video analysis during unipodal functional screening tests in elite female athletes. Phys Ther Sport. 2014;15(2):117‐123 [DOI] [PubMed] [Google Scholar]
- 7.Bates NA Ford KR Myer GD Hewett TE Impact differences in ground reaction force and center of mass between the first and second landing phases of a drop vertical jump and their implications for injury risk assessment. J Biomech. 2013;46(7):1237‐1241 [DOI] [PMC free article] [PubMed] [Google Scholar]
- 8.Ford KR Myer GD Smith RL Vianello RM Seiwert SL Hewett TE A comparison of dynamic coronal plane excursion between matched male and female athletes when performing single leg landings. Clin Biomech. 2006;21(1):33‐40 [DOI] [PubMed] [Google Scholar]
- 9.Griffin L Cafarelli E Resistance training: cortical, spinal, and motor unit adaptations. Can J Appl Physiol. 2005;30(3):328‐340 [DOI] [PubMed] [Google Scholar]
- 10.Griffin LD Feature classes for 1D, 2nd order image structure arise from natural image maximum likelihood statistics. Network. 2005;16(2‐3):301‐320 [DOI] [PubMed] [Google Scholar]
- 11.Onate JA Guskiewicz KM Marshall SW Giuliani C Yu B Garrett WE Instruction of jump‐landing technique using videotape feedback: altering lower extremity motion patterns. Am J Sports Med. 2005;33(6):831‐842 [DOI] [PubMed] [Google Scholar]
- 12.Zazulak BT Hewett TE Reeves NP Goldberg B Cholewicki J Deficits in neuromuscular control of the trunk predict knee injury risk: a prospective biomechanical‐epidemiologic study. Am J Sports Med. 2007;35(7):1123‐1130 [DOI] [PubMed] [Google Scholar]
- 13.Jamison ST Pan X Chaudhari AM Knee moments during run‐to‐cut maneuvers are associated with lateral trunk positioning. J Biomech. 2012;45(11):1881‐1885 [DOI] [PubMed] [Google Scholar]
- 14.Howard JS Fazio MA Mattacola CG Uhl TL Jacobs CA Structure, sex, and strength and knee and hip kinematics during landing. J Athl Train. 2011;46(4):376‐385 [DOI] [PMC free article] [PubMed] [Google Scholar]


