Abstract
Introduction
The purpose of this study was to develop and test techniques for tracking the path of contact between the tibial and femoral total knee replacement components during level over-ground walking. The tibio-femoral path of contact could be an indicator of the in vivo performance of a total knee replacement as an estimator of areas of contact between the implant components. A longer contact path, indicative of more sliding between the implant components during walking, could indicate an implant at risk for increased wear. In addition, the tibio-femoral contact path determines the position and length of the muscle and ligament lever arms about the knee, and can subsequently influence knee contact force calculations.
Methods
Two methods were developed to predict the tibio-femoral contact pathways for total knee replacement devices. Both methods used patient-specific knee kinematics obtained during gait analysis, standard radiographs obtained during clinical follow-ups, and point-clouds of the tibial and femoral bearing surfaces. The validity of the techniques was evaluated with knee wear simulator tests and comparisons to wear scars on postmortem retrieved tibial components.
Results
The average total anterior-posterior distance covered by the contact path for ten patients implanted with a total knee replacement was 29.01 mm on the lateral side, and 21.80 mm on the medial side. Both methods for predicting the tibiofemoral contact pathways yielded similar results, and fell within the wear scars of simulator-tested and postmortem retrieved implants.
Conclusions
The methods for predicting the tibio-femoral contact pathway using marker-based gait analysis and standard clinical radiographs are computationally simple, and reliably predict contact path characteristics as evaluated against wear scars from knee wear simulator tests and postmortem retrieved implants.
Keywords: tibio-femoral contact path, total knee replacement, marker-based gait analysis, knee contact mechanics
Introduction
The path of contact between the tibia and femur during activities of daily living (ADLs) is critical for calculating knee internal contact forces via numerical modeling. The tibio-femoral contact path location defines the moment arms for structures (muscles, ligaments, and contact forces) acting about the knee. Knee joint sliding distance and relative sliding velocity, important contributors to wear of total knee replacement (TKR) devices, can also be determined from the tibio-femoral contact path. Some of the error in modeling attempts to predict knee contact forces may be due to incorrect assumptions of the tibio-femoral contact pathway as seen by sensitivity studies to this parameter1, 2.
The predominant technology for determining tibiofemoral contact is fluoroscopy3-13. Three-dimensional computer models of TKR components are fitted to the fluoroscopic images. The contact point is defined as the centroid of the intersection of the articulating surfaces, or the closest point between articulating surfaces. However, this technique is available in few laboratories and is not a standard-of-care procedure.
Our goal was to develop a method to reliably predict the tibio-femoral contact path during gait using subject- specific anatomy, prosthesis geometry, standard radiographs from clinical follow-ups, and three-dimensional relative TKR joint kinematics from marker-based motion analysis. The tibio-femoral contact paths were predicted for ten TKR patients during the stance phase of gait. We also compared the predicted contact pathways to wear scars from knee-wear simulator tests and postmortem retrieved tibial components for verification of the methods. We hypothesized that we would find good agreement between two methods for predicting the tibio-femoral contact pathways, and that both methods would predict contact pathways that fell within wear scars on knee-wear simulator tested components and postmortem retrieved components.
Methods
1. Motion Analysis, Point-Clouds, and Coordinate Systems
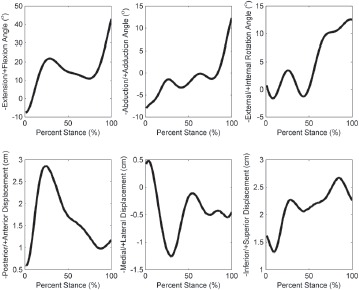
A four-camera optoelectronic system (Qualisys, Gothenburg, Sweden) tracked movements of reflective markers at 120 Hz during level walking from heel-strike to toe-off14. The point cluster technique (PCT)15 measured six degree-of-freedom knee movements during stance: three displacements in the anterior-posterior (AP), medial-lateral (ML), and superior-inferior (SI) directions, and three rotation angles corresponding to knee flexion-extension, abduction-adduction, and external-internal rotation (Figure 1). All motions obtained with the PCT were reported with respect to the TEA in an anatomical-femoral coordinate system based on palpated landmarks16: the medial and lateral femoral epicondyles, the greater femoral trochanter, the lateral- most and medial-most aspects of the tibial plateau, and the lateral and medial malleoli.
Figure 1. Three-dimensional knee kinematics during the stance phase of walking for a sample patient tested in the Motion Analysis Laboratory using the point cluster technique (PCT) 15. Movements are for the femur in a coordinate system originating at the mid-point of the transepicondylar axis (Figure 2).
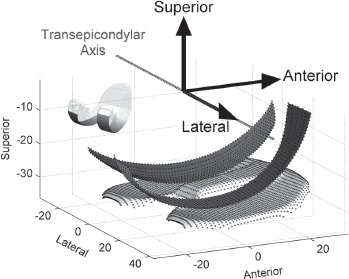
Point-clouds of the bearing surfaces of a Miller- Galante II TKR device were obtained using a touch-probe coordinate measuring machine (SmartScope, Optical Gaging Products, Inc., Rochester, NY). Coordinates of the articular surfaces were collected at one-millimeter increments for the tibial component and two-millimeter increments for the femoral component (Figure 2). The femoral point-cloud only encompassed the surface areas of the condyles that articulated with the tibia (Figure 2, inset).
Figure 2. Tibial and femoral component point clouds (dotted surfaces). The point clouds are shown in the femoral anatomical reference frame where the x-axis points laterally (coincident with the transepicondylar axis, TEA, of the femoral condyles), the y-axis points anteriorly, and the z-axis points superiorly.
2. Subject Demographics
Three-dimensional knee motions were obtained during level walking from ten TKR patients (6M/4F) after informed consent and IRB approval. Patients performed three walking trials at a “normal” self-selected walking speed. Contact paths of the index knee were calculated for the walking trial with a speed closest to 1 m/s for each subject. Mean walking speed was 1.07 ± 0.15 m/s for all patients for the chosen trials. All ten patients were implanted with a Miller-Galante II (MGII) TKR device (Zimmer Inc., Warsaw, IN) in the same hospital. Four devices were implanted in the left side, six in the right (defining the index knees).
3. Radiographic Measurements
Measurements from AP and lateral planar radiographs taken during post-operative clinical follow-ups were used to align the point-clouds with the anatomical coordinate system (Figure 3). AP radiographs were assumed to show the knee in a fully-extended neutral position. Lateral radiographs were chosen that showed the posterior femoral condyles superimposed to the greatest extent. On both views, rectangles were drawn bounding the femoral component. Rectangle width and height (Figure 3, labels 5, 6, 9, 10) were used to scale radiographic measurements to the known implant size for each patient.
Figure 3. Radiographic measurements for placing the implant point clouds in the anatomical reference frame (Figure 2). Label Numbers: 1) bottom of femoral component to medial epicondyle, 2) bottom of femoral component to lateral epicondyle, 3) medial edge of femoral component to bone, 4) lateral edge of femoral component to bone, 5) x-ray medial-lateral (ML) femoral component width, 6) x-ray anterior-posterior (AP) femoral component height, 7) AP distance from the epicondylar axis to the lowest anterior femoral component point, 8) tibial component posterior slope angle, 9) x-ray AP tibial component width, and 10) x-ray ML tibial component height.
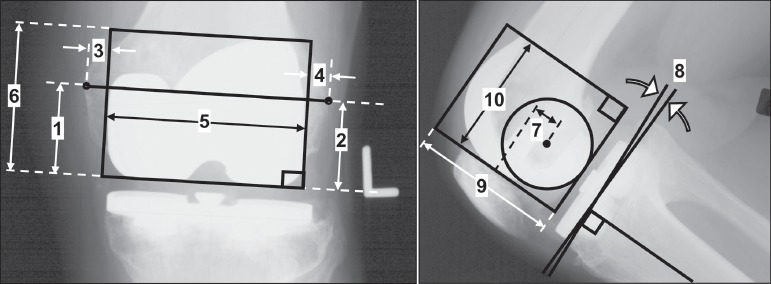
Additional measurements were used to align the components with the anatomical coordinate system originating at the midpoint of the TEA (Figure 3, labels 1-4, 7, 8). On AP radiographs, the TEA connected the medial and lateral epicondylar processes and the midpoint was the anatomical coordinate system origin. Three translations were performed to move the point-clouds to the anatomical coordinate system origin. 1) The femoral point-cloud was translated in the ML direction (along the x-axis) by the average of the perpendicular distances from the rectangle sides to the epicondyles (labels 3, 4). 2) On the lateral radiograph, a circle was fit to the posterior femoral condyles, and the center of the circle was defined as the TEA12,17-22. The femoral point-cloud was translated in the AP direction (along the y-axis) by the distance measured from the center of the circle to the lowest anterior-most point on the femoral component (label 7). 3) The femoral point-cloud was translated in the SI direction (along the z-axis) by the average of the perpendicular distances to the medial and lateral epicondyles (labels 1, 2). Finally, the femoral point-cloud was rotated about the anterior axis (y-axis) to align the TEA with the x-axis (labels 1, 2). The tibial point-cloud was translated and rotated by the same values as the femoral point-cloud and was rotated about the lateral axis (x-axis) by the posterior slope (label 8). After the point-clouds were properly aligned with respect to the bones, they could be transformed by knee kinematics.
4. Tibio-femoral Contact Path Algorithms: Shortest Distance Method (SDM) and Contour Distance Method (CDM)
Two methods were developed to determine the tibiofemoral contact pathway. For the Shortest Distance Method (SDM), the tibio-femoral contact pathway was defined as the shortest distance between the transformed femoral and tibial point-clouds at 100 instances during the stance phase walking. The tibial plateau point-cloud was fixed while the femoral point-cloud was transformed according to the knee kinematics in an orthopaedic Euler rotation sequence about the body axes of the TKR components, Equation (1). The femoral point-cloud was first transformed by translation (xAP, yML, and zSI, for AP, ML, and SI translation, respectively), second by internal-external rotation (0), third by adduction/abduction (9), and finally by flexion/extension (a).
 |
(1) |
For each instance of stance, the inferior-most point of the femoral point-cloud was defined as the “femoral contact point” because it was assumed that the lowest point would be the first to contact and/or penetrate the tibial plateau. The tibial point that generated the minimum linear distance to the femoral contact point was deemed the “tibial contact point”. The process was repeated for lateral and medial compartments. Although the positions of the TKR components were registered to the underlying bones using radiographs, the starting position of the femoral component on the tibial component was unknown. To address this issue, an automated, iterative process was used to position the contact path on the tibial plateau. The initial AP position of the tibial point-cloud relative to the femoral point-cloud was chosen so that the range of AP femoral condylar motion was constrained to and centered on the tibial plateau. Next the contact paths were calculated. The relative locations of the centroids of the contact paths, compared to the average centroid location of wear scars on postmortem retrieved tibial plateaus23 (described below) were next determined. The tibial point-cloud was repositioned relative to the femoral point-cloud to match the contact path centroids with the wear scar centroids, and the contact paths were again calculated. The iterative process allowed subject- and walking trial-specific initial positioning of the femur with respect to the tibia.
The second method for calculating the tibio-femoral contact pathway, Contour Distance Method (CDM), was based on existing software24. For the CDM, the TKR point-clouds (aligned as for the SDM) were transformed by a Cartesian Euler rotation sequence, Equation (2), about fixed global reference axes. The tibial plateau remained fixed while the femoral component rotated according to the patient kinematics. Vectors were computed for all femoral points which defined the projection of the femoral component onto the tibial component. The contact point was defined as the centroid of the area of penetration between the femoral and tibial components, or the centroid of the area that enclosed the 10% of the points closest between the two components.
 |
(2) |
Contact path calculations were performed with custom software written in Matlab (v.7.8.0, The Mathworks, Inc., Natick, MA) and a C++ executable.
5. Comparison of predicted tibio-femoral contact paths to simulator-tested tibial components
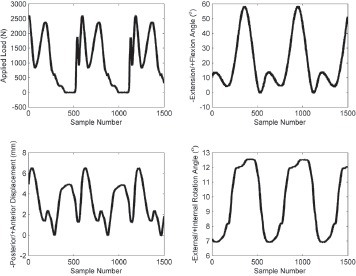
Three left-sided Miller-Galante II TKR devices were worn using a knee simulator. Prior to testing, the surfaces of the tibial components were digitized in AP line scans at 100x100μm nominal XY point spacing with a low-incidence laser coordinate measuring machine (Optical Gaging Products, Inc., Rochester, NY) for input to the contact path algorithms. The superior articulating surface of each tibial insert was dotted with a permanent marker. Components were then loaded into a knee simulator of a certified testing laboratory (EndoLab GmbH, Rosenheim, Germany) and tested under the loads and motions specified by the ISO-force controlled standard ISO 14242-125 for 15,000 cycles at 1.0 Hz. The location of initial contact between the femoral and tibial component was measured. Flexion, anterior-posterior translation, internal-external rotation, and axial force data from each station were recorded for a full cycle every 5,000 cycles (Figure 4) such that full cycle recordings were taken three times. Following testing, wear scars were obtained by tracing the inner boundaries of remaining marker dots using the optical microscope (SmartScope).
Figure 4. Example applied load, flexion angle, anterior-posterior displacement, and internal-external rotation angle applied to the TKRs by the knee simulator. Data shown is for one insert at 5000 cycles of the 15000 cycle test.
The recorded motion applied by the knee simulator to each station was used for tibio-femoral contact path calculation. Because tibio-femoral contact is an area rather than a single point, a Hertzian contact area solution centered about each point on the contact path was computed. A rigid cylinder was assumed for the femoral component and a compliant flat plane was assumed for the tibial plateau. Contact area is a narrow rectangle of width “2b” by length “L” specified by Equation (3)26.
 |
(3) |
For a given instance of stance “i”, contact area is a narrow rectangle of width “2b” by length “L” under applied load “P”, femoral condyle radius of curvature “r“, Poisson's ratio of the tibial component “u”, and Young's modulus of the tibial component “E”.
Applied load was taken directly from the simulator output for each test (Figure 4). Radius of curvature was calculated from the position of contact along an arc bisecting the femoral condyles. Poisson's ratio was equal to 0.4; Young's modulus to 930 MPa27. The rectangle length was equal to the width of the femoral condyles, 20 mm. Contact rectangles were calculated for all time points and overlaid to represent cumulative contact area centered about the contact paths.
6. Comparison to postmortem retrieved tibial components
We investigated 21 Miller-Galante II polyethylene inserts (Zimmer, Warsaw, IN, USA) retrieved postmortem 19 to 145 months after implantation. The retrieved inserts came from six men (8 inserts) and 11 women (13 inserts). The average age of the patients at time of the index arthroplasty was 75.2 years (range 59-87 years).
The video based measuring system (SmartScope) was again used to digitize the outlines of polished areas within the wear scars on the tibial plateaus. The outlines were normalized to the same implant size, mirrored if of a left implant to represent a right knee implant, and overlaid with a 5 mm by 5 mm square grid. A frequency count was performed to determine the prevalence of polishing across the tibial surface for all implants. The average contact path, predicted from the average knee joint kinematics of the ten subjects, was superimposed on the frequency plots to compare the predicted contact path to the frequency of areas of polishing.
7. Statistical Analysis
Paired t-tests were used to test for differences between SDM and CDM contact path characteristics. Linear regressions and ANOVAs were run to determine if SDM results reliably predict CDM contact path characteristics. Paired t-tests were used to test for differences between wear scars on knee-wear simulator tested components and the calculated contact paths. In all cases, contact path characteristics analyzed were centroid position, AP stretch, and ML stretch in both lateral and medial compartments. AP stretch and ML stretch were defined by the AP and ML length of the box bounding the contact path. All statistical tests were performed with SPSS (IBM Corp., Somers, NY). Significance was set to p<0.05.
Results
The mean age of the ten subjects with TKRs was 65.0 ± 5.3 years at surgery and 77.0 ± 5.7 years at the gait test. Mean TKR in situ time was 11.9 ± 1.1 years. The tibiofemoral contact paths for a sample subject are shown in Figure 5. The CDM and SDM resulted in similar contact pathways that were in close agreement in the AP direction. CDM and SDM were only significantly different for the ML positioning of the medial centroid (p = 0.009, Table 1). Although differences between methods were insignificant, a linear regression was performed to determine how well SDM results predicted CDM results. With alpha = 0.05, AP and ML position of the medial contact path centroid, AP and ML stretch of the lateral contact area, and AP and ML stretch of the medial contact area of the SDM reliably predicted the same variables for the CDM. When multiple independent variables entered the linear regression, the SDM variables of AP and ML stretch of the medial contact area and AP and ML position of the medial contact area reliably predicted the AP stretch of the medial contact area calculated from the CDM (p = 0.015, R2 = 0.883). The same variables on the lateral contact area generated from the SDM predicted the AP stretch of the CDM lateral contact area (p = 0.017, R2 = 0.876).
Figure 5. Sample subject contact path for: The shortest distance method (SDM), and the contour distance method (CDM).
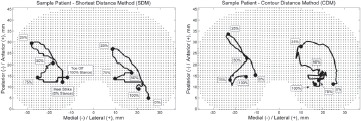
Table 1.
The contact path characteristics were not significantly different between the shortest distance method (SDM) and the contour distance method (CDM) except for the ML-coordinate of the medial centroid. Values are given in mm as mean − SD. The centroids refer to the coordinates of the centroid of the entire contact path. AP and ML stretch refer to the AP and ML length of the box bounding the entire contact path. P values are from paired t-tests.
| SDM | CDM | p | ||||
|---|---|---|---|---|---|---|
| Medial | Lateral | Medial | Lateral | Medial | Lateral | |
| ML Centroid | -20 − 7.7 | 13 − 7.3 | -16 − 4.8 | 14 − 2.4 | 0.009 | 0.92 |
| AP Centroid | 19 − 3.8 | 19 − 9.4 | 20 − 2.5 | 21 − 4.1 | 0.31 | 0.60 |
| ML stretch | 20 − 9.8 | 20 − 9.4 | 22 − 7.6 | 19 − 4.7 | 0.22 | 0.64 |
| AP stretch | 22 − 9.7 | 29 − 11 | 24 − 11 | 28 − 8.2 | 0.15 | 0.71 |
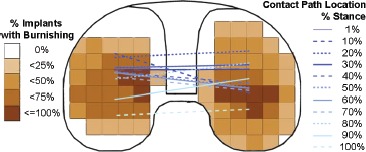
The contact path calculations compared well to the wear scars measured on the simulator tested components (Figure 6, Table 2). The calculated tibio-femoral contact paths and Hertz contact area solutions fell within the wear scars on the tested tibial components. The simulator tested components had an AP stretch of the lateral wear scars that were on average 5 mm longer than that calculated for the Hertz solution from the SDM (p = 0.002). The centroid of the lateral wear scar of the simulator-tested components were on average 3 mm farther lateral than the calculated Hertz solution from the CDM (p = 0.05), and the centroid of the medial wear scar of the simulator tested components were on average 1 mm farther medial than the calculated Hertz solution from the SDM method (p = 0.02). All other measurements were not significantly different. The average contact path compared well to the wear scars of postmortem retrieved tibial plateaus (Figure 7). The prevalence of polishing was 75% to 100% in areas covered by the average contact path.
Figure 6. Results from the SDM contact path calculation (red lines) compared to wear scars on tibial plateaus worn in the simulator (black outline). Green bounding boxes indicate cumulative contact area predicted by a Hertz cylinder-on-flat solution centering at each point of the contact path. Tibial plateaus are mirrored and shown as right-sided implants where medial is to the left and lateral is to the right.
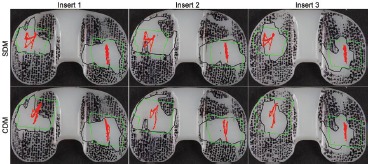
Table 2.
Few significant differences were seen between the contact path characteristics (mean − SD, units mm or mm2) of TKRs tested on a knee simulator and predictions by the shortest distance method (SDM) and the contour distance method (CDM). The centroid coordinates refer to the centroid of the Hertz contact area calculated for the entire contact path. AP and ML stretch refer to the AP and ML length of the box bounding the entire contact path. Centroid coordinates correspond to Figure 2.
| Simulator | SDM Hertz Solution | CDM Hertz Solution | p Simulator-SDM | p Simulator-CDM | ||||||
|---|---|---|---|---|---|---|---|---|---|---|
| Medial | Lateral | Medial | Lateral | Medial | Lateral | Medial | Lateral | Medial | Lateral | |
| ML Centroid | -20 − 1.1 | 18 − 0.8 | -21 − 0.1 | 21 − 0.1 | -19 − 0.3 | 21 − 0.3 | 0.02 | 0.29 | 0.29 | 0.05 |
| AP Centroid | 25 − 1.2 | 17 − 0.8 | 25 − 0.5 | 18 − 0.1 | 27 − 0.8 | 18 − 0.6 | 0.55 | 0.65 | 0.26 | 0.16 |
| ML stretch | 20 − 5.0 | 22 − 3.6 | 19 − 0.1 | 18 − 0.1 | 22 − 0.6 | 20 − 0.5 | 0.19 | 0.73 | 0.58 | 0.26 |
| AP stretch | 22 − 0.50 | 18 − 2.6 | 16 − 0.4 | 17 − 0.6 | 20 − 1.4 | 18 − 1.0 | 0.35 | 0.002 | 0.08 | 0.72 |
| Area | 267 − 65 | 261 − 41 | 240 − 9.8 | 528 − 6.6 | 346 − 25 | 287 − 12 | 0.94 | 0.57 | 0.23 | 0.38 |
Figure 7. Frequency of polishing on 21 postmortem retrieved Miller- Galante II (Zimmer Inc., Warsaw, IN) tibial plateaus overlaid with the contact path predicted from the average knee joint knematics of ten patients with the same implant. Medial-lateral contact path location is neglected on the graph. The medial and lateral contact path points are connected for each instance of the stance phase so that anterior-posterior translation and interior-exterior rotation of the femoral component can be visualized. Tibial plateau shown is right-sided where medial is to the left and lateral is to the right.
Discussion
The tibio-femoral contact pathway is an important parameter for determining knee loading and to estimate areas of contact between the tibial and femoral TKR components. In this study we developed two methods for determining the tibio-femoral contact pathway using marker-based gait analysis, standard radiographs obtained at clinical follow-ups, and point clouds of the TKR components. Both methods developed for predicting the tibio-femoral contact pathway resulted in accurate contact paths as shown by comparisons between the two methods and knee-simulator wear tests, consistent with our hypothesis.
In spite of our methodological rigor, this study was not without limitation. One limitation of the study involves measuring medial-lateral contact path movement. The medial-lateral contact path components, which were better predicted with the CDM than the SDM, are the most difficult to determine because this movement (movement towards the cameras) of the TEA is difficult to measure when all the cameras are on one side. Knee-joint simulators usually use flexion angle, AP translation, internal/ external rotation angle, and axial force as inputs, while ML translation is unconstrained. Thus, the choice of method would not affect the input profile for knee wear simulation.
Another study limitation is the difficulty of registering the knee movements, measured with marker-based gait analysis, to the motion of the TKR components. The iterative process described in this study allowed the contact path to be positioned on the tibial plateau at locations that corresponded to the wear scars measured from retrieved components23. For this study, two or three iterations were enough to match the contact path and wear scar centroids within 0.1 mm. Alternatively, radiographs or CT images that allowed registration between the skin markers and bones could be used with the same iterative process.
The contact paths produced by both methods compared well to the wear scars from components tested on a knee wear simulator, consistent with our hypothesis. Although not significantly different, the areas of the wear scars on the tested components were larger than the area of contact predicted by the Hertz contact solution, and the wear scars had areas of contact on the intercondylar eminence and the edges of the tibial plateau. The tibial components used in the study had been previously placed on the simulator during setup of the tests and have some deformation on the surface, were only tested for a few cycles, and had some scratching during test set-up which could cause the irregular contact. Finally, the ML width of the wear scars on insert 3 is smaller than the width of the femoral condyles. This suggests that the femoral component was slightly out of alignment with the axis of rotation of the simulator, resulting in edge loading and smaller areas of contact. Despite these limitations, Hertzian solutions centered at the SDM- and CDM-produced contact paths were similar to the tested components, lending confidence to our methods.
The predicted average contact path of the ten subjects also compared favorably with wear scars on postmortem retrieved components. Most components (75-100%) showed highly polished areas in regions under the average contact path. Polishing is a surface feature which indicates intended use of the device. Components retrieved postmortem are considered well-functioning implants as they did not require a revision surgery. Hence, wear scars on the tibial inserts are a reflection of patient specific kinematics during activity.
Although both SDM and CDM produced reliable contact paths, a strength of the SDM technique is the simplicity of the method. The SDM technique allows testing of the tibio-femoral contact pathway for large cohorts of patients in clinical laboratories that use gait analysis equipment. The ability to accurately predict the path of contact between tibia and femur is important because of the significant effect of the tibio-femoral contact pathway on calculated knee-joint forces and moments imposed by muscles about the knee-joint.
Conclusions
The tibio-femoral contact pathway during gait can be reliably predicted for TKR patients using subject-specific anatomy, prosthesis geometry, standard radiographs from clinical follow-ups, and three-dimensional relative TKR joint kinematics from marker-based motion analysis. The pathways predicted in this study compared well to wear scars on knee wear simulator-tested components and components retrieved postmortem, indicating that the predicted tibio-femoral contact pathways could be used as an estimate of contact areas between the tibial and femoral TKR components in vivo.
Acknowledgments
This work was supported by grants from the NIH: R03 AR052039 (MAW), R01 AR059843 (MAW), T32 AR052272 (D.R. Sumner), and F32 AR057297 (HJL). Thanks to Martin Hinter and Endolab (EndoLab Mechanical Engineering GmbH, Germany) for performing the wear tests for model validation and to Sheryl Kompancaril for assistance with data analysis.
References
- 1.Lundberg HJ, Foucher KC, Andriacchi TP, Wimmer MA. Direct comparison of measured and calculated total knee replacement force envelopes during walking in the presence of normal and abnormal gait patterns. J Biomech. 2012;45:990–6. doi: 10.1016/j.jbiomech.2012.01.015. [DOI] [PMC free article] [PubMed] [Google Scholar]
- 2.Lundberg HJ, Wimmer MA. The effect of the tibiofemoral contact path centroid location on TKR contact forces [abstract]. Proceedings of the ASME 2010 Summer Bioengineering Conference. 2010 [Google Scholar]
- 3.Banks SA, Hodge WA. 2003 Hap Paul Award Paper of the International Society for Technology in Arthroplasty. Design and activity dependence of kinematics in fixed and mobile-bearing knee arthroplasties. J Arthroplasty. 2004;19:809–16. doi: 10.1016/j.arth.2004.04.011. [DOI] [PubMed] [Google Scholar]
- 4.Dennis DA, Komistek RD, Colwell Jr. CE, Ranawat CS, Scott RD, Thornhill TS, Lapp MA. In vivo anteroposterior femorotibial translation of total knee arthroplasty: a multicenter analysis. Clin Orthop. 1998;356:47–57. doi: 10.1097/00003086-199811000-00009. [DOI] [PubMed] [Google Scholar]
- 5.Dennis DA, Mahfouz MR, Komistek RD, Hoff W. In vivo determination of normal and anterior cruciate ligament-deficient knee kinematics. J Biomech. 2005;38:241–53. doi: 10.1016/j.jbiomech.2004.02.042. [DOI] [PubMed] [Google Scholar]
- 6.Freeman MA, Pinskerova V. The movement of the normal tibio-femoral joint. J Biomech. 2005;38:197–208. doi: 10.1016/j.jbiomech.2004.02.006. [DOI] [PubMed] [Google Scholar]
- 7.Fregly BJ, Sawyer WG, Harman MK, Banks SA. Computational wear prediction of a total knee replacement from in vivo kinematics. J Biomech. 2005;38:305–14. doi: 10.1016/j.jbiomech.2004.02.013. [DOI] [PubMed] [Google Scholar]
- 8.Harman MK, Banks SA, Hodge WA. Polyethylene damage and knee kinematics after total knee arthroplasty. Clin Orthop Relat Res. 2001:383–93. doi: 10.1097/00003086-200111000-00050. [DOI] [PubMed] [Google Scholar]
- 9.Hoff WA, Komistek RD, Dennis DA, Gabriel SM, Walker SA. Three-dimensional determination of femoral-tibial contact positions under in vivo conditions using fluoroscopy. Clin Biomech. 1998;13:455–72. doi: 10.1016/s0268-0033(98)00009-6. [DOI] [PubMed] [Google Scholar]
- 10.Komistek RD, Kane TR, Mahfouz M, Ochoa JA, Dennis DA. Knee mechanics: a review of past and present techniques to determine in vivo loads. J Biomech. 2005;38:215–28. doi: 10.1016/j.jbiomech.2004.02.041. [DOI] [PubMed] [Google Scholar]
- 11.Li G, Suggs J, Hanson G, Durbhakula S, Johnson T, Freiberg A. Three-dimensional tibiofemoral articular contact kinematics of a cruciate-retaining total knee arthroplasty. J Bone Joint Surg Am. 2006;88:395–402. doi: 10.2106/JBJS.D.03028. [DOI] [PubMed] [Google Scholar]
- 12.Scuderi GR, Komistek RD, Dennis DA, Insall JN. The impact of femoral component rotational alignment on condylar lift-off. Clin Orthop Relat Res. 2003;410:148–54. doi: 10.1097/01.blo.0000063603.67412.ca. [DOI] [PubMed] [Google Scholar]
- 13.Stiehl JB, Komistek RD, Dennis DA, Paxson RD, Hoff WA. Fluoroscopic analysis of kinematics after posterior-cruciate-retaining knee arthroplasty. J Bone Joint Surg Br. 1995;77:884–9. [PubMed] [Google Scholar]
- 14.Ngai V, Wimmer MA. Kinematic evaluation of cruciate-retaining total knee replacement patients during level walking: A comparison with the displacement-controlled ISO standard. J Biomech. 2009;42:2363–8. doi: 10.1016/j.jbiomech.2009.06.030. [DOI] [PMC free article] [PubMed] [Google Scholar]
- 15.Andriacchi TP, Alexander EJ, Toney MK, Dyrby C, Sum J. A point cluster method for in vivo motion analysis: applied to a study of knee kinematics. J Biomech Eng. 1998;120:743–9. doi: 10.1115/1.2834888. [DOI] [PubMed] [Google Scholar]
- 16.Dyrby CO, Andriacchi TP. Secondary motions of the knee during weight bearing and non-weight bearing activities. J Orthop Res. 2004;22:794–800. doi: 10.1016/j.orthres.2003.11.003. [DOI] [PubMed] [Google Scholar]
- 17.Churchill DL, Incavo SJ, Johnson CC, Beynnon BD. The transepicondylar axis approximates the optimal flexion axis of the knee. Clin Orthop Relat Res. 1998;356:111–8. doi: 10.1097/00003086-199811000-00016. [DOI] [PubMed] [Google Scholar]
- 18.Eckhoff DG, Bach JM, Spitzer VM, Reinig KD, Bagur MM, Baldini TH, Rubinstein D, Humphries S. Three-dimensional morphology and kinematics of the distal part of the femur viewed in virtual reality. Part II. J Bone Joint Surg Am. 2003;85-A(Suppl 4):97–104. doi: 10.2106/00004623-200300004-00012. [DOI] [PubMed] [Google Scholar]
- 19.Lloyd DG, Besier TF. An EMG-driven musculoskeletal model to estimate muscle forces and knee joint moments in vivo. J Biomech. 2003;36:765–76. doi: 10.1016/s0021-9290(03)00010-1. [DOI] [PubMed] [Google Scholar]
- 20.Hollister AM, Jatana S, Singh AK, Sullivan WW, Lupichuk AG. The axes of rotation of the knee. Clin Orthop Relat Res. 1993:259–68. [PubMed] [Google Scholar]
- 21.Elias SG, Freeman MAR, Gokcay EI. A correlative study of the geometry and anatomy of the distal femur. Clin Orthop Relat Res. 1990:98–103. [PubMed] [Google Scholar]
- 22.Asano T, Akagi M, Nakamura T. The functional flexion-extension axis of the knee corresponds to the surgical epicondylar axis: in vivo analysis using a biplanar image-matching technique. J Arthroplasty. 2005;20:1060–7. doi: 10.1016/j.arth.2004.08.005. [DOI] [PubMed] [Google Scholar]
- 23.Paul P. Chicago, IL: University of Illinois at Chicago; 2004. Differences in polyethylene wear of revised, autopsy retrieved and simulator tested tibial knee implants [dissertation]. [Google Scholar]
- 24.Duan CY, Espinoza Orías AA, Shott S, An HS, Andersson GBJ, Hu JZ, Lu HB, Inoue N. In vivo measurement of the subchondral bone thickness of lumbar facet joint using magnetic resonance imaging. Osteoarthritis Cartilage. 2011;19:96–102. doi: 10.1016/j.joca.2010.10.015. [DOI] [PMC free article] [PubMed] [Google Scholar]
- 25. ISO 14243-1. Implants for surgery -- wear of total knee-joint prostheses -- part 1: loading and displacement parameters for wear-testing machines with load control and corresponding environmental conditions for test. 2009 ISO 14243-1. [Google Scholar]
- 26.Ugural AC, Fenster SK. anonymous advanced strength and applied elasticity. Vol. 135. Upper Saddle River, New Jersey: Prentice-Hall, Inc.; 1994. Advanced strength and applied elasticity. Third ed. [Google Scholar]
- 27.Kurtz SM. Amsterdam: Elsevier/Academic Press; 2009. UHMWPE biomaterials handbook: ultra high molecular weight polyethylene in total joint replacement and medical devices. Second ed. [Google Scholar]


