

Abstract
Human erythrocyte glucose sugar transport was examined in resealed red cell ghosts under equilibrium exchange conditions ([sugar]intracellular = [sugar]extracellular). Exchange 3-O-methylglucose (3MG) import and export are monophasic in the absence of cytoplasmic ATP but are biphasic when ATP is present. Biphasic exchange is observed as the rapid filling of a large compartment (66% cell volume) followed by the slow filling of the remaining cytoplasmic space. Biphasic exchange at 20 mM 3MG eliminates the possibility that the rapid exchange phase represents ATP-dependent 3MG binding to the glucose transport protein (GLUT1; cellular [GLUT1] ≤ 20 μM). Immunofluorescence activated cell sorting analysis shows that biphasic exchange does not result from heterogeneity in cell size or GLUT1 content. Nucleoside transporter mediated uridine exchange proceeds as rapidly as 3MG exchange but is monoexponential regardless of cytoplasmic [ATP]. This eliminates cellular heterogeneity or an ATP-dependent, nonspecific intracellular diffusion barrier as causes of biphasic exchange. Red cell ghost 3MG and uridine equilibrium volumes (130 fL) are unaffected by ATP. GLUT1 intrinsic activity is unchanged during rapid and slow phases of 3MG exchange. Two models for biphasic sugar transport are presented in which 3MG must overcome a sugar-specific, physical (diffusional) or chemical (isomerization) barrier to equilibrate with cell water. Partial transport inhibition using cytochalasin B or maltose depresses both rapid and slow phases of transport thereby eliminating the physical barrier hypothesis. We propose that biphasic 3MG transport results from ATP-dependent, differential transport of 3MG anomers in which Vmax/Km(app) for β-3MG exchange transport is 19-fold greater than Vmax/Km(app) for α-3MG transport.
INTRODUCTION
A family of integral membrane proteins called glucose transporters (GLUTs) (40) mediates equilibrative sugar transport in mammalian cells. The glucose transport protein, GLUT1, catalyzes sugar transport in cells of the reticulo-endothelial system (7, 61) and presents an interesting experimental puzzle. The steady-state kinetics of GLUT1-mediated sugar transport in rabbit (70), rat (38, 62) and avian (7, 8) erythrocytes and in basal (insulin-starved) rat adipocytes (76) are consistent with classical models for carrier-mediated solute transport (5, 47). GLUT1-mediated sugar transport in human red cells, however, displays a kinetic complexity that has proven difficult to reconcile with models for carrier mediated transport (4, 21, 32, 49, 56, 79).
Transport complexity is especially obvious in zero-trans exit and infinite-cis entry conditions (13). In the zero-trans exit condition, cells are loaded with various starting sugar concentrations and the initial rate of exit is measured (49, 56) or the complete time course of exit is analyzed by using an integrated Michaelis-Menten equation (4, 16, 42, 56). Initial rate measurements (49, 56) routinely provide estimates of Km(app) for sugar exit that are 2- to 3-times lower than those obtained by analysis of the complete time-course of sugar exit (4, 16, 42, 56). In the infinite-cis sugar uptake experiment, the external sugar level is saturating and the concentration of intracellular sugar that reduces net sugar uptake by one-half is measured. Km(app) for infinite-cis entry is routinely 5- to 10-fold lower than the value predicted by classical carrier models for sugar transport (13, 14, 21, 22).
Why is it that human red cell sugar transport displays kinetic complexity while GLUT1-mediated sugar transport in rabbit, rat and avian erythrocytes and in rat adipocytes is consistent with sugar transport models? Human, rat and rabbit GLUT1 share 98.4% identity (3, 7, 61). Six common residues in rabbit and rat GLUT1 diverge from human GLUT1 sequence but all 6 substitutions show positive scores on the point accepted mutation similarity scale (1) suggesting that each substitution is unlikely to affect structure or function. If sequence divergence is not the cause of transport complexity, GLUT1 phenotypic variation must result from differences in cellular environment, GLUT1 expression levels or artifacts of measurement.
The sugar transport capacity of human red cells is 220- to 10,000-fold greater than that of rat basal adipocytes (76), rat red cells (38) and avian erythrocytes (24). Naftalin and Holman (63) have discussed several ways by which this could give rise to transport complexity. 1) Transport measurements in human red cells are technically challenging even at low temperatures owing to the very high GLUT1 density of human red cells and the high catalytic turnover of GLUT1 (49). Significant backflux of imported sugar during the course of a transport determination would lead to underestimation of net import. 2) If net cellular sugar import were comprised of two steps - transport followed by intracellular diffusion/distribution - the diffusional step could become rate-limiting if the transport step were sufficiently rapid. Evidence for non-uniform intracellular distribution of sugars has been obtained in both human and rat erythrocytes (4, 36, 38, 62, 64).
According to the diffusional barrier hypothesis, human red cell net sugar import is comprised of rapid transport (owing to high cellular GLUT1 content) and slow intracellular diffusion/distribution. The overall result is one where net sugar import is rate-limited by intracellular diffusion/distribution not by transport. Measurements of sugar uptake in rat or rabbit erythrocytes, however, largely reflect low capacity GLUT1-mediated transport and thus provide a more accurate description of the intrinsic properties of GLUT1.
This hypothesis infers that GLUT1-mediated sugar transport is inherently simple but that operational complexity is caused by factors extrinsic to the transport system. Transport complexity is lost in cytosol-depleted human red cell ghosts (16, 20, 37, 41) but is preserved if ATP is included in artificial cytosol during red cell ghost resealing (12, 37). Does this mean that human GLUT1 is uniquely ATP-sensitive? Human GLUT1 is an ATP-binding protein (15, 22) and contains three sequence motifs that form the ATP-binding pocket of human adenylate kinase (27). One of these domains (GLUT1 residues 332–338) has been identified by peptide mapping, by micro-sequencing of proteolyzed, azidoATP-photolabelled human GLUT1 (43) and by scanning alanine mutagenesis (44) as a domain critically involved in nucleotide-GLUT1 interaction. This domain is unchanged in rabbit and rat GLUT1 sequence where there is no a priori reason to assume that it does not serve a similar function. It is not known, however, whether rabbit or rat red cell sugar transport are modulated by altered intracellular ATP. Parental (hamster) and exogenous (human) GLUT1-mediated sugar transport are insensitive to cellular ATP-depletion in CHO cells (22, 44) while ATP-sensitive, human GLUT1-mediated sugar transport is observed in transfected HEK cells (22, 44) and in Clone 9 cells (73). This suggests that cellular environment influences GLUT1 phenotype.
These observations stimulate two questions. 1) Is human red cell sugar transport complexity an artifact of measurement? 2) If complexity is real, do human erythrocytes, Clone 9 and HEK cells uniquely express cellular factors that partner in ATP-modulation of sugar transport? We address the former question in the present study. Human red cell membrane GLUT1 content approaches 10% total protein by mass (36) resulting in extremely rapid sugar transport rates at all temperatures studied (8). Measurements of transport are, therefore, complicated by the necessity for rapid sampling procedures (8, 49) but may be simplified by use of the equilibrium exchange condition(77). In equilibrium exchange, intracellular [sugar] = extracellular [sugar], no net transport occurs and unidirectional sugar fluxes are measured by addition of radio-tracer sugar either to the external or internal media. In principle, radio-tracer fluxes under these conditions are first order and thus mono-exponential in a uniform population of cells. We have used this condition to investigate whether sugar transport in red cells reflects the properties of transmembrane sugar flux alone or whether steps subsequent to transmembrane flux also contribute to overall transport behavior.
MATERIALS AND METHODS
Materials
[3H]-3-O-methylglucose, [14C]-3-O-methylglucose, [3H]-uridine, and [14C]-uridine were purchased from Sigma Chemicals. Rabbit antisera raised against a synthetic carboxyl–terminal peptide of GLUT1 (C-Ab) were obtained from East Acres Biologicals. Sheep antisera raised against tetrameric GLUT1 (δ-Ab) were prepared as described previously (34). Fluorescein-conjugated goat anti-rabbit Ab was purchased from Molecular Probes. Fluorescein-conjugated goat anti-sheep Ab was purchased from Calbiochem. Human blood was purchased from Biological Specialties Cooperation. Other reagents were purchased from Sigma Chemicals.
Solutions
Kaline consisted of 150 mM KCl, 5 mM MgCl2, 5 mM EGTA, 5mM HEPES, pH 7.4. Lysis buffer contained 10 mM Tris-HCl, 2mM EDTA, pH 8.0. Stripping solution contained 2 mM EDTA, 15.4 mM NaOH, pH 12. Sugar-stop solution consisted of ice-cold Kaline containing 20 μM CCB and 200 μM phloretin. Uridine-stop solution consisted of ice-cold Kaline containing 50 μM S-nitrothioinosine.
Red Cells
Red cells were isolated by washing whole human blood in 4 or more volumes of ice-cold Kaline and centrifuging at 10,000 x g for 15 minutes at 4 °C. Serum and buffy coat were removed by aspiration and the wash, centrifugation, aspiration cycle repeated until the buffy coat was no longer visible. Cells were resuspended in 4 volumes of sugar free or sugar containing Kaline and incubated for 1 hour at 37 °C to deplete or load intracellular sugar.
Red Cell Ghosts
Ghosts were hypotonically lysed by re-suspending washed red cells in 10 volumes of ice-cold lysis buffer for 10 minutes. Membranes were harvested by centrifugation at 27,000 x g for 20 minutes. Ghosts were repeatedly washed with lysis buffer and centrifuged until the membranes appeared light pink (about 3 cycles). Ghosts were then washed with 10 volumes ice-cold Kaline and collected by centrifugation at 27,000 x g. Harvested membranes were resealed by incubation in 4 volumes of Kaline ± 4 mM ATP (37 °C) for 1 hour and collected by centrifugation at 27,000 x g for 15 minutes at 4 °C. Resealed ghosts were stored on ice until used.
Net 3-O-methylglucose uptake
Sugar-depleted cells or ghosts were incubated in 20 volumes of ice-cold Kaline containing 100 μM unlabeled 3MG and 0.5 μCi/mL labeled 3MG. Uptake was allowed to proceed for intervals as short at 6 seconds to intervals as long as 3 hours. Uptake was arrested by addition of ice-cold stop buffer and ghosts were centrifuged at 14,000 x g for 1 minute. The supernatant was removed by aspiration and ghosts were washed with 20 volumes of sugar stop buffer, re-centrifuged and supernatant aspirated. The ghost pellet was extracted with 500 μL of 3% perchloric acid, centrifuged, and samples of the clear supernatant were counted in duplicate. Zero time points were collected by the addition of sugar stop solution to ghosts followed by uptake media. Samples were then immediately processed. Radioactivity associated with cells at zero time was subtracted from all non-zero time points. Equilibrium time points were collected using an overnight incubation. All time points were normalized to the equilibrium time point. All solutions and tubes used in the assay were pre-incubated on ice for 30 minutes prior to the start of the experiment. Triplicate samples were processed for each time point.
Initial rate, zero-trans 3-O-methyl-glucose uptake - time dependence
Sugar-depleted cells or ghosts were allowed to rest in 20 volumes of ice-cold Kaline for intervals as short as 30 seconds or as long as 3 hours. Thirty seconds prior to the end of the rest interval, a small volume of 3MG and 0.5 μCi/mL tracer 3MG were added to the suspension to a final [3MG] of 100 μM. Uptake was stopped by addition of sugar stop solution and cells or ghosts were processed as above. A zero time point was obtained as described above. An equilibrium time point was obtained by allowing ghosts to uptake unlabeled and labeled 3MG overnight at 4 °C. Uptake rates were expressed as μmol/(min.L cell water) by subtracting the zero time point and normalizing to the equilibrium time point.
3-O-methylglucose equilibrium exchange, uptake and exit
Ghosts were resealed in the presence of 0.1, 2.5, 10 or 20 mM unlabeled 3MG and trace amount (0.5 μCi/mL) of 14C-3MG, centrifuged, and the supernatant was aspirated. Ghosts were then incubated in 20 volumes of ice-cold Kaline containing the same concentration of 3MG and 0.5 μCi/mL 3H-3MG. Exchange was allowed to proceed for time intervals as short as 6 seconds to intervals as long as 10 hours. Exchange was then stopped by the addition of ice-cold sugar stop and ghosts were treated as above with zero-trans uptake.
Uridine equilibrium exchange, uptake and exit
Experiments were performed as with 3MG equilibrium exchange except that the transport substrate was Urd and uridine stop was used to stop the reaction and to wash the ghosts.
GLUT1 Immunofluorescence microscopy and FACS analysis
For C-Ab immunofluorecence staining, 50 μL of non-fixed unsealed ghosts were washed once in ice-cold Kaline, centrifuged at 4 °C, and the supernatant aspirated. 1:500 dilution of C-Ab was added to the pellet and the suspension was incubated at 4 °C for 2 hours, centrifuged and supernatant aspirated. Ghosts were washed with ice-cold Kaline. Secondary antibody (1:500 dilution) was added to the pellet and the suspension was incubated at 4 °C for 1 hour, centrifuged and supernatant removed by aspiration. Ghosts were washed 5 times with ice-cold Kaline and brought to a final volume of 500 μL. For δ-Ab staining, resealed ghosts are incubated with a 1:500 dilution of δ-Ab at 37 °C for 1 hour, and then processed as above. For microscopy, 10 μL of the suspension was added to a poly-lysine coated cover slip and adhered by low speed centrifugation. Cover slips were washed 5 times with 10 mL of ice-cold Kaline. Fluorescence microscopy was performed on an Olympus BX-51 fluorescence microscope. For FACS analysis, 50 μL of the immunofluorescence stained ghosts were mixed with ~1 mL of FACS buffer in a FACS sample tube. FACS analysis was performed using a Becton Dickinson FACS Scan sampled for 10,000 counts and analyzed with Cell Quest 3.3.
Ghost accessible volumes
Ghosts were prepared and resealed with and without intracellular ATP. After resealing, 2.5 mM 3MG or Urd and tracer 3H-3MG or 3H-Urd and 14C-sucrose were added to the ghosts and the radio-tracers were allowed to equilibrate with cell water. The samples were centrifuged at 14000 x g for 1 minute and known volumes of supernatant and pellet were sampled and counted for both isotopes. Ghosts were counted on a hemocytometer. Tracer accessible volume (Vacc) was calculated as:
| (1 |
where 14C and 3H refer to the respective dpms, V is the sample volume, and S and P refer to supernatant and pellet. In this manner, the extracellular volume of the pellet is subtracted by measuring the sucrose space. Alternatively, ghosts were resealed with 2.5 mM 3MG and 2.5 mM Urd plus 3H-3MG and 14C-Urd or 14C-3MG and 3H-Urd radio-tracers. At 0 and 15 hours post resealing, ghosts were sedimented by centrifugation and the supernatant was sampled. The ghost pellets were washed twice with 20 μM CCB, 200 μM phloretin, and 50 μM S-nitrothioinosine in ice-cold Kaline. Known volumes of supernatant and pellet were counted for 3MG and Urd and pellet to supernatant ratios were computed.
Red cell and ghost electron microscopy
Scanning Electron Microscopy of red cells and ghosts was carried out as previously described (35). RBCs and Ghost cells were fixed by immersion in 2.5% (v/v) glutaraldehyde in 0.5 M Na Phosphate buffer (pH 7.2) for 1 hr at room temperature. Fixed samples were then washed three times in the same buffer. Following the third wash the cells were post fixed for 1 hr in 1% osmium tetroxide (w/v) in the phosphate buffer, washed 3X in buffer and left overnight at 4° C. Samples were dehydrated through a graded series of ethanol to 100% and then the bottoms of the tubes were excised, place in porous sample holders and Critical Point Dried in liquid CO2. After drying, tubes were emptied onto aluminum SEM stubs coated with adhesive carbon tape. The edges were then painted with silver conductive paste and the SEM stubs were sputter coated with Au/Pd (80/20). The specimens were then examined using an ETEC autoscan scanning electron microscope at 20 Kv accelerating voltage.
Circular Dichroism
Freshly dissolved α-3MG or equilibrium solutions of 3MG (each 20 mM) were prepared in kaline and the circular dichroism of the sugar was monitored. Data were collected at 4 °C using a Jasco J-810 spectropolarimeter and a 0.1 cm pathlength cuvette.
Proton NMR
Data were collected at 24 °C on a 400 MHz Oxford NMR.
Curve fitting procedures
Where appropriate, data sets were analyzed by nonlinear regression using the software packages proFit (version 6.06; Quantum Soft, Uetikon am See, Switzerland) or Igor-Pro (version 5, Wavemetrics, Lake Oswego, OR). Numerical Integration was perfomed by using Berkeley Madonna X (version 8.3.14).
RESULTS
The effect of ATP on 3-O-methylglucose equilibrium exchange transport
The effect of intracellular ATP on equilibrium exchange 3MG transport at 4 °C was monitored over the course of five hours by measuring the simultaneous uptake of tracer [3H]-3MG and exit of [14C]-3MG (Figure 1). Resealed ghosts lacking intracellular ATP show an exchange time course that follows a single, simple exponential rise or decay for uptake and exit respectively. This is expected for a passive transport process characterized by a single rate limiting step and occurring in a uniform population of cells. When ghosts are resealed with 4 mM intracellular ATP, however, the time course changes - becoming biphasic for both unidirectional uptake and exit. The early phase of transport is accelerated 4-fold in the presence of ATP. After 10 minutes when one-half to two-thirds of unidirectional exchange is complete, the rate of transport declines by more than 10-fold to a rate approaching 2-fold slower than transport in the absence of ATP. Table 1 summarizes fit parameters for ghosts lacking and containing ATP. Equilibrium exchange time courses have been studied previously by this laboratory but biphasic transport was observed only at the lowest [3MG] employed (0.1 mM [3MG]; (23)) where biphasic exchange may be related to GLUT1 sugar binding. Those studies did not monitor transport beyond 5 minutes which explains why biphasic equilibrium exchange transport at higher [3MG] was not observed.
Figure 1.

Time-course of 3-O-methylglucose equilibrium exchange uptake and exit in red cell ghosts containing or lacking intracellular ATP. Ordinate: fractional equilibration; Abscissa: time in minutes (note log scale). A Exchange of 2.5 mM 3MG in red cell ghosts resealed without intracellular ATP. Uptake (●) follows a single exponential rise and exit (○) follows a single exponential decay. Solid curves drawn through the points are computed by nonlinear regression and take the forms: (1−e−kt) for uptake and e−kt for exit where k is the observed rate constant. The dashed lines show the least squares computed fits for uptake and exit (equation 3) where Km(app) for uptake and exit are 38.8 and 38.2 mM respectively and Vmax for uptake and exit are 3.65 and 4.07 mmol/L/min respectively. B Exchange of 2.5 mM 3MG in red cell ghosts resealed with 4 mM intracellular ATP. Uptake (●) and exit (○) follow bi-exponential kinetics. Solid curves drawn through the points are computed by nonlinear regression of the form: A(1−e−k1 t)+(1−A)(1−e−k2t) for uptake and A(e−k1 t)+(1−A)(e−k2 t) for exit where k1 is the observed rate constant for the fast phase, k2 is the slow phase rate constant, and A is the fractional component of total uptake or exit described by the fast phase. Values of k, A, k1, and k2 are shown in Table 1. The dashed lines show the least squares computed fits for uptake and exit (equation 2) where Km(app) for uptake and exit of α-3MG are 37.1 and 24.8 mM respectively and Vmax for uptake and exit of α-3MG are 0.79 and 1.42 mmol/L/min respectively. Km(app) for uptake and exit of β-3MG are 4.7 and 3.0 mM respectively and Vmax for uptake and exit of β-3MG are 2.41 and 2.88 mmol/L/min respectively.
Table 1.
Effect of Substrate Concentration and ATP on Rate Constants and Components of 3MG Equilibrium Exchange
| [3MG] | − ATP | + ATP | ||||||
|---|---|---|---|---|---|---|---|---|
| kobs a | fast kobs a | slow kobs a | fast component sizeb | |||||
| Uptake | Exit | Uptake | Exit | Uptake | Exit | Uptake | Exit | |
| 100 μM | 0.168 ± 0.010 | 0.132 ± 0.010 | 0.357 ± 0.043 | 0.671 ± 0.070 | 0.012 ± 0.004 | 0.040 ± 0.005 | 0.722 ± 0.039 | 0.575 ± 0.032 |
| 2.5 mM | 0.090 ± 0.004 | 0.100 ± 0.004 | 0.372 ± 0.019 | 0.392 ± 0.007 | 0.015 ± 0.002 | 0.018 ± 0.005 | 0.651 ± 0.018 | 0.819 ± 0.005 |
| 10 mM | 0.104 ± 0.004 | 0.109 ± .004 | 0.320 ± 0.013 | 0.287 ± .007 | 0.012 ± 0.001 | 0.026 ± 0.001 | 0.681 ± 0.014 | 0.768 ± 0.005 |
| 20 mM | 0.098 ± 0.008 | 0.122 ± 0.006 | 0.386 ± 0.050 | 0.167 ± 0.012 | 0.025 ± 0.003 | 0.009 ± 0.001 | 0.468 ± 0.038 | .708 ± 0.026 |
| mean ± SEM | 0.115 ± 0.018 | 0.116 ± 0.007 | 0.359 ± 0.014 | 0.379 ± 0.108 | 0.016 ± 0.003 | 0.023 ± 0.007 | 0.631 ± 0.056 | 0.369 ± 0.056 |
All rate constants are first order and have units of min−1 and are shown as mean ± SEM.
Fast component size represents the size (fraction of total 3MG accessible space) of the exchange transport component described by the fast rate constant and is shown as mean ± SEM. The size of the component described by the slow rate constant is 1 - fast fractional size.
One explanation for biphasic transport in the presence of ATP is that a significant sub-population of ghosts spontaneously reseal before ATP is introduced so that the measurements sample a mixed population of ATP containing (fast) and ATP lacking (slow) ghosts. This simple hypothesis is refuted by the observation that the slow phase of 3MG transport in ATP-containing ghosts is more than twice as slow at transport in ATP-free ghosts.
Red cell ghosts present a relatively uniform population of cell sizes and GLUT1 contents
A mixed population of ghost cell sizes or GLUT1 content could account for biphasic 3MG exchange transport. As cell size decreases, the surface area : volume ratio increases thereby increasing the rate of GLUT1-mediated equilibration of radio-tracer sugar. Altered GLUT1 content (or activity) at the membrane surface also determines the rate constant for radio-tracer equilibration.
GLUT1 content was assayed by immunofluorescence microscopy of fixed or living cells and by fluorescence activated cell sorting (FACS). Figures 2A–C show fluorescence micrographs of ghosts stained with antibodies directed to cytoplasmic (Figure 2A) or extracellular (Figure 2B, C) GLUT1 epitopes. The use of cytoplasmic-epitope directed antibodies (C-Ab) necessitates cell fixation/permeabilization. FACS analysis of GLUT1 staining by exofacial antibodies (δ-Ab) suggests a uniform population of cells ± ATP (Figure 2E). C-Ab staining of unsealed ghosts ± ATP produces similar results (data not shown). Cell size was quantified by FACS analysis of single cell light scattering. Ghosts show a single population of scattering intensities as detected at either low (data not shown) or high angles (Figure 2D) and scattering is independent of cytoplasmic [ATP].
Figure 2.
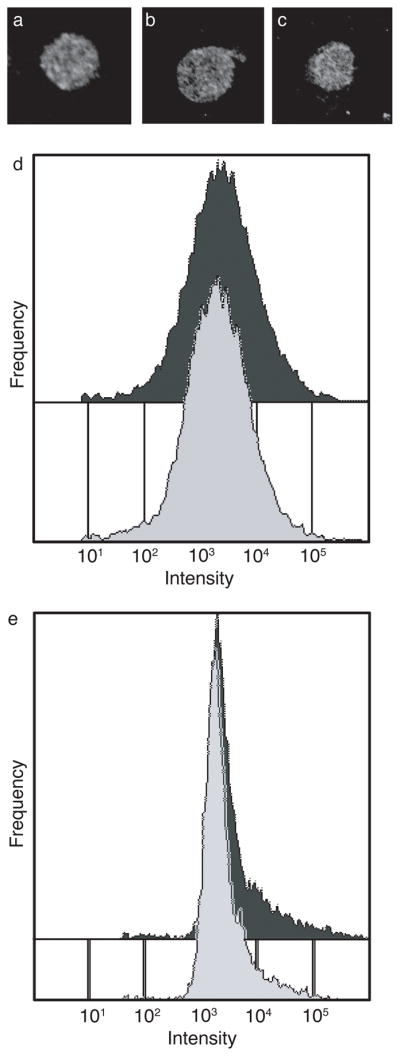
Effect of intracellular ATP on ghost size and GLUT1 content. Immunofluorescence labeling and microscopy of A fixed and permeabilized red blood cells stained with C-Ab. B Living, non-fixed ghosts resealed without ATP and stained with δ-Ab. C Living non-fixed ghosts resealed with 4 mM ATP stained with δ-Ab. D FACS analysis (large angle light scattering) was used to assay ghost size in cells lacking (light grey) or containing (dark grey) intracellular ATP. E GLUT1 content was measured by FACS analysis of δ-Ab staining. For D and E; Ordinate: number of cells; Abscissa: Intensity of signal (note log scale).
The effect of ATP on ENT1-mediated uridine exchange transport
Previous models have rationalized sugar transport complexity by hypothesizing an unstirred layer beneath the red cell membrane (4, 62, 63). While predicted deviations from simple Michaelis-Menten kinetics at low [3MG] are observed for sugar exit in human and rat red cells (36, 38), direct evidence for this unstirred layer is not available.
ENT1-mediated uridine transport was examined in order to determine whether the putative unstirred layer is sugar transport specific. Figure 3 shows the time course of 2.5 mM uridine exchange in ghosts ± ATP. Although there are 100-fold fewer nucleoside transporters per red cell than there are glucose transporters, Km for Urd transport is approximately 100-times lower than Km(app) for GLUT1-mediated 3MG transport(44). The apparent rate-constant for transport of any species, k, is proportional to the ratio Vmax/Km(app) (75) hence sugar and Urd transport proceed at similar rates. Uridine uptake and exit are monoexponential in ghosts regardless of cellular ATP content (Figure 3). If an intracellular unstirred layer/diffusional barrier does exist, it must be selective for GLUT1 substrates. Monophasic uridine exchange transport in ghosts lacking and containing ATP also argues against multiple cell sizes in resealed ghosts.
Figure 3.

Time-course of Uridine equilibrium exchange uptake and exit with and without intracellular ATP. Ordinate: fractional equilibration; Abscissa: time in minutes (note log scale). A Exchange of 2.5 mM Urd in red cell ghosts resealed without intracellular ATP. B Exchange of 2.5 mM 3MG in red cell ghosts resealed with 4 mM intracellular ATP. Uptake (●) follows a single exponential rise and exit (○) follows a single exponential decay. Curves drawn through the points are computed by nonlinear regression and take the forms: (1−e−kt) for uptake and e−kt for exit where k is the observed rate constant. The measured means ± SEM are: A (0 ATP) - uptake, k = 0.079 ± 0.004; exit, k = 0.071 ± .004; B (4 mM ATP) - uptake, k = 0.076 ± 0.005; exit, k = 0.065 ± 0.005.
Effect of intracellular ATP on accessible sugar and uridine volumes
Table 2 summarizes two experiments in which the intracellular 3MG and Urd spaces of red cell ghosts were measured in the absence and presence of 4 mM intracellular ATP. 3MG and Urd spaces are identical and are unaffected by inclusion of 4 mM ATP during resealing. Differences between experiments may result from cell counting errors caused by low contrast of red cell ghosts in the hemocytometer. As transport experiments span several hours, the time-dependence of cell volumes was also investigated. The normalized internal to external ratios of [3MG] and [Urd] ± ATP at 0 and 15 hours are shown in Figure 4. There is no change in the accessible volume over that time.
Table 2.
Effect of ATP on Substrate Accessible Internal Volumea
| Substrate | 0 ATP | + ATP |
|---|---|---|
| 3-O-methylglucose | 134 ± 8b, 100 ± 8c | 129 ± 5b, 81 ± 6c |
| Uridine | 133 ± 13b, 98 ± 9c | 133 ± 7b, 77 ± 4c |
Volume measured in fL and shown as mean ± SEM.
Experiment 1
Experiment 2
Figure 4.

Effect of time on accessible 3-O-methylglucose (▮) and uridine (▮) volumes of ghosts lacking or containing 4 mM ATP. Ordinate; accessible volume normalized to uridine; Abscissa: key indicating the time of measurement and cellular ATP content. Results are shown as mean ± SEM of triplicate measurements.
Effect of pre-incubation time on initial rates and time-courses of transport
We have found that ATP levels are reduced by approximately 50% during the 5 hours of an exchange time course experiment (data not shown). While AMP and ADP do not directly affect transport, they serve as competitive inhibitors of ATP binding to GLUT1(15). It is possible, therefore, that nucleotide dependent changes in GLUT1 intrinsic activity occur during the time course of our measurements. To examine this possibility, both the time-course of net 3MG uptake (Fig 5A) and the instantaneous rate of 3MG uptake (Fig 5B) were measured in ATP-free and ATP-containing ghosts before and after 5 hours of mock (sugar free) transport. Figure 5A shows that ATP-modulation of zero-trans uptake persists after 5 hours. No change in the instantaneous (initial) rate of zero-trans 3MG uptake is observed following 5 hours (Figure 5B). Biphasic exchange transport persists in ghosts that have previously exchanged 3MG for 15 hours prior to being assayed for radio-tracer exchange (Figure 5C). These data indicate that time-dependent changes in the intrinsic activity of GLUT1 do not account for biphasic sugar transport.
Figure 5.

Effect of time on initial rates of transport and equilibrium exchange time-course. A Zero-trans uptake of 100 μM 3MG in red cell ghosts resealed with (●) and without (○) intracellular ATP and permitted to rest in 20 volumes of ice-cold Kaline for 5 hours. Ordinate: fractional equilibration; Abscissa: time in minutes. Curves drawn through the points were computed by nonlinear regression to assuming the bi-exponential form: A(1−e−k1t)+(1−A)(1−e−k2t) where k1 and k2 are the observed rate constants for phase 1 and 2 respectively and A is the fractional component of total uptake described by phase 1. In the absence of ATP, A = 0.12 ± 0.03, k1 = 2.6 ± 1.5 min −1 and k2 = 0.06 ± 0.01 min−1. In the presence of ATP, A = 0.43 ± 0.03, k1 = 2.2 ± 0.3 min−1 and k2 = 0.10 ± 0.01 min−1 B Time dependence of initial rates of zero-trans uptake plus (■) and minus (□) ATP. Ghosts were allowed to rest in Kaline for a specific time following which a small volume of 3MG to make a final concentration of 100 μM was added and the initial rate of transport was measured over a 30 second interval. Ordinate: uptake rate in μmol .min−1.(L cell water) −1; Abscissa: Time of pre-incubation prior to measurement of uptake rate. C Time-course of 2.5 mM 3MG equilibrium exchange in the presence of 4 mM intracellular ATP measured immediately after resealing (○) or following 12 hours of unlabeled 3MG equilibrium exchange (●). Curves were drawn by nonlinear regression assuming exchange is described by A(1−e−k1t)+(1−A)(1−e−k2t) where k1 and k2 are the respective rate constants for phase 1 and 2, and A is the fraction of uptake described by phase 1. The results are: Control, A = 0.72 ± 0.03, k1 = 0 .372 ± 0.054 min−1, and k2 = 0.017 ± 0.007 min−1, χ2 = 0.011; 12 hours post control, A = 0.59 ± 0.07, k1 = 0 .411 ± 0.116 min−1, and k2 = 0.032 ± 0.013 min−1, χ2 = 0.023.
ATP modulation of red cell ghost morphology
Red cells and ghosts containing or lacking ATP were examined by scanning electron microscopy. Figure 6 shows the morphological changes induced by ATP depletion. Red cell membranes become spherical and highly crenated following ghosting in the absence of ATP. Ghost resealing in the presence of Mg·ATP reverses this effect.
Figure 6.
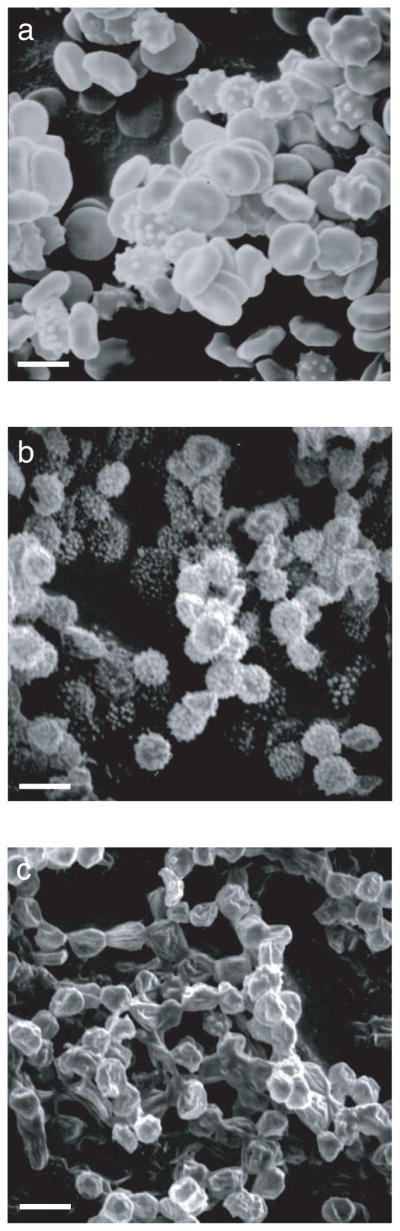
Effect of intracellular ATP on ghost size and shape. Scanning electron microscopy of A red blood cells, B resealed ghosts lacking ATP, and C resealed ghosts containing 4 mM intracellular ATP. The white bar in each frame is 5 μm.
DISCUSSION
Human erythrocyte sugar transport displays a kinetic complexity that is not explained by available models for carrier-mediated facilitated diffusion (4, 21, 32, 49, 57, 79). Rat, rabbit and pigeon erythrocyte sugar transport are, by contrast, compatible with carrier models (38, 62, 70, 74). Several factors suggest that human RBC sugar transport complexity is directly attributable to the very high GLUT1 content of human erythrocytes which, because the resulting sugar transport is extremely rapid, contributes to inaccuracies in sugar flux determinations (4, 14, 63). Studies with resealed erythrocyte ghosts further suggest that cytosolic factors contribute to transport complexity (11, 12, 16, 37).
Naftalin (63) proposed that an unstirred layer at the cytosolic surface of the membrane would increase Km(app) for rapid sugar exit because, during the course of an experiment, the concentration of sugar beneath the membrane falls more precipitously than total intracellular sugar. Evidence for an unstirred layer comes from three sources. Net 3MG uptake in human RBCs displays biphasic kinetics suggesting rapid equilibration with an unstirred layer and slower equilibration with bulk cytosol (23). Steady-state sugar exit in human red cells deviates from Michaelis-Menten kinetics at low intracellular [sugar] in a way that is characteristic of an intracellular unstirred layer (10, 28). Counterflow experiments in rat red cells suggest a non-uniform distribution of unlabeled and labeled sugars within the cell (38, 62).
The unstirred layer hypothesis was modified following the discovery of an ATP-dependent, high affinity GLUT1 sugar binding site (36) which, it was hypothesized, might also explain biphasic sugar uptake. Sugar translocation and subsequent binding at an endofacial GLUT1 domain account for the fast phase of transport. The slower phase of transport was ascribed to slow release into cytosol - a process limited by a diffusional barrier or cage formed by endofacial GLUT1 domains (C-terminus and cytoplasmic loop-6). While delayed within the cage, the probability of sugar re-association with the exit site and translocation back to interstitium is high. The net effect is reduced net sugar import. This model predicts that the size of the fast transport component in any cell is proportional to [GLUT1]. Transport complexity, however, should be independent of cellular [GLUT1] because diffusionally restricted sugar release results from properties intrinsic to each GLUT1 molecule. The nominal “absence” of transport complexity in rat, rabbit and avian RBCs refutes this hypothesis.
To eliminate complexities inherent to zero-trans experiments, we measured transport under equilibrium exchange conditions where no net change in [sugar] occurs. Several studies have examined GLUT1-mediated sugar equilibrium exchange in detail. Weiser, Razin and Stein measured exchange uptake and exit in both cold-stored and fresh human red cells (77). They concluded that exchange kinetics were mono-phasic, but used early time points (< 30 sec) in their analysis and thus missed the second slower phase. Previous studies by this laboratory employing times of ≤ 5 minutes demonstrated biphasic sugar exchange transport in intact red cells, but only at the lowest [3MG] tested (< 1 mM) (23). This led to the conclusion that biphasic transport was due to sugar binding in the cell. However, we now know that detection and analysis of the slower phase of transport at 4 °C requires measurements beyond 5 minutes and this prompted us to extend our analysis of equilibrium exchange transport to later time points.
When red cell ghosts are nominally ATP-free, radio-tracer 3MG equilibrium exchange follows simple monophasic kinetics. Exchange in ATP loaded red cell ghosts shows biphasic exchange kinetics at all [3MG] tested. Neither fast nor slow phases of exchange transport can be attributed to sugar complexation by GLUT1 as [GLUT1] is 20 μM while [3MG] ranges from 0.1 to 20 mM. ATP-dependent deviation from monophasic exchange kinetics is not due to heterogeneity in ghost size, cellular GLUT1 content or GLUT1 activity. Monophasic Urd exchange kinetics in the presence of intracellular ATP also argue against ATP dependent ghost heterogeneity.
Urd exchange kinetics imply that biphasic 3MG exchange kinetics are either GLUT1- or sugar-specific. If a sugar-specific compartment exists in ATP loaded cells, then the 3MG space of ATP loaded cells should be greater than the Urd space. ATP removal should be without effect on the 3MG space but will increase the Urd space. This was not observed. If a specific sugar-binding compartment explains the ATP-dependent slow phase of exchange transport, then the 3MG space of ATP loaded cells should be greater than the Urd space while ATP depletion will reduce the 3MG space of the cell to that of the Urd space which remains unchanged. The observation that ATP has no affect on 3MG or Urd space refutes both hypotheses.
The possibility of a time-dependent change in the intrinsic kinetics of transport over the 5 hours required for measurements is refuted by two observations: 1) instantaneous 3MG transport rates do not change with time and, 2) biphasic exchange of radiolabeled 3MG is recapitulated following 15 hours of exchange of unlabeled sugar. In sum, these results suggest two serial barriers to 3MG transport. The first barrier is translocation through GLUT1 while the nature of the second barrier is unknown. Two possibilities exist - the barrier is a physical barrier (e.g. permeability barrier or unstirred layer) or the barrier is a chemical barrier (e.g. sugar is reversibly converted to a second transported species).
The physical barrier hypothesis
A physical barrier model for ATP dependent, GLUT1-mediated biphasic 3MG equilibrium exchange is illustrated in Figure 7A. In normal red cells, GLUT1 is anisotropically distributed in the plasma membrane. The cytosol, however, contains two diffusionally isolated compartments (e.g. see (28)). Cytosol adjacent to GLUT1-enriched membrane rafts (compartment 1) is accessible to newly imported sugars. Cytosol adjacent to GLUT1-depleted membrane (compartment 2) is inaccessible to newly imported sugars. Thus sugar transport rapidly fills compartment 1 while equilibration of compartment 2 requires intracellular diffusion across the barrier separating compartments. The Urd transporter ENT1, by contrast, is uniformly distributed in the membrane such that both 3MG compartments are accessible to imported Urd. Upon Mg2+. ATP depletion-induced echinocytosis (48), GLUT1 becomes uniformly distributed in the plasma membrane and/or the diffusion barrier between cytoplasmic compartments is lost making the entire cellular space directly accessible to transported 3MG.
Figure 7.

Models for ATP-induced red blood cell ghost morphological change and GLUT1 non-isotropic distribution. A The physical barrier - With sufficiently high intracellular [Mg2+] and [ATP], red cells and ghosts are biconcave and GLUT1 is restricted to specific areas of the membrane. Cytoplasmic space that is adjacent to GLUT1-depleted plasma membrane is diffusionally isolated from cytoplasmic space adjacent to GLUT1-enriched membrane. ENT1 is isotropically distributed in the membrane so that Urd is transported into both cytoplasmic compartments simultaneously. ATP and/or Mg2+ depletion results in phosphatidylserine redistribution and echinocyte formation. GLUT1 surface distribution in spheroechinocytes is isotropic and/or diffusional isolation of cytoplasmic spaces is lost resulting in monophasic 3MG exchange. B The chemical barrier - Sugars undergo spontaneous but slow anomerization between α- and β-forms in aqueous solution (k ≈ 0.002 – 0.003 per min at 4 °C; (17); see also Figure 9A). Two subunits of tetrameric GLUT1 are shown in cartoon form in the lipid bilayer. Extracellular α- and β-D-glucose are imported equally in the absence of ATP but β-D-glucose is preferred when GLUT1 is complexed with intracellular ATP. α- and β-sugars compete for uptake and exit. While β-sugars equilibrate most rapidly across the membrane, mutarotation to α-sugar ensures that both α- and β-sugars are available in the cytoplasm. The consequences for transport include: underestimation of Km(app) and Vmax for net sugar uptake; overestimation of Km(app) for sugar exit; underestimation of Km(app) exit into saturating sugar solutions.
This model predicts: 1) agents that promote sphero-echinocyte formation will induce monophasic 3MG exchange kinetics, 2) GLUT1 membrane localization is different from ENT1 localization, 3) diffusion-mediated 3MG transport in discocytes should be monophasic, 4) slowing transport by use of inhibitors will inhibit the fast component of transport but not the slow phase.
The chemical barrier hypothesis
A chemical barrier describes sugar conversion to a second molecular species within the cell (Figure 7B). A sugar could, for example, be metabolized, undergo anomerization or become complexed to a binding partner. If metabolized, the transformed species must remain a substrate for bidirectional transport (by either GLUT1 or other transporters) otherwise the cytoplasmic distribution space available to sugar plus its metabolite would exceed cell water volume. 3MG is, however, a nonmetabolizable sugar which is neither transformed following transport into or out of the cell (51, 52). We therefore reject the metabolism hypothesis. The binding partner hypothesis is refuted by the observation of equal Urd and 3MG equilibration spaces.
Differential transport of sugar anomers could explain biphasic sugar transport. D-Glucose and 3MG anomerize slowly in aqueous solution between α- and β-anomers (t½ = 10 min at 37 °C and 250 min at 4 °C; equilibrium ratio of α- : β-anomer ≈ 33:66; (45)). The anomeric hydroxyl-group (located at C-1) is oriented below the pyranose ring in α-D-glucose and 3MG but is equatorial for the β-anomers. Could the orientation of this hydroxyl group affect transporter affinity and/or capacity for substrate? Epimers of D-glucose (glucose stereoisomers with different hydroxyl group orientations at specific ring carbons) show strikingly different affinities for the red cell sugar transporter. Studies with D-galactose (a C4 epimer of D-glucose), D-allose (C3) or D-mannose (C2)) indicate that opposite hydroxy configurations at C4, C3 or C2 cause a 12-, infinite or 3-fold (respectively) increase in Kiapp (relative to D-glucose) for inhibition of sorbose uptake by red cells (6). Where it has been studied (e.g. D-galactose), there is no accompanying change in Vmax for sugar transport (31).
The equilibrium ratio of β-3MG to α-3MG at 4 – 20 °C is 65:35 which is very close to the relative sizes of fast and slow 3MG compartments observed in ATP-loaded red cell ghosts (see Table 1). If biphasic sugar transport is explained by differential transport of α- and β-anomers, several predictions follow: 1) β-3MG is the preferred GLUT1 substrate in the presence of ATP (ratio of fast to slow transport rates ≈ 19 : 1; see Table 1). In the absence of ATP, 3MG anomers are transported equally, 2) equilibrium compartment sizes in ATP-containing cells are proportional to equilibrium anomer distributions, 3) acceleration of mutarotation to a rate several-fold faster than the slow rate of transport eliminates the slow phase of transport, 4) slowing transport by use of inhibitors will inhibit both the fast and slow phases of transport because both phases are carrier-mediated.
Testing the barrier hypotheses
The physical and chemical barrier hypotheses predict mutually exclusive outcomes for the partial inhibition test. The physical barrier hypothesis predicts that only the rapid phase of transport is inhibited by transport inhibitors because the slow phase is a GLUT1-independent event (diffusion). The chemical barrier hypothesis predicts inhibition of both phases because each is GLUT1-mediated. Our results show that both fast and slow phases are inhibited by cytochalasin B (Figure 8) and by maltose (39). We therefore conclude the the physical barrier hypothesis is untenable.
Figure 8.

Time-course of 2.5 mM 3-O-methylglucose equilibrium exchange uptake and exit in red cell ghosts containing intracellular 4 mM ATP and exposed to 5 μM CCB. Ordinate: fractional equilibration; Abscissa: time in minutes (note log scale). Uptake (●) and exit (○) follow bi-exponential kinetics. Curves drawn through the points are computed by nonlinear regression of the form: A(1−e−k1t)+(1−A)(1−e−k2t) for uptake and A(e−k1t)+(1−A)(e−k2t) for exit where k1 is the observed rate constant for the fast phase, k2 is the slow phase rate constant, and A is the fractional component of total uptake or exit described by the fast phase. Computed values of k1, k2 and A are: uptake, k1 = 0.050 ± 0.022 per min, k2 = 0.005 ± 0.001 per min, A = 0.234 ± 0.064, χ2 = 0.026; exit, k1 = 0.069 ± 0.016 per min, k2 = 0.004 ± 0.001 per min, A = 0.307 ± 0.034, χ2 = 0.0178.
Refining the anomer (chemical barrier) hypothesis
Figure 9A illustrates a simulated exchange uptake of α- and β-3MG. This figure models experimental data to a mechanism in which α- and β-3MG compete for GLUT1-mediated uptake and where β-3MG is transported with greater capacity and affinity than α-3MG. Exchange transport is assumed to follow simple Michaelis-Menten kinetics (14, 38, 47) and uptake of radio-tracer 3MG (Q) is given by:
| (2 |
where
Figure 9.

A Simulated time-course of α- and β-3-O-methylglucose equilibrium exchange uptake in red cell ghosts containing intracellular ATP. Ordinate: fractional equilibration; Abscissa: time in minutes (note log scale). The open circles (○) show the measured exchange uptake of radiolabeled 3MG in cells equilibrated with 2.5 mM unlabeled 3MG (see Figure 1B). Three curves were simulated using equation 2 and have the following constants: α-3MG, Km(app) = 37.1 mM and Vmax = 0.79 mmol/L/min; β-3MG, Km(app) = 4.7 mM and Vmax = 2.41 mmol/L/min. α+ β represents the sum of α-3MG and β-3MG uptake. The time course of α-3MG mutarotation at 4 °C (α ⇌ β, (●)) was measured by CD at 193 nm using a freshly prepared 20 mM α-3MG solution. Ordinate: CD at 193 nm in mdeg; abscissa: time in minutes. The curve drawn through the points is a single exponential computed by nonlinear regression and is characterized by a first order rate constant of 0.0029 ± 0.0002 per min. The dashed lines indicate the half-times (min) for β-3MG uptake (1.65 min), α-3MG uptake (41 min) and 3MG mutarotation (239 min). B Analysis of inhibition of radiolabeled 3MG uptake in ATP-containing ghosts (8 nM α- plus β-[3H]-3-O-methylglucose) by freshly prepared, unlabeled α-3MG (80:20 α:β 3MG; open circles) or by an equilibrium unlabeled 3MG solution (35:65 α:β 3MG; closed circles). Ordinate: the ratio of 3MG uptake in the absence of unlabeled 3MG : uptake in the presence of unlabeled 3MG. Abscissa: [3MG] in mM. The straight lines drawn through the points were computed by non-linear regression and are characterized by the slope = α/Kα + β/Kβ. The results are: α-3MG (dashed line), Kα = 4.59 mM, Kβ = 0.58 mM; equilibrium 3MG (continuous line), Kα = 6 mM, Kβ = 0.97 mM.
where vα oi and vβ oi are unidirectional uptake of radiolabeled α- and β-3MG, vα io and vβ io are unidirectional exit of radiolabeled α- and β-3MG, Vβ is Vmax for exchange transport of β-3MG, Kβ is Km for β-3MG transport, Vα is Vmax for exchange transport of α-3MG, Kα is Km for α-3MG transport, Si and So are the total, unlabeled intra- and extracellular 3MG concentrations, Qi and Qo are the total, radiolabeled intra- and extracellular 3MG concentrations, α is the fraction of S or Q that exists as α-3MG (0.35) and β is the fraction of S or Q that exists as β-3MG (0.65).
Total (radiolabeled α-plus β-3MG) exchange uptake data at 2.5 mM 3MG and 10 μM radiolabeled 3MG (4 °C) were simulated by 4th order Runge Kutta numerical integration (Figure 9A). Vmax and Km(app) parameters for α- and β-3MG transport were varied by an iterative least squares procedure until the deviation between observed and predicted uptake reached a minimum. The result suggests that β-3MG (Vmax = 2.4 mmol/L/min and Km(app) = 4.7 mM) is a more efficient exchange substrate than is α-3MG (Vmax = 0.8 mmol/L/min and Km(app) = 37.1 mM). This figure also shows the observed kinetics of α-3MG mutarotation at 4 °C as measured by circular dichroism. 3MG mutarotation is significantly slower than exchange uptake of α-3MG - a prerequisite of the anomer (chemical-barrier) model for sugar transport. The complete 3MG exchange data set of Table 1 has been re-analyzed by this procedure (e.g. see Figure 1B dashed curve fits) and the results are summarized in Table 3. Vβ, Kβ, Vα and Kα are independent of [3MG] and direction of radio-tracer 3MG movement (uptake or exit). Vβ is 2.5-fold greater than Vα while Kα is 7.4-fold greater than Kβ. Thus the major impact of re-orientation of the anomeric hydroxyl group to the α-configuration is a 7-fold loss in affinity of sugar binding. In the absence of ATPi, radiolabeled 3MG exchange transport is consistent with a single transport process and is described by:
| (3 |
where,
Table 3.
Kinetics of 3MG transport
| bParameter |
a ATPi mM
|
c n | ||
|---|---|---|---|---|
| 0 | 4 | |||
|
| ||||
| Exchange | zero-trans uptake | |||
| Kα | 27.5 ± 2.44 | 8 | ||
| Kβ | 3.74 ± 0.21 | 8 | ||
| Vα | 1.28 ± 0.11 | 8 | ||
| Vβ | 3.20 ± 0.25 | 8 | ||
| kα | 0.05 ± 0.00 | 8 | ||
| kβ | 0.86 ± 0.06 | 8 | ||
| K | 34.9 ± 1.62 | 8 | ||
| V | 5.21 ± 0.31 | 8 | ||
| k | 0.15 ± 0.01 | 8 | ||
| Kα | 5.29 ± 0.49 | 4 | ||
| Kβ | 0.77 ± 0.13 | 4 | ||
Equilibrium exchange and zero-trans 3MG transport were measured in red cell ghosts containing or lacking 4 mM intracellular ATP.
The time course of exchange uptake and exit at 0.1, 2.5 (see Figure 1), 10 and 20 μM 3MG was analyzed according to equation 2 (exchange transport plus ATP) or 3 (exchange transport, 0 ATP) by an iterative least squares procedure to obtain Kα and Kβ (Km(app) for equilibrium exchange transport of α- and β-3MG), Vα and Vβ (Vmax for equilibrium exchange transport of α- and β-3MG), kα and kβ (Vmax/Km(app) for equilibrium exchange transport of α- and β-3MG), K and V (Km(app) and Vmax for equilibrium exchange 3MG transport in the absence of intracellular ATP). 3MG-inhibition of the initial rate of radiolabeled 3MG uptake by ATP-containing ghosts was measured using equilibrium (35:65) or 80:20 α : β- 3MG solutions (see Figure 9B) to obtain Kα and Kβ (Ki(app) for α- and β-3MG inhibition of zerotrans 3MG uptake). Results are shown as mean ± SEM and
the number of experiments (in triplicate) is shown.
where V and K are Vmax and Km(app) respectively for 3MG exchange transport. Analysis of exchange transport in the absence of ATP (dashed curve fits of Figure 1A, Table 3) indicates Km(app) and Vmax are 35 mM and 5.2 mmol/L/min respectively indicating that ATP-depletion results in the loss of high affinity β-3MG binding. ATP-GLUT1 interaction is thus a primary determinant of high affinity β-3MG exchange transport
Few previous studies have examined the transport of α- and β-D-glucose in red cells (17, 26, 58). Unlike liver, which contains significant mutarotase activity (10), the human red cell and red cell ghosts lack mutarotase (17). Preliminary in vitro measurements indicate that 3MG is not a substrate for porcine mutarotase and that mutarotase-acceleration of D-glucose anomerization is unaffected by 4 mM ATP (Leitch and Carruthers, unpublished observations). Our observations are, therefore, not explained by ATP-dependent inhibition of erythrocyte mutarotase. When freshly dissolved as pure anomers, α- and β-D-glucose are relatively equipotent in their inhibition of the the initial rate of radiolabeled D-glucose uptake from an equilibrium mixture of [14C]-α-D-glucose and [14C]-⇓-D-glucose (17). This suggests that differences in rate constants for transport of α- and β-anomers reflect differential capacity for transport rather than differences in binding affinity - a conclusion that stands in contrast to our analysis of 3MG exchange transport. We therefore re-examined zero-trans [14C]-3MG uptake in red cell ghosts containing 4 mM ATP. Proton NMR of freshly dissolved, unlabeled α-3MG and of an equilibrium solution of 3MG indicates that “α-3MG” is in fact 80% α-anomer and 20% β-anomer. The equilibrium solution contains a 35:65 ratio of α-:β-3MG. These sugar solutions were used as inhibitors of [3H]-3MG uptake at 4 °C. [3H]-3MG is an equilibrium mixture of [3H]-α and [3H]-β-3MG. Uptake was measured at 8 nM [3H]-3MG with increasing amounts of unlabeled 3MG (0 to 10 mM). Figure 9B shows that “α-3MG” and equilibrium 3MG inhibit unidirectional [3H]-3MG uptake half-maximally at 0.6 to 1.2 mM (see x-intercepts of curve fits). This is consistent with our earlier study comparing α- and β-D-glucose affinities(17) and suggests only small differences in the affinity of GLUT1 for α- and β-3MG. However, the slope of the inhibition data employing equilibrium 3MG is significantly greater than the slope of the α-3MG inhibition data. When radiolabeled [3MG] ≪ unlabeled [3MG], the ratio of control radiolabeled 3MG uptake to inhibited 3MG uptake (vc/vi) increases linearly with [unlabeled 3MG]total and is characterized by the slope
| (4 |
where α and β are the fractional amounts of α- and β-3MG present in the uptake medium and Kα and Kβ are Km(app) for uptake of α- and β-3MG respectively. Using the computed slopes of Figure 9B and the known ratios of α : β anomers present in solution, we calculate that Kα and Kβ for zero-trans net α- and β-3MG uptake are 5.29 ± 0.47 and 0.77 ± 0.13 mM respectively (Table 3). These affinity constants are significantly lower that those for exchange transport. However, Km(app) for zero-trans D-glucose and galactose zero-trans uptake are 14- and 11-fold lower respectively than Km(app) for exchange uptake of the same sugars (18, 29, 30). This more detailed analysis strongly supports the hypothesis that GLUT1 shows greater affinity for β-3MG over α-3MG.
Physiological significance
A preference for α-D-glucose in transport and/or metabolism has been reported for liver (10, 54, 59), pancreatic beta cells (53, 55, 60, 71), muscle (80) adipose (70) and yeast cells (25). Cardiac muscle hexokinase displays high affinity but low capacity for α-D-glucose and low affinity but high capacity for β-D-glucose (50). Brain, retina erythrocytes and lens cells appear to prefer β-D-glucose or show no preference (17, 26, 52, 59, 65, 67, 68)}. β-D-Glucose is more potent than α-D-Glucose in inhibiting vagally-mediated secretion of gastric acid (77). These observations emphasize the tissue-specific physiology of anomer transport and utilization and further suggest that cells expressing GLUT1 or GLUT3 may prefer the β-anomer while cells expressing GLUT2 or GLUT4 may prefer the α-anomer.
Significance to previous transport studies
These findings may necessitate re-evaluation of red cell glucose transport determinations. Transport measurements are normally obtained by initial rate analysis over intervals of 1 minute or less. If initial rates of transport are derived largely from uptake of β-sugar, they are related to (and must be corrected for) the amount of β-sugar present in solution during the measurement. Thus Km(app) and Vmax parameters may be overestimated by 1.5-fold. Furthermore, computed rates and Kmapp must be corrected for competitive inhibition by the omnipresent, lower affinity α-sugar. This result could also explain (see (2) and (78) for lucid expositions) how integrated rate equation analysis of time-course data results in overestimation of Kmapp for transport because all time-courses are artificially extended owing to slower transport of α-sugar. This laboratory has previously interpreted the slow phase of sugar import as diffusionally limited release of translocated sugar into cytoplasm (8, 9). This interpretation is no longer tenable.
Conclusion
ATP-containing human red blood cell ghosts exhibit biphasic equilibrium exchange 3MG transport at sugar concentrations ranging from 1 to 20 mM. This observation is inconsistent with previous models for ATP-modulation of GLUT1 activity. We propose that ATP-GLUT1 interactions promote preferential transport of β-3MG and that extended time-courses of sugar transport in human red cells reveal deviations from simple kinetics owing to low affinity, low capacity α-3MG transport and continuous β-3MG and α-3MG mutarotation. In the absence of ATP, both anomers may be transported equally or differences in the kinetics of β-3MG and α-3MG become too small to measure with existing methodologies. Differential transport of 3MG anomers (and thus transport complexity) is only observable in cells where rate constants for 3MG transport are greater than those for 3MG mutarotation.
Acknowledgments
This work was supported by NIH grants DK 36081 and DK 44888
The abbreviations used are
- GLUT1
erythrocyte glucose transport protein
- 3MG
3-O-methyl-D-glucopyranoside
- C-Ab
rabbit polyclonal antiserum raised against a synthetic peptide comprised of GLUT1 residues 480–492
- CCB
cytochalasin B
- δ-Ab
sheep polyclonal antiserum raised against non-denatured, non-reduced purified human GLUT1 proteoliposomes
- EDTA
ethylenediaminetetraacetic acid
- EGTA
ethylene glycol bis(2-aminoether)-N,N,N′,N′-tertraacetic acid
- ENT1
human NBMPR-sensitive equilibrative nucleoside transporter 1
- FACS
fluorescence activated cell sorting
- HEPES
(N–[2–Hydroxyethyl]piperazine–N′–[2–ethanesulfonic acid])
- Tris–HCl
tris(hydroxymethyl)aminomethane hydrochloride
- Urd
uridine
References
- 1.Altschul SF. Amino acid substitution matrices from an information theoretic perspective. J Mol Biol. 1991;219:555–565. doi: 10.1016/0022-2836(91)90193-A. [DOI] [PMC free article] [PubMed] [Google Scholar]
- 2.Appleman JR, Lienhard GE. Rapid kinetics of the glucose transporter from human erythrocytes. Detection and measurement of a half-turnover of the purified transporter. J Biol Chem. 1985;260:4575–4578. [PubMed] [Google Scholar]
- 3.Asano T, Shibasaki Y, Kasuga M, Kanazawa Y, Takaku F, Akanuma Y, Oka Y. Cloning of a rabbit brain glucose transporter cDNA and alteration of glucose transporter mRNA during tissue development. Biochem Biophys Res Commun. 1988;154:1204–1211. doi: 10.1016/0006-291x(88)90268-9. [DOI] [PubMed] [Google Scholar]
- 4.Baker GF, Naftalin RJ. Evidence of multiple operational affinities for D-glucose inside the human erythrocyte membrane. Biochim Biophys Acta. 1979;550:474–484. doi: 10.1016/0005-2736(79)90150-0. [DOI] [PubMed] [Google Scholar]
- 5.Baker GF, Widdas WF. The asymmetry of the facilitated transfer system for hexoses in human red cells and the simple kinetics of a two component model. J Physiol (London) 1973;231:143–165. doi: 10.1113/jphysiol.1973.sp010225. [DOI] [PMC free article] [PubMed] [Google Scholar]
- 6.Barnett JE, Holman GD, Munday KA. Structural requirements for binding to the sugar-transport system of the human erythrocyte. Biochem J. 1973;131:211–221. doi: 10.1042/bj1310211. [DOI] [PMC free article] [PubMed] [Google Scholar]
- 7.Birnbaum MJ, Haspel HC, Rosen OM. Cloning and characterization of a cDNA encoding the rat brain glucose- transporter protein. Proc Natl Acad Sci USA. 1986;83:5784–5788. doi: 10.1073/pnas.83.16.5784. [DOI] [PMC free article] [PubMed] [Google Scholar]
- 8.Blodgett DM, Carruthers A. Quench-Flow Analysis Reveals Multiple Phases of GluT1-Mediated Sugar Transport. Biochemistry. 2005;44:2650–2660. doi: 10.1021/bi048247m. [DOI] [PubMed] [Google Scholar]
- 9.Blodgett DM, Carruthers A. Conventional transport assays underestimate sugar transport rates in human red cells. Blood Cells Mol Dis. 2004;32:401–40z. doi: 10.1016/j.bcmd.2004.01.015. [DOI] [PubMed] [Google Scholar]
- 10.Bollen M, Malaisse-Lagae F, Malaisse W, Stalmans W. The interaction of phosphorylase a with D-glucose displays alpha-stereospecificity. Biochim Biophys Acta. 1990;1038:141–145. doi: 10.1016/0167-4838(90)90196-m. [DOI] [PubMed] [Google Scholar]
- 11.Carruthers A. Anomalous asymmetric kinetics of human red cell hexose transfer: role of cytosolic adenosine 5′-triphosphate. Biochemistry. 1986;25:3592–3602. doi: 10.1021/bi00360a018. [DOI] [PubMed] [Google Scholar]
- 12.Carruthers A. ATP regulation of the human red cell sugar transporter. J Biol Chem. 1986;261:11028–11037. [PubMed] [Google Scholar]
- 13.Carruthers A. Facilitated diffusion of glucose. Physiol Rev. 1990;70:1135–1176. doi: 10.1152/physrev.1990.70.4.1135. [DOI] [PubMed] [Google Scholar]
- 14.Carruthers A. Mechanisms for the facilitated diffusion of substrates across cell membranes. Biochemistry. 1991;30:3898–3906. doi: 10.1021/bi00230a014. [DOI] [PubMed] [Google Scholar]
- 15.Carruthers A, Helgerson AL. The human erythrocyte sugar transporter is also a nucleotide binding protein. Biochemistry. 1989;28:8337–8346. doi: 10.1021/bi00447a011. [DOI] [PubMed] [Google Scholar]
- 16.Carruthers A, Melchior DL. Asymmetric or symmetric? Cytosolic modulation of human erythrocyte hexose transfer. Biochim Biophys Acta. 1983;728:254–266. doi: 10.1016/0005-2736(83)90478-9. [DOI] [PubMed] [Google Scholar]
- 17.Carruthers A, Melchior DL. Transport of a- and b-D-glucose by the intact human red cell. Biochemistry. 1985;24:4244–4250. doi: 10.1021/bi00336a065. [DOI] [PubMed] [Google Scholar]
- 18.Challiss JR, Taylor LP, Holman GD. Sugar transport asymmetry in human erythrocytes--the effect of bulk haemoglobin removal and the addition of methylxanthines. Biochim Biophys Acta. 1980;602:155–166. doi: 10.1016/0005-2736(80)90298-9. [DOI] [PubMed] [Google Scholar]
- 19.Cheung JY, Regen DM, Schworer ME, Whitfield CF, Morgan HE. Anaerobic stimulation of sugar transport in avian erythrocytes. Biochim Biophys Acta. 1977;470:212–229. doi: 10.1016/0005-2736(77)90101-8. [DOI] [PubMed] [Google Scholar]
- 20.Cloherty EK, Diamond DL, Heard KS, Carruthers A. Regulation of GLUT1-mediated sugar transport by an antiport/uniport switch mechanism. Biochemistry. 1996;35:13231–13239. doi: 10.1021/bi961208t. [DOI] [PubMed] [Google Scholar]
- 21.Cloherty EK, Heard KS, Carruthers A. Human erythrocyte sugar transport is incompatible with available carrier models. Biochemistry. 1996;35:10411–10421. doi: 10.1021/bi953077m. [DOI] [PubMed] [Google Scholar]
- 22.Cloherty EK, Levine KB, Graybill C, Carruthers A. Cooperative nucleotide binding to the human erythrocyte sugar transporter. Biochemistry. 2002;41:12639–12651. doi: 10.1021/bi0259002. [DOI] [PubMed] [Google Scholar]
- 23.Cloherty EK, Sultzman LA, Zottola RJ, Carruthers A. Net sugar transport is a multistep process. Evidence for cytosolic sugar binding sites in erythrocytes. Biochemistry. 1995;34:15395–15406. doi: 10.1021/bi00047a002. [DOI] [PubMed] [Google Scholar]
- 24.Diamond D, Carruthers A. Metabolic control of sugar transport by derepression of cell surface glucose transporters: an insulin-independent, recruitment-independent mechanism of regulation. J Biol Chem. 1993;268:6437–6444. [PubMed] [Google Scholar]
- 25.Ehwald R, Mavrina L. Anomeric specificity of the monosaccharide carrier in yeasts and yeast-like organisms. Folia Microbiol (Praha) 1981;26:95–102. doi: 10.1007/BF02927362. [DOI] [PubMed] [Google Scholar]
- 26.Faust RG. Monosaccharide penetration into human red blood cells by an altered diffusion mechanism. J Cell Comp Physiol. 1960;56:103–121. doi: 10.1002/jcp.1030560205. [DOI] [PubMed] [Google Scholar]
- 27.Fry DC, Kuby SA, Mildvan AS. ATP-binding site of adenylate kinase: Mechanistic implications of its homology with ras-encoded p21, F1-ATPase, and other nucleotide-binding proteins. Proc Natl Acad Sci USA. 1986;83:907–911. doi: 10.1073/pnas.83.4.907. [DOI] [PMC free article] [PubMed] [Google Scholar]
- 28.Garcia-Perez AI, Lopez-Beltran EA, Kluner P, Luque J, Ballesteros P, Cerdan S. Molecular crowding and viscosity as determinants of translational diffusion of metabolites in subcellular organelles. Arch Biochem Biophys. 1999;362:329–338. doi: 10.1006/abbi.1998.1051. [DOI] [PubMed] [Google Scholar]
- 29.Ginsburg H. Galactose transport in human erythrocytes. Biochim Biophys Acta. 1978;506:119–135. doi: 10.1016/0005-2736(78)90439-x. [DOI] [PubMed] [Google Scholar]
- 30.Ginsburg H, Ram D. Zero-trans and equilibrium exchange efflux and infinite-trans uptake of galactose by human erythrocytes. Biochim Biophys Acta. 1975;382:376–396. doi: 10.1016/0005-2736(75)90278-3. [DOI] [PubMed] [Google Scholar]
- 31.Ginsburg H, Stein D. Zero-trans and infinite-cis uptake of galactose in human erythrocytes. Biochim Biophys Acta. 1975;382:353–368. doi: 10.1016/0005-2736(75)90277-1. [DOI] [PubMed] [Google Scholar]
- 32.Hankin BL, Lieb WR, Stein WD. Rejection criteria for the asymmetric carrier and their application to glucose transport in the human red blood cell. Biochim Biophys Acta. 1972;288:114–126. doi: 10.1016/0005-2736(72)90229-5. [DOI] [PubMed] [Google Scholar]
- 33.Harris EJ. An analytical study of the kinetics of glucose movement in human erythrocytes. J Physiol. 1983;173:344–353. doi: 10.1113/jphysiol.1964.sp007460. [DOI] [PMC free article] [PubMed] [Google Scholar]
- 34.Harrison SA, Buxton JM, Helgerson AL, MacDonald RG, Chlapowski FJ, Carruthers A, Czech MP. Insulin action on activity and cell surface disposition of human HepG2 glucose transporters expressed in Chinese hamster ovary cells. Journal of Biological Chemistry. 1990;265:5793–5801. [PubMed] [Google Scholar]
- 35.Hayat MA. Principles and techniques of electron microscopy: biological applications. New York: Cambridge University Press; 2000. [Google Scholar]
- 36.Heard KS, Fidyk N, Carruthers A. ATP-dependent substrate occlusion by the human erythrocyte sugar transporter. Biochemistry. 2000;39:3005–3014. doi: 10.1021/bi991931u. [DOI] [PubMed] [Google Scholar]
- 37.Hebert DN, Carruthers A. Direct evidence for ATP modulation of sugar transport in human erythrocyte ghosts. J Biol Chem. 1986;261:10093–10099. [PubMed] [Google Scholar]
- 38.Helgerson AL, Carruthers A. Analysis of protein-mediated 3-O-methylglucose transport in rat erythrocytes: rejection of the alternating conformation carrier model for sugar transport. Biochemistry. 1989;28:4580–4594. doi: 10.1021/bi00437a012. [DOI] [PubMed] [Google Scholar]
- 39.Hurlock B, Tosic J. An organism able to metabolize 3-methylglucose and 3-methylfructose. J Gen Microbiol. 1951;5:587–591. doi: 10.1099/00221287-5-3-587. [DOI] [PubMed] [Google Scholar]
- 40.Joost HG, Bell GI, Best JD, Birnbaum MJ, Charron MJ, Chen YT, Doege H, James DE, Lodish HF, Moley KH, Moley JF, Mueckler M, Rogers S, Schurmann A, Seino S, Thorens B. Nomenclature of the GLUT/SLC2A family of sugar/polyol transport facilitators. Am J Physiol Endocrinol Metab. 2002;282:E974–6. doi: 10.1152/ajpendo.00407.2001. [DOI] [PubMed] [Google Scholar]
- 41.Jung CY, Carlson LM, Whaley DA. Glucose transport carrier activities in extensively washed human red cell ghosts. Biochim Biophys Acta. 1971;241:613–627. doi: 10.1016/0005-2736(71)90059-9. [DOI] [PubMed] [Google Scholar]
- 42.Karlish SJD, Lieb WR, Ram D, Stein WD. Kinetic Parameters of glucose efflux from human red blood cells under zero-trans conditions. Biochim Biophys Acta. 1972;255:126–132. doi: 10.1016/0005-2736(72)90014-4. [DOI] [PubMed] [Google Scholar]
- 43.Levine KB, Cloherty EK, Fidyk NJ, Carruthers A. Structural and physiologic determinants of human erythrocyte sugar transport regulation by adenosine triphosphate. Biochemistry. 1998;37:12221–12232. doi: 10.1021/bi980585y. [DOI] [PubMed] [Google Scholar]
- 44.Levine KB, Cloherty EK, Hamill S, Carruthers A. Molecular determinants of sugar transport regulation by ATP. Biochemistry. 2002;41:12629–12638. doi: 10.1021/bi0258997. [DOI] [PubMed] [Google Scholar]
- 45.Lewis BE, Choytun N, Schramm VL, Bennet AJ. Transition States for glucopyranose interconversion. J Am Chem Soc. 2006;128:5049–5058. doi: 10.1021/ja0573054. [DOI] [PMC free article] [PubMed] [Google Scholar]
- 46.Lieb WR, Stein WD. Is there a high affinity site for sugar transport at the inner face of the human red cell membrane? J Theor Biol. 1977;69:311–319. doi: 10.1016/0022-5193(77)90140-0. [DOI] [PubMed] [Google Scholar]
- 47.Lieb WR, Stein WD. Testing and characterizing the simple carrier. Biochim Biophys Acta. 1974;373:178–196. doi: 10.1016/0005-2736(74)90144-8. [DOI] [PubMed] [Google Scholar]
- 48.Lin S, Yang E, Huestis WH. Relationship of phospholipid distribution to shape change in Ca(2+)- crenated and recovered human erythrocytes. Biochemistry. 1994;33:7337–7344. doi: 10.1021/bi00189a039. [DOI] [PubMed] [Google Scholar]
- 49.Lowe AG, Walmsley AR. The kinetics of glucose transport in human red blood cells. Biochim Biophys Acta. 1986;857:146–154. doi: 10.1016/0005-2736(86)90342-1. [DOI] [PubMed] [Google Scholar]
- 50.Malaisse-Lagae F, Giroix MH, Sener A, Malaisse WJ. Temperature dependency of the anomeric specificity of yeast and bovine hexokinases. Biol Chem Hoppe Seyler. 1986;367:411–416. doi: 10.1515/bchm3.1986.367.1.411. [DOI] [PubMed] [Google Scholar]
- 51.Malaisse-Lagae F, Malaisse WJ. Anomeric specificity of D-glucose metabolism in rat adipocytes. Eur J Biochem. 1986;158:663–666. doi: 10.1111/j.1432-1033.1986.tb09804.x. [DOI] [PubMed] [Google Scholar]
- 52.Malaisse WJ, Malaisse-Lagae F. Anomeric specificity of D-glucose metabolism in rat brain cells. Brain Res. 1987;419:147–155. doi: 10.1016/0006-8993(87)90578-6. [DOI] [PubMed] [Google Scholar]
- 53.Malaisse WJ, Sener A. Mathematical modelling of alpha- and beta-D-glucose metabolism in pancreatic islets exposed to equilibrated D-glucose. Int J Mol Med. 2004;14:677–682. [PubMed] [Google Scholar]
- 54.Malaisse WJ, Willem R. Anomeric specificity of D-glucose production by rat hepatocytes. Mol Cell Biochem. 2004;266:145–150. doi: 10.1023/b:mcbi.0000049152.06259.4b. [DOI] [PubMed] [Google Scholar]
- 55.Meglasson MD, Burch PT, Berner DK, Najafi H, Matschinsky FM. Identification of glucokinase as an alloxan-sensitive glucose sensor of the pancreatic beta-cell. Diabetes. 1986;35:1163–1173. doi: 10.2337/diab.35.10.1163. [DOI] [PubMed] [Google Scholar]
- 56.Miller DM. The kinetics of selective biological transport. III. Erythrocyte-monosaccharide transport data. Biophys J. 1968;8:1329–1338. doi: 10.1016/s0006-3495(68)86559-2. [DOI] [PMC free article] [PubMed] [Google Scholar]
- 57.Miller DM. The kinetics of selective biological transport. V. Further data on the erythrocyte–monosaccharide transport system. Biophys J. 1971;11:915–923. doi: 10.1016/S0006-3495(71)86263-X. [DOI] [PMC free article] [PubMed] [Google Scholar]
- 58.Miwa I, Fujii H, Okuda J. Asymmetric transport of D-glucose anomers across the human erythrocyte membrane. Biochem Int. 1988;16:111–117. [PubMed] [Google Scholar]
- 59.Miwa I, Fukatsu H, Toyoda Y, Okuda J. Anomeric preference of glucose utilization in human erythrocytes loaded with glucokinase. Biochem Biophys Res Commun. 1990;173:201–207. doi: 10.1016/s0006-291x(05)81041-1. [DOI] [PubMed] [Google Scholar]
- 60.Miwa I, Murata T, Okuda J. Alpha- and beta-anomeric preference of glucose-induced insulin secretion at physiological and higher glucose concentrations, respectively. Biochem Biophys Res Commun. 1991;180:709–715. doi: 10.1016/s0006-291x(05)81123-4. [DOI] [PubMed] [Google Scholar]
- 61.Mueckler M, Caruso C, Baldwin SA, Panico M, Blench I, Morris HR, Allard WJ, Lienhard GE, Lodish HF. Sequence and structure of a human glucose transporter. Science. 1985;229:941–945. doi: 10.1126/science.3839598. [DOI] [PubMed] [Google Scholar]
- 62.Naftalin RJ, Rist RJ. 3-O-methyl-D-glucose transport in rat red cells: effects of heavy water. Biochimica et Biophysica Acta. 1991;1064:37–48. doi: 10.1016/0005-2736(91)90409-2. [DOI] [PubMed] [Google Scholar]
- 63.Naftalin RJ, Holman GD. Transport of sugars in human red cells. In: Ellory JC, Lew VL, editors. Membrane transport in red cells. New York: Academic Press; 1977. pp. 257–300. [Google Scholar]
- 64.Naftalin RJ, Smith PM, Roselaar SE. Evidence for non–uniform distribution of D–glucose within human red cells during net exit and counterflow. Biochim Biophys Acta. 1985;820:235–249. doi: 10.1016/0005-2736(85)90117-8. [DOI] [PubMed] [Google Scholar]
- 65.Nagata Y, Nanba T, Ando M, Miwa I, Okuda J. Anomeric preferences of D-glucose uptake and utilization by cerebral cortex slices of rats. Neurochem Res. 1979;4:505–516. doi: 10.1007/BF00964644. [DOI] [PubMed] [Google Scholar]
- 66.Narahara HT, Ozand P. Studies of tissue permeability, IX. The effect of insulin on the penetration of 3-O-methylglucose-3H in frog muscle. J Biol Chem. 1963;238:40–49. [PubMed] [Google Scholar]
- 67.Okuda J, Kawamura M, Didelot S. Anomeric preference in uptake of D-glucose and of D-galactose by rat lenses. Curr Eye Res. 1987;6:1223–1226. doi: 10.3109/02713688709025232. [DOI] [PubMed] [Google Scholar]
- 68.Okuda J, Miwa I, Sato M, Murata T. Uptake of D-glucose anomers by rat retina. Experientia. 1977;33:19–20. doi: 10.1007/BF01936727. [DOI] [PubMed] [Google Scholar]
- 69.Plagemann PG, Woffendin C. Comparison of the equilibrium exchange of nucleosides and 3-O-methylglucose in human erythrocytes and of the effects of cytochalasin B, phloretin and dipyridamole on their transport. Biochim Biophys Acta. 1987;899:295–301. doi: 10.1016/0005-2736(87)90411-1. [DOI] [PubMed] [Google Scholar]
- 70.Regen DM, Morgan HE. Studies of the glucose-transport system in the rabbit erythrocyte. Biochim Biophys Acta. 1964;79:151–166. doi: 10.1016/0926-6577(64)90048-8. [DOI] [PubMed] [Google Scholar]
- 71.Rossini AA, Soeldner JS. Insulin release is glucose anomeric specific in the human. J Clin Invest. 1976;57:1083–1088. doi: 10.1172/JCI108351. [DOI] [PMC free article] [PubMed] [Google Scholar]
- 72.Sakaguchi T, Ishiguro K, Hayashi Y, Hasegawa A. Inhibition of gastric acid secretion elicited by D-glucose anomers in man. Exp Neurol. 1984;84:231–236. doi: 10.1016/0014-4886(84)90019-0. [DOI] [PubMed] [Google Scholar]
- 73.Shetty M, Loeb JN, Ismail BF. Enhancement of glucose transport in response to inhibition of oxidative metabolism: pre- and posttranslational mechanisms. American Journal of Physiology. 1992 doi: 10.1152/ajpcell.1992.262.2.C527. [DOI] [PubMed] [Google Scholar]
- 74.Simons TJB. Characterization of sugar transport in the pigeon red blood cell. J Physiol. 1983;338:477–500. doi: 10.1113/jphysiol.1983.sp014685. [DOI] [PMC free article] [PubMed] [Google Scholar]
- 75.Stein WD. Transport and diffusion across cell membranes. New York: Academic Press; 1986. [Google Scholar]
- 76.Taylor LP, Holman GD. Symmetrical kinetic parameters for 3-O-methyl-D-glucose transport in adipocytes in the presence and in the absence of insulin. Biochim Biophys Acta. 1981;642:325–335. doi: 10.1016/0005-2736(81)90449-1. [DOI] [PubMed] [Google Scholar]
- 77.Weiser MB, Razin M, Stein WD. Kinetic tests of models for sugar transport in human erythrocytes and a comparison of fresh and cold–stored cells. Biochim Biophys Acta. 1983;727:379–388. doi: 10.1016/0005-2736(83)90423-6. [DOI] [PubMed] [Google Scholar]
- 78.Wheeler TJ, Hinkle PC. The glucose transporter of mammalian cells. Ann Rev Physiol. 1985;47:503–518. doi: 10.1146/annurev.ph.47.030185.002443. [DOI] [PubMed] [Google Scholar]
- 79.Widdas WF. The asymmetry of the hexose transfer system in the human red cell membrane. Curr Top Memb Transp. 1980;14:165–223. [Google Scholar]
- 80.Zhang Y, Courtois P, Sener A, Malaisse WJ. Anomeric specificity of D-[U-14C]glucose incorporation into glycogen in rat hemidiaphragms. Biochimie. 2004;86:913–918. doi: 10.1016/j.biochi.2004.09.026. [DOI] [PubMed] [Google Scholar]