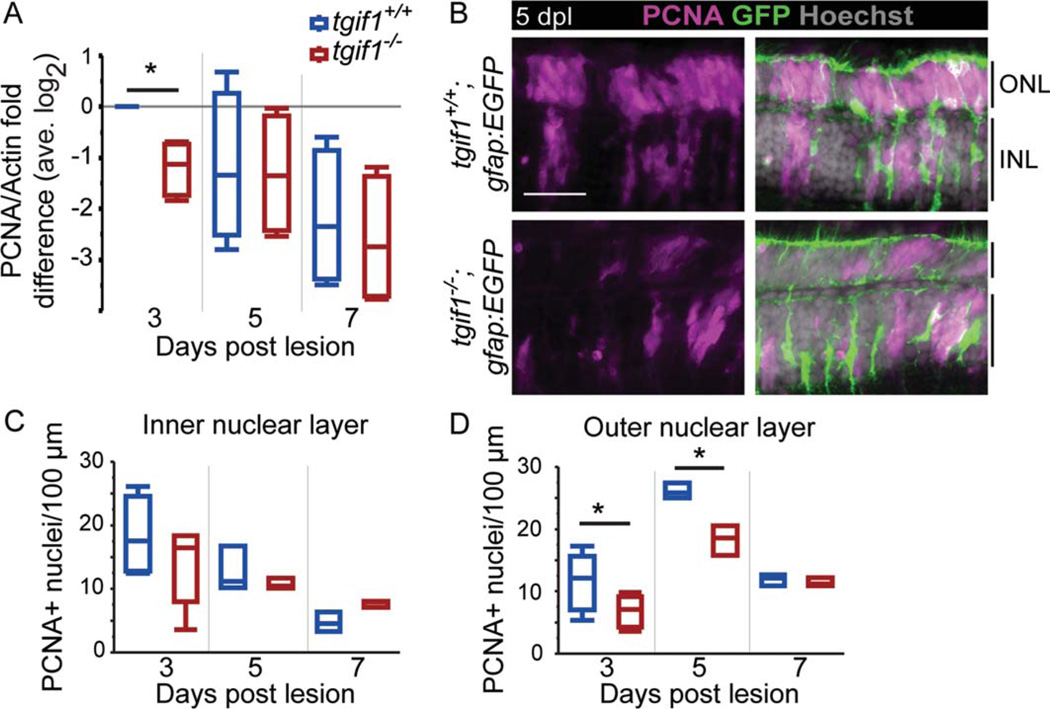
FIGURE 3.
Proliferation is reduced in tgif1−/− fish compared with tgif1+/+ fish. (A) Densitometric analysis of PCNA in Western blots normalized to actin and relative to 3 dpl tgif1+/+ (retinas pooled from two fish, n = 4 replicates). (B) Representative images of PCNA immu-noreactivity at 5 dpl in tgif1+/+ and tgif1−/− fish with the gfap:EGFP transgene. The average number of PCNA-positive nuclei in the INL (C) and ONL (D) in tgif1+/+ and tgif1−/− fish; 8–17 sections per fish; n = 5 at 3 dpl; n = 3 at 5 and 7 dpl. Scale bars=25 µm. * P<0.05, Student t-test comparing genotypes at the same lesion interval. Abbreviations as in Fig. 1.

