

Abstract
BACKGROUND AND PURPOSE
Tissue transglutaminase (TG2) has been shown to mediate cell survival in many cell types. In this study, we investigated whether the role of TG2 in cytoprotection was mediated by the activation of PKA and PKC in cardiomyocyte-like H9c2 cells.
EXPERIMENTAL APPROACH
H9c2 cells were extracted following stimulation with phorbol-12-myristate-13-acetate (PMA) and forskolin. Transglutaminase activity was determined using an amine incorporating and a protein crosslinking assay. The presence of TG isoforms (TG1, 2, 3) was determined using Western blot analysis. The role of TG2 in PMA- and forskolin-induced cytoprotection was investigated by monitoring H2O2-induced oxidative stress in H9c2 cells.
KEY RESULTS
Western blotting showed TG2 >> TG1 protein expression but no detectable TG3. The amine incorporating activity of TG2 in H9c2 cells increased in a time and concentration-dependent manner following stimulation with PMA and forskolin. PMA and forskolin-induced TG2 activity was blocked by PKC (Ro 31-8220) and PKA (KT 5720 and Rp-8-Cl-cAMPS) inhibitors respectively. The PMA- and forskolin-induced increases in TG2 activity were attenuated by the TG2 inhibitors Z-DON and R283. Immunocytochemistry revealed TG2-mediated biotin-X-cadaverine incorporation into proteins and proteomic analysis identified known (β-tubulin) and novel (α-actinin) protein substrates for TG2. Pretreatment with PMA and forskolin reversed H2O2-induced decrease in MTT reduction and release of LDH. TG2 inhibitors R283 and Z-DON blocked PMA- and forskolin-induced cytoprotection.
CONCLUSIONS AND IMPLICATIONS
TG2 activity was stimulated via PKA- and PKC-dependent signalling pathways in H9c2 cells These results suggest a role for TG2 in cytoprotection induced by these kinases.
Introduction
Transglutaminases (TGs) are a family of calcium (Ca2+)-dependent enzymes that catalyse the post-translational modification of proteins. Once Ca2+ binds to TG, a cysteine is exposed leading to the formation of a bond between ε-amide (as an isodipeptide or polyamine bond) and γ-carboxamide of protein-bound glutamine residues (Lorand and Conrad, 1984). There are eight distinct members of the TG family, which exhibit differential expression (Factor XIIIa and TGs 1–7; Griffin et al., 2002; Mhaouty-Kodja, 2004). Blood plasma TG (Factor XIIIa) is essential for the formation of fibrin clots, TG1 (keratinocyte TG) regulates keratinocyte differentiation, TG3 is expressed in the epidermal layer of the skin and also regulates keratinocyte differentiation, whereas TG4 is expressed in the prostate gland and is thought to play a role in mammalian fertility (Griffin et al., 2002; Mhaouty-Kodja, 2004).
The ubiquitously expressed transglutaminase 2 (TG2) is the most widely studied member of the TG family, which has been implicated in the regulation of a wide range of cellular processes, including cell adhesion, migration, growth, survival, apoptosis, differentiation and extracellular matrix organization (Nurminskaya and Belkin, 2012). The role of TG2 in cell survival and cell death is cell-specific with initial findings suggesting that TG2 was pro-apoptotic; however, more recent data indicate that TG2 has a role in cell survival (Piacentini et al., 2011). Dysregulation of TG2 has been implicated in much pathology, including celiac disease, neurodegenerative disorders, some cancers and as such represents a potential therapeutic target (Caccamo et al., 2010).
TG2 has been described as a molecular ‘Swiss army knife’ as it exhibits many enzymic functions that include transamidation, protein disulphide isomerase and PK activity (Gundemir et al., 2012). It also functions as a G-protein, which is independent of its TG activity; mediating signal transduction pathways triggered by several GPCRs including the α1B-adrenoceptor (Nakaoka et al., 1994). Interestingly, the activity of TG2 and other TG family members can be regulated by PKs. For example, phosphorylation of TG2 by PKA inhibits its transamidating activity but enhances its kinase activity (Mishra et al., 2007). The cross-linking activity of TG1 (keratinocyte TG) is enhanced by phorbol ester-induced stimulation of PKC and ERK1/2 (Bollag et al., 2005). Finally, PKC-δ has been shown to regulate TG2 expression in pancreatic cancer cells (Akar et al., 2007). Overall, these observations suggest that the activity and expression of specific TG isoenzymes can be regulated by PKA and PKC-dependent signalling pathways.
PKA and PKC are two major mediators of signal transduction pathways associated with cell survival (Yellon and Downey, 2003; Sanada et al., 2011). Interestingly, TG2 has been shown to mediate cell survival by regulating ATP synthesis in cardiomyocytes (Szondy et al., 2006). Similarly, increased TG2 expression protects neuronal cells from oxygen and glucose deprivation-induced cell death (Filiano et al., 2008). Given the evidence suggesting a role for TG2 in cytoprotection coupled with its regulation by PKs associated with cell survival, we hypothesize that TG2-mediated cytoprotective effects are modulated by PK activity. Therefore, one aim of this study was to explore the regulation of TG2 by PKA and PKC in the rat embryonic cardiomyoblast-derived H9c2 cell line (Kimes and Brandt, 1976). Although the regulation of TG isoenzymes by PKA and PKC has been studied in other cell lines (Bollag et al., 2005; Mishra et al., 2007) the regulation of TG2 has not been investigated in H9c2 cells. Therefore, the primary aims of this study were (i) to investigate the activation of TG2 in response to phorbol-12-myristate-13-acetate (PMA; a PKC activator) and forskolin (PKA activator), and (ii) to determine whether TG2 plays a role in PKC/PKA-mediated cytoprotection in H9c2 cells. The results obtained indicate that TG2 activity is increased in H9c2 cells treated with PKC and PKA activators. Furthermore, inhibition of TG2 activity attenuated PMA and forskolin-mediated cytoprotection against H2O2-induced oxidative stress.
Methods
Cell culture
Rat embryonic cardiomyoblast-derived H9c2 cells were obtained from the European Collection of Animal Cell Cultures (Porton Down, Salisbury, UK). These cells, derived from embryonic rat heart tissue (Kimes and Brandt, 1976), are increasingly used as an in vitro model since they display similar morphological, electrophysiological and biochemical properties to primary cardiac myocytes (Hescheler et al., 1991). Cells were cultured in DMEM supplemented with 2 mM L-glutamine, 10% (v/v) fetal calf serum and penicillin (100 U·mL−1)/streptomycin (100 μg·mL−1). Cells were maintained in a humidified incubator (95% air/5% CO2 at 37°C) until 70–80% confluent and sub-cultured (1:5 split ratio) using trypsin (0.05% w/v)/EDTA (0.02% w/v).
Treatment of cells with PK activators
H9c2 cells were cultured in 75 cm2 flasks until 80% confluent and then treated with 1 μM PMA or 10 μM forskolin for 1, 5, 10, 20 and 40 min. Stock concentrations of PMA (10 mM) and forskolin (10 mM) were dissolved in DMSO, which was present in all treatments including the control at a final concentration of 0.1% (v/v). For concentration-response determination, cells were incubated for 5 min with PMA (up to 1 μM) or forskolin (up to 10 μM).
Treatment of cells with PK inhibitors
All PK inhibitors were prepared as 10 mM stock solutions dissolved in DMSO and further diluted with DMEM to obtain final concentrations. H9c2 cells (80% confluent) were pre-incubated for 30 min in medium with or without the PKC inhibitor Ro 31-8220 (10 μM; Davis et al., 1989), and the PKA inhibitors KT 5720 (5 μM; Kase et al., 1987) and Rp-8-Cl-cAMPS (50 μM; de Wit et al., 1984) for 5 min prior to treatment with 1 μM PMA or 10 μM forskolin.
Cell extraction for measurement of TG2 activity
Following stimulation H9c2 cells were rinsed twice with 2.0 mL of chilled PBS, lysed with 500 μL of ice-cold lysis buffer (50 mM Tris-HCl pH 8.0, 0.5% (w/v) sodium deoxycholate, 0.1% (v/v) protease inhibitor cocktail and 1% (v/v) phosphatase inhibitor cocktail 2). Cell lysates were scraped and clarified by centrifugation at 4°C for 20 min at 14 000× g prior to being assayed for TG activity using the biotin-labelled cadaverine incorporation assay (see below). Supernatants were collected and stored at −20°C.
Protein estimation
The bicinchoninic acid protein assay, based on the method of Smith et al. (1985), was performed using a commercially available kit (Sigma-Aldrich, Gillingham, UK), with BSA as the standard.
TGactivity
This was monitored by two different assays; amine incorporation and protein cross-linking.
Biotin-labelled cadaverine incorporation assay
The assay was performed as per the method described by Slaughter et al. (1992) with modifications of Lilley et al. (1998). Briefly, 96-well microtitre plates were coated overnight at 4°C with 250 μL of N’,N'-dimethylcasein (10 mg·mL−1 in 100 mM Tris-HCl, pH 8.0). The plate was washed twice with distilled water and blocked with 250 μL of 3% (w/v) BSA in 0.1 M Tris-HCl, pH 8.0 and incubated for 30 min at 37°C. The plate was washed twice before the application of 150 μL 100 mM Tris-HCl pH 8.0 containing 225 μM biotin cadaverine (a widely used substrate to monitor TG amine incorporating activity) and 2 mM 2-mercaptoethanol and either 6.67 mM calcium chloride and or 13.3 mM EDTA (used to deplete calcium and inactivate TG). The reaction was started by the addition of 50 μL of samples or positive control (TG2 standard) and negative control (Tris buffer). After incubation for 1 h at 37°C plates were washed as before. Then, 200 μL of 100 mM Tris-HCl pH 8.0 containing ExtrAvidin-HRP (1:500 dilution) was added to each well and the plate incubated at 37°C for 45 min then washed as before. The plate was developed with 200 μL of freshly made developing buffer (7.5 μg·mL−1 3, 3’, 5, 5'-Tetramethylbenzidine and 0.0005% (v/v) H2O2 in 100 mM sodium acetate, pH 6.0) and incubated at room temperature for 15 min. The reaction was terminated by adding 50 μL of 5.0 M sulphuric acid and the absorbance read at 450 nm. One unit of TG2 was defined as a change in absorbance at 450 nm of 1.0 h−1. Each experiment was performed in duplicate.
Biotin-labelled peptide-cross-linking assay
The assay was performed according to the method of Trigwell et al. (2004) with minor modifications. Microtitre plates (96-well) were coated and incubated overnight at 4°C with casein at 1.0 mg·mL−1 in 100 mM Tris-HCl pH 8.0 (250 μL per well). The wells were washed twice with distilled water, before incubation at 37°C for 1 h with 250 μL of blocking solution [100 mM Tris-HCl pH 8.0 containing 3% (w/v) BSA]. The plate was washed twice before the application of 150 μL 100 mM Tris-HCl pH 8.0 containing 5 μM biotin-TVQQEL and 2 mM 2-mercaptoethanol and either 6.67 mM calcium chloride and or 13.3 mM EDTA. The reaction was started by the addition of 50 μL of samples or positive control (TG2 standard) and negative control (Tris buffer) and allowed to proceed for 1 h at 37°C. Reaction development and termination were performed as described for biotin cadaverine assays. One unit of TG2 was defined as a change in absorbance at 450 nm of 1.0 h−1. Each experiment was performed in duplicate.
Oxidative stress-induced cell death: PMA and forskolin-induced cytoprotection
H9c2 cells in fully supplemented DMEM were pretreated for 5 min with 1 μM PMA or 10 μM forskolin prior to 2 h exposure to 600 μM H2O2. Where appropriate, cells were also treated for 1 h with the cell-penetrating TG2 inhibitors Z-DON (150 μM) or R283 (200 μM) before the addition of PMA or forskolin. Medium containing PMA/forskolin and TG2 inhibitors was removed and replaced with fresh fully supplemented DMEM prior to H2O2 treatment.
MTT assay
H9c2 cells were plated in 24-well flat-bottomed plates (15 000 cells per well) and cultured for 24 h in fully supplemented DMEM. Cell viability was determined by measuring the metabolic reduction of (3-(4-5-dimethylthiazol-2-yl)-2,5-diphenyltetrazolium bromide) (MTT) to a coloured formazan product. Cells were incubated for 1 h in 0.5 mg·mL−1 MTT (in the absence of H2O2) after which the medium was removed and replaced with 200 μL DMSO. Absorbance was measured at 570 nm.
LDH assay
H9c2 cells were plated in 96-well flat-bottomed plates (5000 cells per well) and cultured for 24 h in fully supplemented DMEM. Following H2O2 exposure, the activity of LDH released into the culture medium was detected using the CytoTox 96® non-radioactive cytotoxicity assay (Promega, Southampton, UK). Assays were performed according to the manufacturer's instructions and monitored at 490 nm.
SDS-PAGE and Western blot analysis
To investigate the presence of TG2 and monitor ERK1/2 activation, protein extracts (50 μg per lane) were separated by SDS-PAGE (10% polyacrylamide gel) using a Bio-Rad Mini-Protean III system (Biorad Laboratories Ltd., Hemel Hamstead, UK). Proteins were transferred to nitrocellulose membranes in a Bio-Rad Trans-Blot system using 25 mM Tris, 192 mM glycine pH 8.3 and 20% (v/v) MeOH). Following transfer, the membranes were washed with Tris-buffered saline (TBS) and blocked for 1 h at room temperature with 3% (w/v) skimmed milk powder in TBS containing 0.1% (v/v) Tween-20. Blots were then incubated overnight at 4°C in blocking buffer with the following primary antibodies: anti-TG2 (CUB 7402; 1:1000), phospho-specific ERK1/2 (1:2000) and GAPDH (1:1000). The primary antibodies were removed and blots washed three times for 5 min in TBS/Tween 20. Blots were then incubated for 1 h at room temperature with the appropriate secondary antibody (1:1000) coupled to HRP (DAKO Ltd, Cambridge, UK) in blocking buffer. Following removal of the secondary antibody, blots were extensively washed as above and developed using the Ultra Chemiluminescence Detection System (Uptima, Interchim, France) and quantified by densitometry using Advanced Image Data Analysis Software (Fuji; version 3.52; Fujifilm UK, Ltd., Bedfordshire, UK). The uniform transfer of proteins to the nitrocellulose membrane was routinely monitored by transiently staining the membranes with Ponceau S stain prior to application of the primary antibody. Samples from each experiment were also analysed on separate blots using total unphosphorylated ERK1/2 and GAPDH primary antibodies in order to confirm the uniformity of protein loading.
Visualization of in situ TG2 activity
H9c2 cells were seeded on 8-well chamber slides (15 000 cells per well) and cultured for 24 h in fully supplemented DMEM. The medium was then removed, monolayer gently washed with PBS and slides incubated for 4 h with 1 mM biotin-X-cadaverine (a cell permeable TG2 substrate; Perry et al., 1995) before experimentation. Where appropriate cells were treated for 1 h with TG2 inhibitors Z-DON (150 μM) or R283 (200 μM) before the addition of 1 μM PMA or 10 μM forskolin. Following stimulation, cells were fixed with 3.7% (w/v) paraformaldehyde and permeabilized with 0.1% (v/v) Triton-X100 both in PBS for 15 min at room temperature. After washing, cells were blocked with 3% (w/v) BSA for 1 h at room temperature and the biotin-X-cadaverine-labelled protein substrates detected by (1:200 v/v) FITC-conjugated ExtrAvidin (Sigma-Aldrich). Nuclei were stained with DAPI and viewed using an epifluorescence microscope (Olympus BX51 with a DP70 Digital Camera System; Olympus UK, Ltd., Southend, UK).
Measurement of biotin-X-cadaverine incorporation into proteins serving as substrates for TG2
Cellular proteins acting as substrates for endogenous TG2-catalysed polyamine incorporation reactions was investigated as described by Singh et al. (1995). After incubation with 1 mM biotin-X-cadaverine the cells were treated with PMA or forskolin in the presence or absence of Z-DON as described above. The cell extracts (50 μg) were subjected to SDS-PAGE and transferred to nitrocellulose membrane. The biotinylated proteins were probed using ExtrAvidin HRP and visualized by enhanced chemiluminescence (ECL). In some experiments, biotinylated proteins were enriched using CaptAvidin™ agarose (Life Technologies Ltd., Paisley, UK) prior to SDS-PAGE.
Proteomic analysis of TG2 biotinylated substrate proteins
Following pretreatment with 1 mM biotin-X-cadaverine, Hc92 cells were treated with PMA and FK and extracted as described above. The proteins labelled with biotin-X-cadaverine were purified using CaptAvidin agarose (Life Technologies) prior to SDS-PAGE using a 4–20% gradient gel (Biorad Laboratories Ltd.). Protein bands were visualized using ‘Safe Blue’ protein stain (Expedeon, Harston, UK), excised from the gel and cut into small pieces using a sterile scalpel. The polyacrylamide pieces containing biotin cadaverine-labelled proteins were processed for trypsin digestion (trypsin gold; Promega, Southampton, UK). The peptides were concentrated using ZipTip-C18 columns (Millipore, Watford, UK) and the eluted peptides were spotted onto a MALDI-TOF sample plate prior to analysis using LC-MALDI-TOF (UltrafleXtreme, Bruker Daltonics Ltd., Coventry, UK). LC-fractions were controlled using WARP-LC software (version 3.2, Bruker Daltonics) and FlexControl software (version 3.3, Bruker Daltonics). Data acquired were searched against rat gene sequence database (UniProt) using MASCOT (version 2.3 server, Matrix Science Ltd., London, UK). To validate the identification of one protein transamidated by TG2, cell lysates were immunoprecipitated with anti α-actinin antibody (clone BM-75.2; Sigma-Aldrich) and precipitated proteins were separated by SDS-PAGE in a 10% (w/v) polyacrylamide gel, transferred to nitrocellulose, probed using ExtrAvidin HRP and visualized by ECL.
Statistical analysis
Results are presented as means ± SEM. Statistical analysis (one-way anova followed by Tukey's multiple comparison test and two-way anova for group comparison) was performed using GraphPad Prism® software (GraphPad Software, Inc., La Jolla, CA, USA). P < 0.05 was considered statistically significant.
Materials
Chelerythrine, Gö 6983 ({2-[1-(3-dimethylaminopropyl)-5-methoxyindol-3-yl]-3-(1H-indol-3-yl) maleimide}), H-89, KT 5720, Ro-31-8220 ({3-[1-[3-(amidinothio) propyl-1H-indol-3-yl]-3-(1-methyl-1H-indol-3-yl)maleimide bisindolylmaleimide IX, methanesulfonate}) and Rp-8-Cl-cAMPS (adenosine 3’,5'-cyclic monophosphorothioate, 8-chlro-, Rp-isomer) were purchased from Calbiochem (San Diego, CA, USA). Casein, forskolin, N’,N'-dimethylcasein, protease inhibitor cocktail, phosphatase inhibitor cocktail 2, purified standard guinea pig liver TG2 and ExtrAvidin® HRP were obtained from Sigma-Aldrich. PMA was obtained from Tocris Bioscience (Bristol, UK). The TG2 inhibitor Z-DON (Z-ZON-Val-Pro-Leu-OMe) was obtained from Zedira GmbH (Darmstadt, Germany). Biotin-TVQQEL was purchased from Pepceuticals (Enderby, UK). R283 was synthesized by Dr I Coutts at Nottingham Trent University. Biotin cadaverine (N-(5-aminopentyl)biotinamide), biotin-X-cadaverine (5-([(N-(biotinoyl)amino)hexanoyl]amino)pentylamine) and DAPI were purchased from Life Technologies. DMEM medium, fetal calf serum, trypsin (10×), L-glutamine (200 mM), penicillin (10 000 U·mL−1)/streptomycin (10 000 μg·mL−1) were purchased from BioWhittaker UK Ltd., Wokingham, UK. All other chemicals were of analytical grade. Antibodies were obtained from the following suppliers: monoclonal phospho-specific ERK1/2 (Thr202/Tyr204) from Sigma-Aldrich; monoclonal anti-TG2 (CUB 7402) from Abcam (Cambridge, UK), monoclonal anti-GAPDH from Santa Cruz Biotechnology Inc. (Dallas, TX, USA) and polyclonal anti-human keratinocyte TG1 and polyclonal anti-human epidermal TG3 from Zedira GmbH.
Results
Time-dependent effects of phorbol ester (PMA) and forskolin treatment on TG2-mediated biotin amine incorporation activity
Western blotting showed TG2 >> TG1 protein expression but no detectable TG3 (Figure 1). Initial experiments investigated the possible effect of PMA (a PKC activator) and forskolin (PKA activator) treatment on TG2 activity in H9c2 cardiomyoblasts. H9c2 cells were treated with 1 μM PMA or 10 μM forskolin and subjected to the biotin cadaverine amine incorporation assay (Slaughter et al., 1992). Exposure of cells to PMA or forskolin produced a statistically significant transient increase in TG2-catalysed biotin cadaverine incorporation activity peaking at 5–10 min (Figure 2). Since an increase in TG2 activity was observed at an early incubation time, cells were treated with different concentrations of PMA and forskolin for 5 min and subjected to biotin-labelled cadaverine incorporation assay. A gradual increase in TG2 activity was observed with increasing PMA (Figure 3A) or forskolin (Figure 3B) concentrations.
Figure 1.
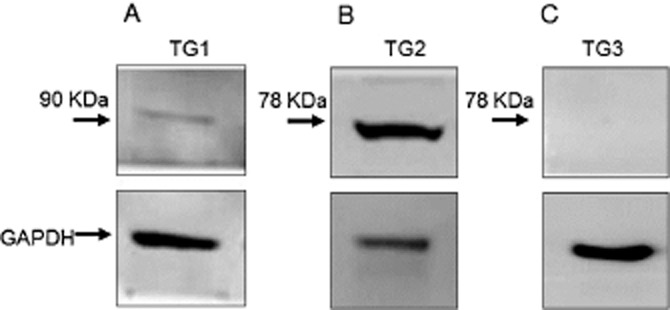
Protein expression of TG isoforms in H9c2 cells. Cell lysates (50 μg) were analysed for (A) TG1, (B) TG2 and (C) TG3 expression by Western blotting using TG isoform specific antibodies. Levels of GAPDH expression are included for comparison.
Figure 2.
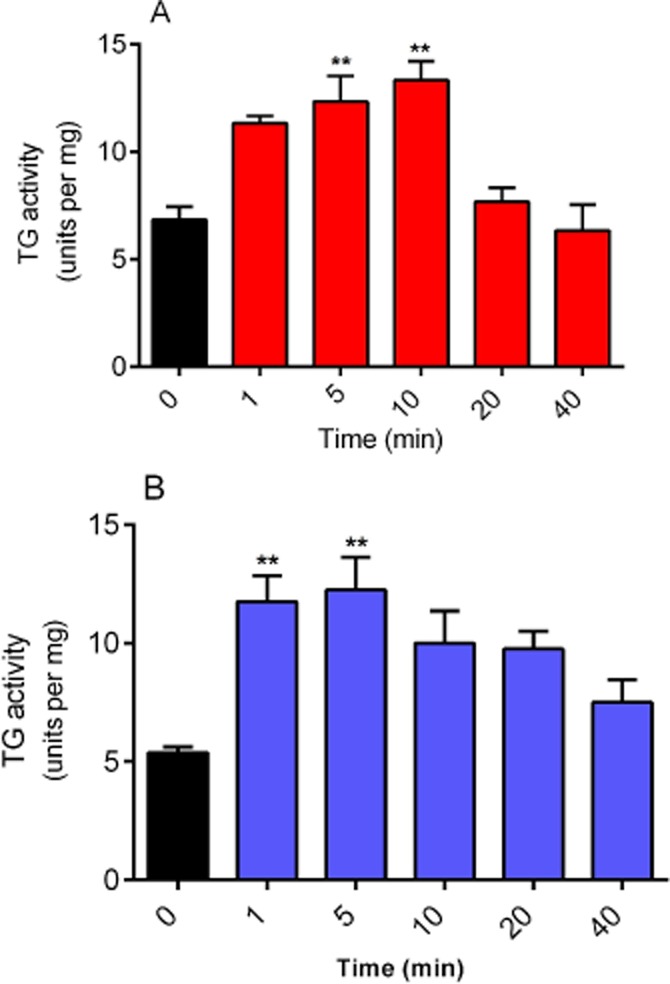
Time-dependent effects of phorbol ester and forskolin on TG activity. H9c2 cells were incubated with (A) 1 μM PMA or (B) 10 μM forskolin for indicated time periods and subsequently lysed with 0.1 M Tris buffer containing protease and phosphatase inhibitors. Cell lysates were then subjected to the biotin cadaverine incorporation assay. Data points represent the mean ± SEM TG-specific activity from three independent experiments. **P < 0.001 versus control.
Figure 3.
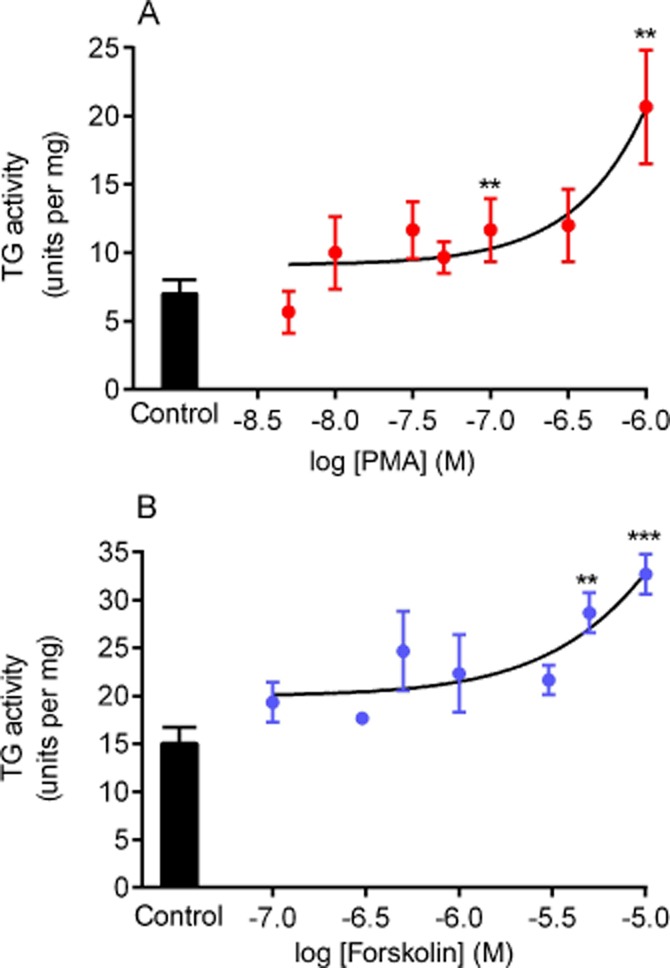
Concentration-dependent effects of phorbol ester and forskolin on TG activity. H9c2 cells were treated for 5 min with the indicated concentrations of (A) PMA or (B) forskolin and subsequently were lysed with 0.1 M Tris buffer containing protease and phosphatase inhibitors. Cell lysates were then subjected to the biotin cadaverine incorporation assay. Data points represent the mean ± SEM TG-specific activity from three independent experiments. ***P < 0.0001 and ** P < 0.001 versus control.
Time-dependent effects of phorbol ester and forskolin on TG2-mediated protein cross-linking activity
TG2 protein cross-linking activity in H9c2 cells was assayed in the presence of PMA or forskolin using the biotin-labelled peptide (biotin-TVQQEL) cross-linking assay (Trigwell et al., 2004). A time course exposure to 1 μM PMA (Figure 4A) did not produce any significant changes in TG2 protein cross-linking activity. In contrast, 10 μM forskolin induced a significant increase in TG2-mediated protein cross-linking activity after 20 min exposure (Figure 4B).
Figure 4.

Time-dependent effects of phorbol ester and forskolin on TG cross-linking activity using biotin-TVQQEL as a substrate. H9c2 cells were incubated with (A) 1 μM PMA or (B) 10 μM forskolin for indicated time period and subsequently lysed with 0.1 M Tris buffer containing protease and phosphatase inhibitors. Cell lysates were then subjected to the TG2 cross-linking assay. For comparison, purified guinea pig liver TG2 gave a specific activity of 15.96 ± 2.33 units·per mg under the same assay conditions in eight independent experiments. Data points represent the mean ± SEM TG-specific activity from four independent experiments. *P < 0.01 versus control.
The effects of PK activators and inhibitors on purified guinea pig liver TG activity
The direct effect of PMA and forskolin on TG2 activity was determined using the biotin cadaverine incorporation assay (Slaughter et al., 1992). As shown in Figure 5A, PMA and forskolin had no significant effect on guinea pig liver TG activity. The effect of PKA (H-89, KT 5720, Rp-8-Cl-cAMPS) and PKC (Gö 6983, chelerythrine, Ro 31-8220) inhibitors on purified guinea pig liver TG activity was also determined prior to accessing the ability of these inhibitors to attenuate PMA and forskolin-induced TG2 activity. As shown in Figure 5B, Gö 6983, chelerythrine and H-89 significantly inhibited purified TG2 activity negating their use in subsequent experiments.
Figure 5.
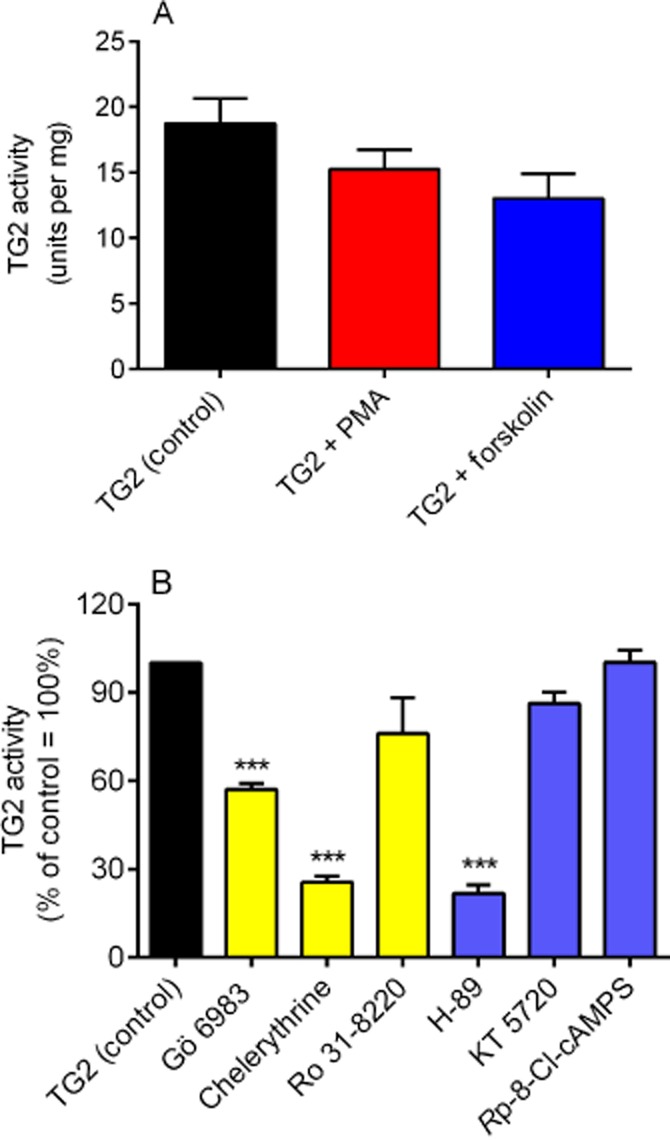
The effects of PK activators and inhibitors on purified guinea pig liver TG2 biotin cadaverine incorporation activity. (A) The effects PMA (1 μM) or forskolin (10 μM) and (B) PK inhibitors Gö 6983 (5 μM), Ro 31-8220 (10 μM), chelerythrine (1 μM), H-89 (1 μM), KT 5720 (5 μM) and Rp-8-Cl-cAMPS (50 μM) on guinea pig liver TG2 activity. Data points represent the mean ± SEM TG2-specific activity from four independent experiments ***P < 0.0001, **P < 0.001 versus control (guinea pig liver TG) activity.
Effect of PK inhibitors on PMA and forskolin-induced TG2 activity
Inhibitors of PKA and PKC were used to confirm the involvement of these kinases in PMA- and forskolin-stimulated TG2 activity. H9c2 cells were pretreated for 30 min with the PKC inhibitor Ro 31-8220 and the PKA inhibitors KT 5720 and Rp-8-Cl-cAMPS prior to 5 min exposure to PMA or forskolin. Cell lysates were subsequently screened for TG2 activity using the biotin cadaverine incorporation assay. Ro 31-8220 significantly reduced PMA- and forskolin-induced TG2-catalysed biotin cadaverine incorporation (Figure 6A and 6B). KT 5720 and Rp-8-Cl-cAMPS blocked forskolin-induced TG2 activity, but had no effect on PMA responses (data not shown), confirming the involvement of PKA (Figure 6C and 6D).
Figure 6.
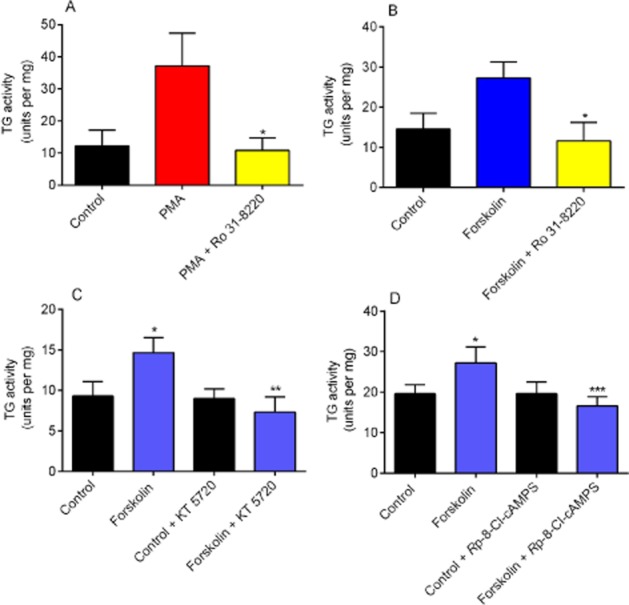
The effect of PKC and PKA inhibitors on PMA and forskolin-induced TG activity. H9c2 cells were pretreated for 30 min with the indicated PK inhibitors prior to stimulation for 5 min with 1 μM PMA or 10 μM forskolin. The effect of the PKC inhibitor Ro 31-8220 (10 μM) on (A) PMA and (B) forskolin-mediated TG2 activity. The effect of the PKA inhibitors (C) KT 5720 (5 μM) and (D) Rp-8-Cl-cAMPS (50 μM) on forskolin-mediated TG2 activity. Following stimulation, cell lysates were subjected to the biotin cadaverine incorporation assay. Data points represent the mean ± SEM TG-specific activity from five independent experiments. ***P < 0.0001, **P < 0.001, *P < 0.01 versus PMA- or forskolin-treated cells.
The effect of TG2 inhibitors on PMA and forskolin-induced TG2 activity
To confirm that TG2 is responsible for PMA and forskolin-stimulated transglutaminase activity in H9c2 cardiomyocytes, two structurally different cell permeable TG2-specific inhibitors were tested; R283 (a small molecule; Freund et al., 1994) and Z-DON (peptide-based; Schaertl et al., 2010). H9c2 cells were pretreated for 1 h with Z-DON (150 μM) or R283 (200 μM) prior to stimulation with PMA or forskolin for 5 min. As shown in Figure 7, Z-DON and R283 pretreatments completely blocked PMA and forskolin-induced TG amine incorporation activity, confirming the involvement of TG2 in these cell signalling responses. It is notable that the concentration-response curves obtained for R283 and Z-DON versus forskolin-stimulated TG activity only revealed significant inhibition at concentrations of 150 μM and 200 μM for R283 and 100 μM and 150 μM for Z-DON. Although these TG2 inhibitors are cell permeable, inhibition of cellular TG2 is only achieved at concentrations significantly above their IC50 value versus purified enzyme (Freund et al., 1994; Schaertl et al., 2010). However, these data justify the use of 200 μM (R283) and 150 μM (Z-DON) in investigating the intracellular activity of TG2 in H9c2 cells.
Figure 7.
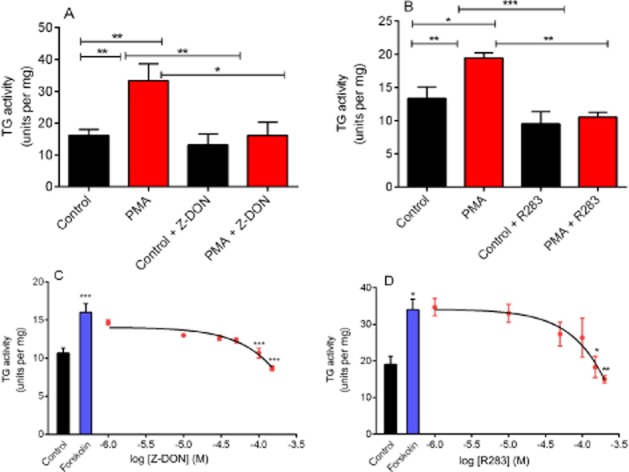
Effect of TG2 inhibitors on PMA and forskolin-induced TG2 activity. H9c2 cells were pretreated for 1 h with the TG2 inhibitors (A) Z-DON (150 μM) and (B) R283 (200 μM) prior to 5 min stimulation with PMA (1 μM). In panels C and D, cells were pretreated with the indicated concentrations of Z-DON and R283 prior to 5 min stimulation with forskolin (10 μM). Cells were subsequently lysed with 0.1 M Tris buffer containing protease and phosphatase inhibitors and cell lysates subjected to the biotin cadaverine incorporation assay. Data points represent the mean ± SEM TG-specific activity from three independent experiments. *P < 0.01, **P < 0.001 and ***P < 0.0001.
Visualization of in situ TG2 activity following PMA and forskolin treatment
Biotin-X-cadaverine, a cell-penetrating primary amine, acts as the acyl-acceptor in intracellular TG2-mediated transamidating reactions and becomes incorporated into endogenous protein substrates of TG2, which can subsequently be visualized by reporters such FITC- and HRP-ExtrAvidin (Lee et al., 1993). H9c2 cells were pre-incubated with 1 mM biotin-X-cadaverine for 4 h at 37°C prior to treatment with PMA or forskolin for 5, 10 or 20 min. After fixation and permeabilization, intracellular proteins with covalently attached biotin-X-cadaverine were visualized using ExtrAvidin FITC. As shown in Figure 8, PMA and forskolin-induced time-dependent increases in the incorporation of biotin-X-cadaverine into endogenous protein substrates of TG2. These data are comparable to the transient time-dependent increases in TG2 activity observed in vitro (see Figure 2). To confirm the involvement of TG2 activation, cells were treated with the TG2 inhibitor Z-DON (150 μM) 1 h prior to incubation with PMA or forskolin for 5 min. Pretreatment of cells with Z-DON resulted in the complete inhibition of biotin-X-cadaverine incorporation into protein substrates (Figure 8). Surprisingly, given the covalent nature of biotin-X-cadaverine incorporation, fluorescent staining returned to control levels after 20 min incubation with PMA and forskolin. To trace the missing biotinylated proteins, the culture medium was collected and concentrated prior to being subjected to SDS-PAGE followed by Western blotting. As shown in Figure 9, the rapid export of biotinylated proteins from H9c2 cells into the culture medium is evident following treatment of cells with PMA. Similar results were obtained with forskolin (results not presented). This observation is currently the focus of an ongoing investigation.
Figure 8.
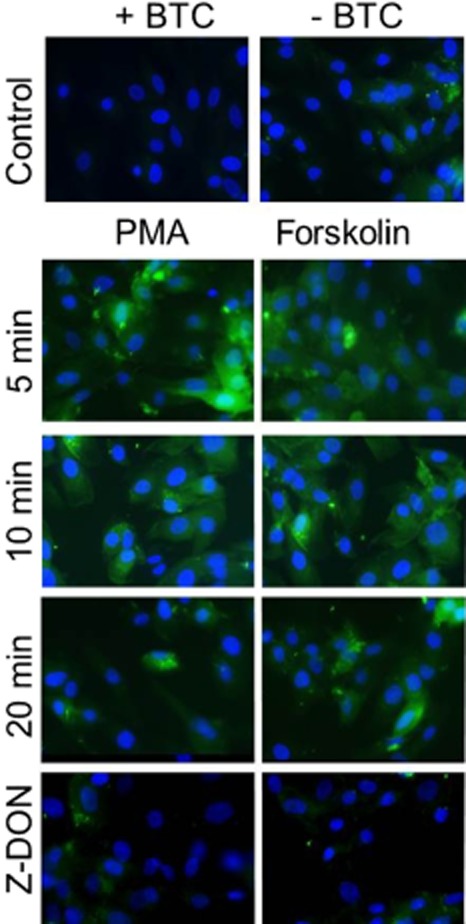
Immunocytochemistry of in situ TG activity in H9c2 cells following stimulation with PMA and forskolin. Cells were incubated with 1 mM biotin-X-cadaverine (BTC) for 4 h after which they were treated with either 1 μM PMA or 10 μM forskolin for 5, 10 or 20 min. Cells were also pretreated for 1 h with the TG2 inhibitor Z-DON (150 μM) before the addition of 1 μM PMA or 10 μM forskolin for 5 min (bottom panels). TG2-mediated biotin-X-cadaverine incorporation into intracellular proteins was visualized using FITC-conjugated ExtrAvidin (green). Nuclei were stained with DAPI (blue) and viewed using an epifluorescence microscope (40× magnification). Images presented are from one experiment and representative of three.
Figure 9.
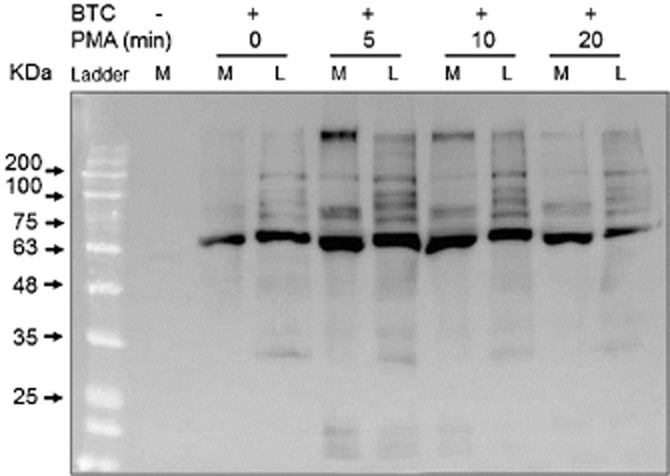
Detection of biotinylated TG2 protein substrates in the cell lysate and culture medium. Cells were incubated with 1 mM biotin-X-cadaverine (BTC) for 4 h after which they were treated with 1 μM PMA for the indicated periods of time. After stimulation, the biotinylated proteins in the cell culture medium (M) and cell lysates (L) were captured and eluted from CaptAvidin agarose. The biotinylated proteins were subjected to 10% SDS-PAGE, transferred to nitrocellulose membranes and detected using ExtrAvidin HRP. Similar results were obtained in three independent experiments.
To detect the TG2 biotinylated protein substrates from PMA and forskolin-treated cells, whole cell extracts were resolved by SDS-PAGE, transferred onto nitrocellulose membranes and visualized by probing with ExtrAvidin HRP. Figure 10 shows that treatment with PMA and forskolin for 5 min increased the incorporation of biotin-X-cadaverine into several proteins of different molecular masses in H9c2 cells. As expected, the incorporation of biotin-X-cadaverine into TG2 protein substrates was inhibited by pretreatment with Z-DON.
Figure 10.
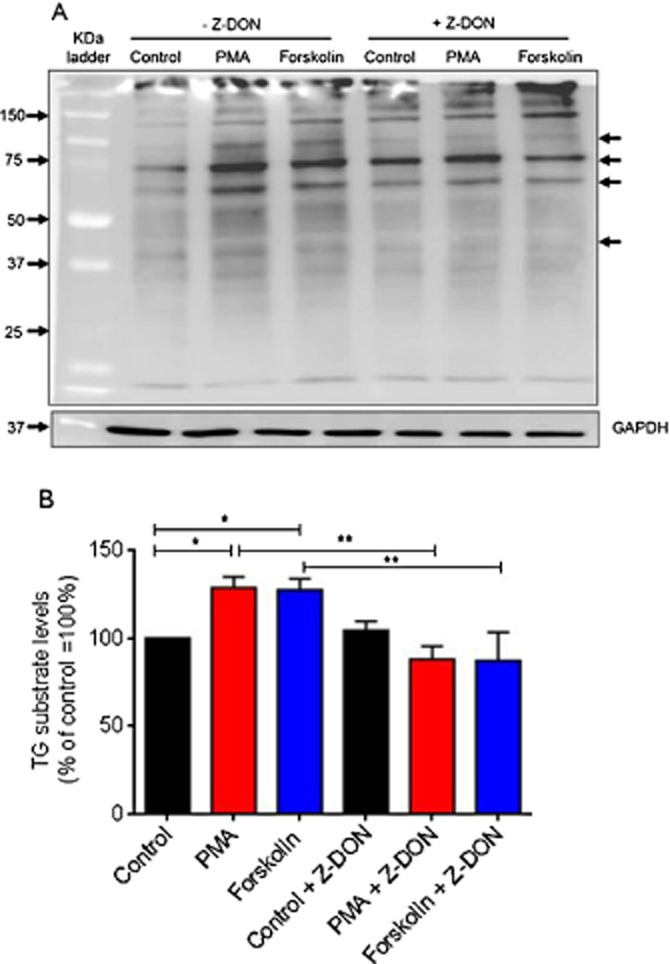
Detection of in situ TG activity and protein substrates in PMA and forskolin-treated H9c2 cells. Cells were incubated with 1 mM biotin-X-cadaverine for 4 h after which they were treated for 1 h with the TG2 inhibitor Z-DON (150 μM) before the addition of 1 μM PMA or 10 μM forskolin for 5 min. The total protein extract was resolved by 10% SDS-PAGE (50 μg per lane) and transferred onto nitrocellulose membranes. (A) TG2 transamidating activity and protein substrates were detected using ExtrAvidin HRP. Samples were subsequently analysed on a separate blot using an anti-GAPDH antibody as a control for protein loading. The arrows point to prominently biotin ExtrAvidin-labelled proteins. (B) Densitometry of each lane (total labelled protein) was carried out in Adobe Photoshop CS4 and the data is expressed as the percentage of basal TG2 substrate proteins after GAPDH normalization. Values are means ± SEM of three independent experiments *P < 0.01 and **P < 0.001.
Identification and validation of biotinylated TG2 substrates
Following PMA treatment of H9c2 cells, biotinylated proteins were captured using CaptAvidin agarose and then separated by SDS-PAGE electrophoresis on a 4–20% gradient gel followed by MALDI-TOF analysis of the peptides produced by trypsin digestion. Mass spectrometry analysis revealed novel protein substrates for TG2, such as the voltage-dependent anion channel 1 (VDAC1) and α-actinin-1, as well some previously identified substrates such as β-tubulin (Table 1). α-Actinin was chosen for validation by immunoprecipitation, SDS-PAGE and Western blot analysis. Incorporation of the biotinylated amine into α-actinin was revealed using ExtrAvidin HRP and visualized by ECL as shown in Figure 11. These data confirm that this cytoskeletal protein is a substrate for TG2 polyamine incorporating activity following stimulation of H9c2 cells with PMA or forskolin.
Table 1.
Functional classification of identified TG2 protein substrates
| Functional group | Proteins | SC (%) |
|---|---|---|
| Cytoskeletal | α-actinin-1 | 26 |
| β-tubulin | 31 | |
| myosin 9 | 31 | |
| actin cytoplasmic 1 | 29 | |
| tropomyosin | 29 | |
| vimentin | 21 | |
| prelamin | 22 | |
| Protein folding | Heat shock protein 90-α | 26 |
| Heat shock protein 90-β | 22 | |
| Heat shock cognate 70 | 24 | |
| Melactin | 28 | |
| Serpin H1 | 31 | |
| Mitochondrial | Prohibitin-2 | 39 |
| Voltage-dependent anion channel 1 (VDAC1) | 44 | |
| Endosome vesicle trafficking | Arf GAP ASAP1 | 23 |
| Ras-related protein Rab-35 | 30 |
H9c2 cells were pre-incubated with biotin-X-cadaverine prior to treatment with PMA (1 μM) and the biotinylated proteins were captured and were analysed by MALDI-TOF MS/MS. Sequence data was analysed using MASCOT software and reported according to percentage sequence coverage (SC%). All identified proteins exhibited MASCOT scores, which were considered statistically significant (P < 0.05). Protein substrates are grouped according to their functions and/or cellular location and novel TG2 targets not appearing in the TG2 substrate database are indicated in italics (Csósz et al., 2009).
Figure 11.
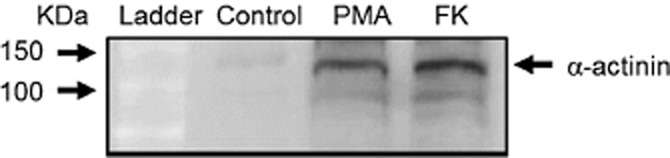
Detection of biotin-X-cadaverine incorporation into α-actinin following PMA and forskolin treatment of H9c2 cells. Cells were incubated with 1 mM biotin-X-cadaverine for 4 h after which they were treated with 1 μM PMA or 10 μM forskolin for 5 min. Control cells were incubated with biotin-X-cadaverine but not stimulated with PMA or forskolin. Cell lysates were incubated with anti α-actinin antibody and the resulting immunoprecipitate subjected to SDS-PAGE, transferred to nitrocellulose membrane and detected using ExtrAvidin HRP. Similar results were obtained in three independent experiments.
The role of TG2 in PMA and forskolin-induced cytoprotection
Previous studies have shown that TG2 protects cardiomyocytes from ischaemia/reperfusion-induced injury (Szondy et al., 2006). Since PKC and PKA are two key mediators of ischaemic preconditioning and pharmacological preconditioning in cardiomyocytes (Yellon and Downey, 2003; Sanada et al., 2011), we investigated the role of TG2 in PMA- and forskolin-induced cytoprotection against oxidative stress in H9c2 cardiomyoblasts. Oxidative stress was induced by stimulating H9c2 cells with H2O2 (600 μM for 2 h), after which cell damage was assessed by monitoring MTT reduction and LDH activity released into the medium (Fretwell and Dickenson, 2009). As shown in Figure 12, 5 min pretreatment with PMA (1 μM) or forskolin (10 μM) significantly reversed H2O2-induced reduction of MTT metabolism and release of LDH. The TG2 inhibitor R283 (200 μM) reversed PMA and forskolin-induced cytoprotection suggesting a protective role for TG2 in PKC and PKA-induced cell survival. Similarly, the TG2 inhibitor Z-DON (150 μM) also reversed PMA and forskolin-induced cytoprotection confirming the protective role of TG2 against H2O2-induced cell damage in H9c2 cells (Figure 13). The reversal of PMA and forskolin-induced cytoprotection by R283 and Z-DON may be a consequence of these TG2 inhibitors possessing PKC/PKA inhibitory activity. To address this important consideration, we determined the effect of R283 and Z-DON on PMA- and forskolin-induced ERK1/2 activation. As shown in Figure 14, pretreatment of H9c2 cells with R283 had no significant effect on PMA- or forskolin-induced ERK1/2 activation. Similarly, Z-DON did not reverse PMA- or forskolin-induced ERK1/2 activation (Figure 15). These data suggest that R283 and Z-DON do not function as inhibitors of PKC or PKA.
Figure 12.
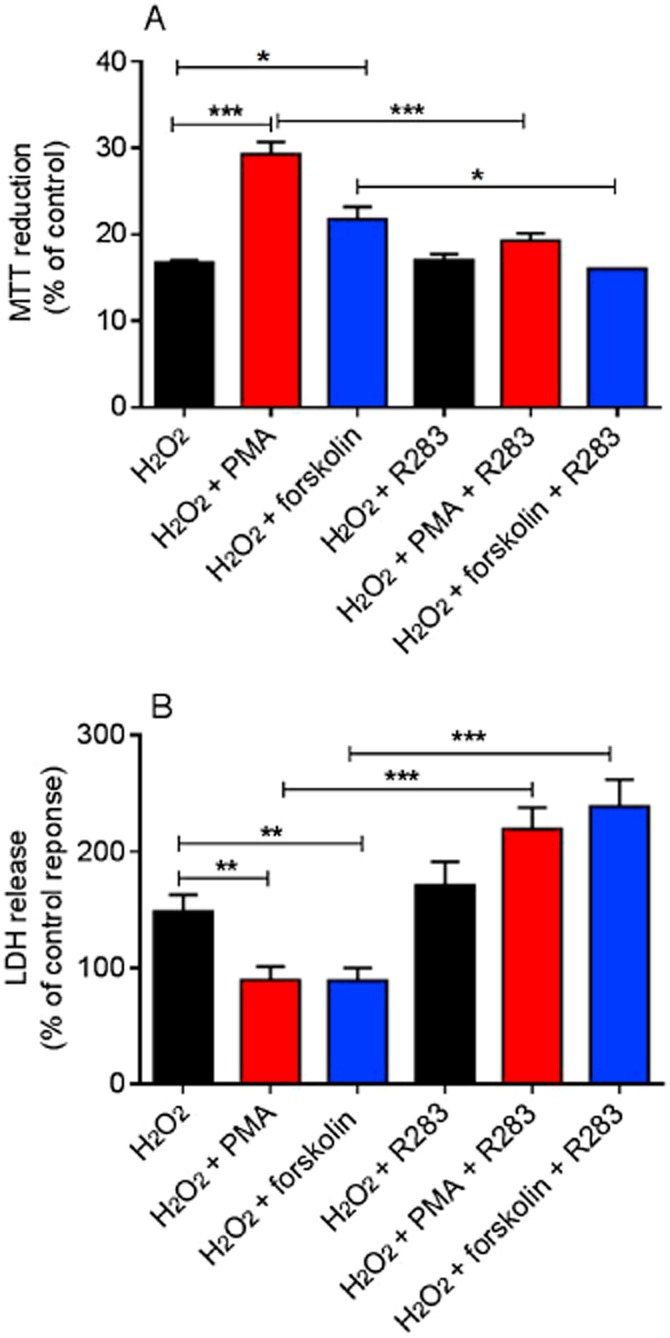
The effect of the TG2 inhibitor R283 on PMA and forskolin-mediated cytoprotection against H2O2-induced cell death. H9c2 cells were treated with PMA (1 μM) or forskolin (10 μM) for 5 min followed by H2O2 (600 μM) for 2 h in presence or absence of the TG2 inhibitor R283 (200 μM). Cell viability was assessed by measuring (A) the metabolic reduction of MTT by mitochondrial dehydrogenases and (B) the release of LDH into the culture medium. Data are expressed as the percentage of control cells (=100%) and represent the mean ± SEM from (A) four independent experiments each performed in triplicate and (B) six independent experiments each performed in quadruplicate. *P < 0.01, **P < 0.001 and ***P < 0.0001.
Figure 13.
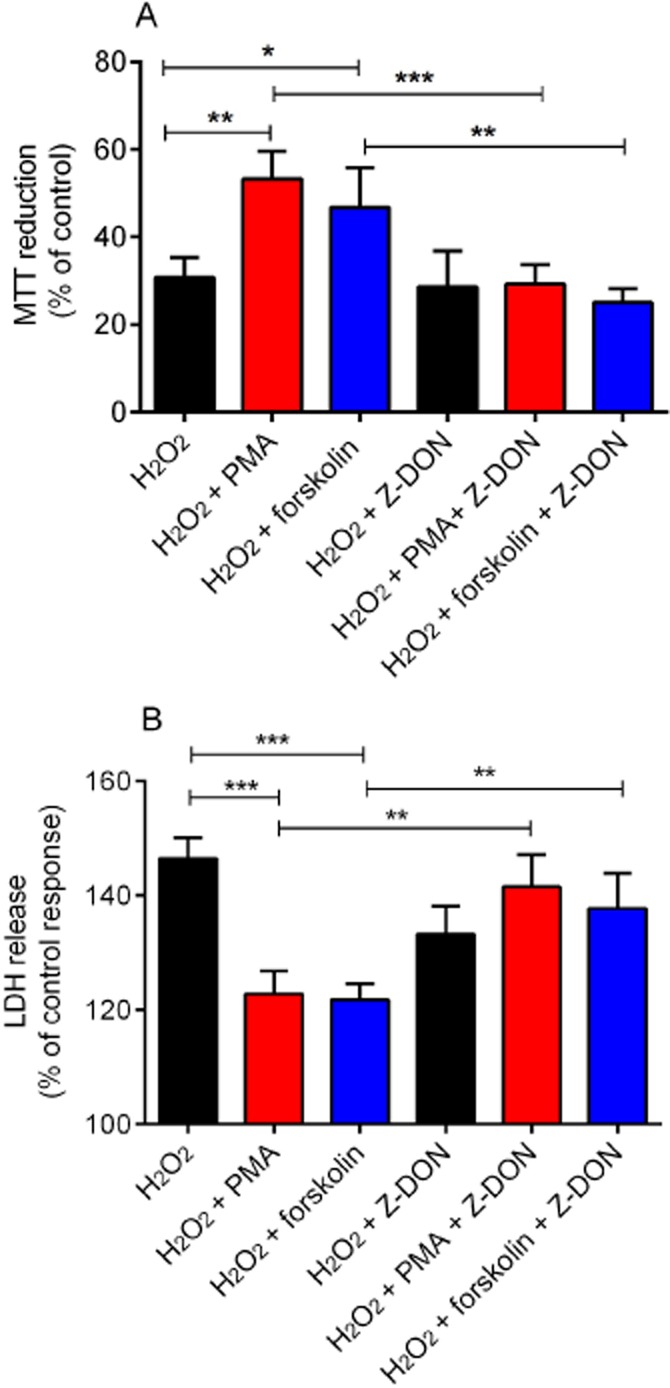
The effect of the TG2 inhibitor Z-DON on PMA and forskolin-mediated cytoprotection against H2O2-induced cell death. H9c2 cells were treated with PMA (1 μM) or forskolin (10 μM) for 5 min followed by H2O2 (600 μM) for 2 h in presence or absence of the TG2 inhibitor Z-DON (150 μM). Cell viability was assessed by measuring (A) the metabolic reduction of MTT by cellular dehydrogenases and (B) the release of LDH into the culture medium. Data are expressed as the percentage of control cells (=100%) and represent the mean ± SEM from (A) five independent experiments each performed in triplicate and (B) four independent experiments each performed in quadruplicate. *P < 0.01, **P < 0.001 and ***P < 0.0001.
Figure 14.
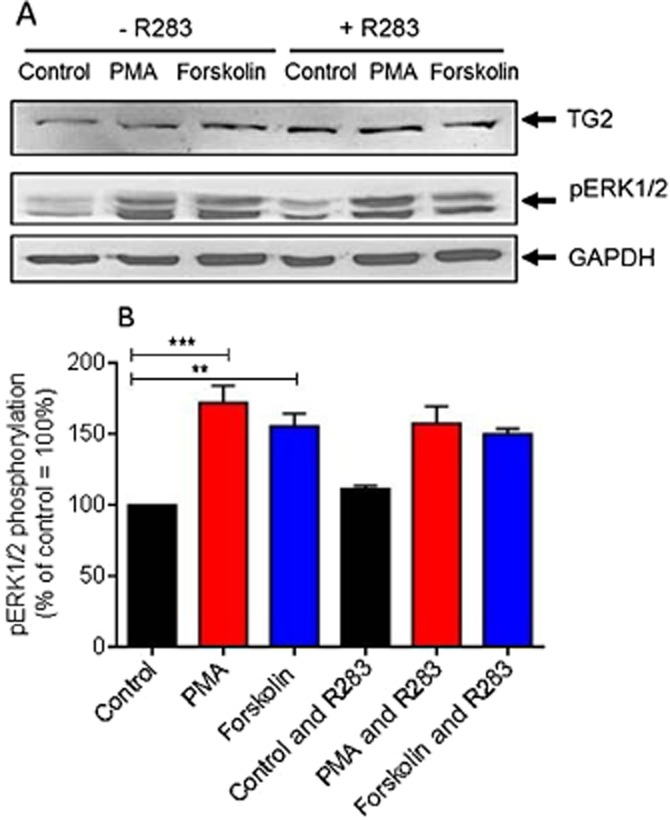
The effect of the TG2 inhibitor R283 on PMA- and forskolin-induced ERK1/2 activation. (A) H9c2 cells were pretreated for 1 h with the TG2 inhibitor R283 (200 μM) prior to 5 min stimulation with PMA (1 μM) or forskolin (10 μM). Following PMA and forskolin exposure, cell lysates were analysed by Western blotting for activation of ERK1/2 using a phospho-specific antibody. Samples were also analysed on separate blots using antibodies that recognize TG2 and GAPDH (to confirm equal protein loading). (B) Quantified data are expressed as the percentage of control cells (=100%) and represent the mean ± SEM of three independent experiments. **P < 0.001 and ***P < 0.0001.
Figure 15.
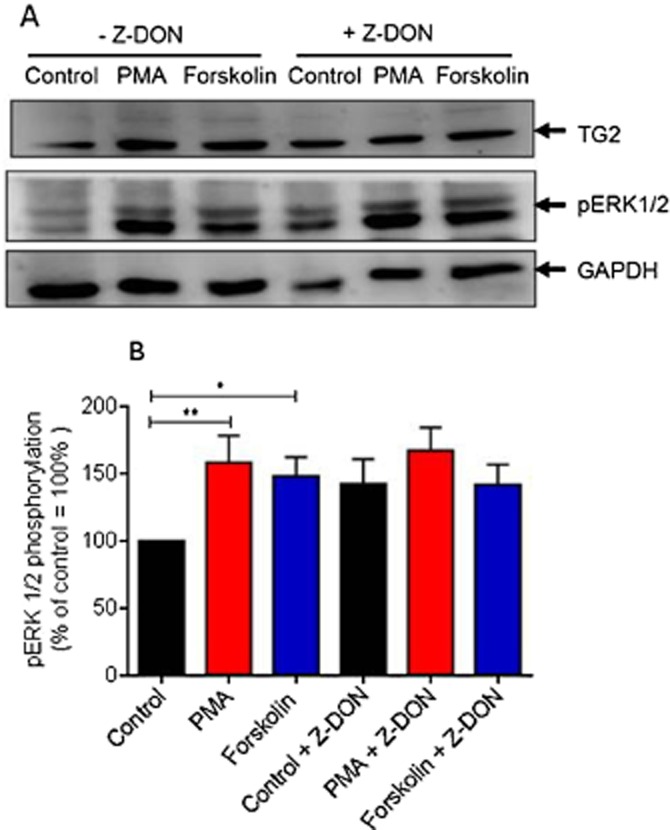
The effect of the TG2 inhibitor Z-DON on PMA and forskolin-induced ERK1/2 activation. (A) H9c2 cells were pretreated for 1 h with the TG2 inhibitor Z-DON (150 μM) prior to 5 min stimulation with PMA (1 μM) or forskolin (10 μM). Following PMA and forskolin exposure, cell lysates were analysed by Western blotting for activation of ERK1/2 using a phospho-specific antibody. Samples were also analysed on separate blots using antibodies that recognize TG2 and GAPDH (to confirm equal protein loading). (B) Quantified data are expressed as the percentage of control cells (=100%) and represent the mean ± SEM of five independent experiments. *P < 0.01 and **P < 0.001.
Discussion
The data presented here suggest that TG2 activity is modulated in H9c2 cells by PMA- and forskolin-mediated signalling pathways, and that its inhibition blocks PMA- and forskolin-mediated cytoprotection.
In vitro modulation of TG2 by PKC- and PKA-dependent signalling
TGs are regulated by PKA and PKC in non-cardiomyocyte cell types (Bollag et al., 2005; Mishra et al., 2007). However, the regulation of TG2 by PKA- and PKC-dependent signalling in cardiomyocyte-like cells has not been reported. Hence, the regulation of TG2 by these pathways was investigated in H9c2 cells treated with PMA and forskolin. Both cell signalling activators triggered time- and concentration-dependent increases in TG2-mediated biotin cadaverine incorporation in H9c2 cells (Figures 2 and 3). Forskolin but not PMA also induced a time-dependent increase in TG2-mediated cross-linking activity (Figure 4). These observations suggest a differential regulation of TG2's amine incorporation and protein cross-linking activities by PKA and PKC-dependent pathways. It is also notable that PKA-induced protein cross-linking activity lags at least 10 min behind PKA-induced biotin cadaverine incorporation. At present, the regulation of TGs multiple enzymic activities is unknown but this data does suggest a switch at 20 min from amine incorporation to protein cross-linking.
TGs can catalyse two types of cross-linking, namely (i) intra- and/or inter-molecular covalent cross-links between protein-bound glutamine and protein-bound lysine residues, and (ii) cross-links between primary amines and protein-bound glutamine. The regulation of TG2 activity in H9c2 cells by forskolin is in agreement with previous studies showing that TG2 becomes phosphorylated at Ser216 following PKA activation (Mishra and Murphy, 2006). Phosphorylation of TG2 by PKA has several consequences, including the promotion of protein–protein interactions, enhancement of TG2 kinase activity and inhibition of cross-linking activity (Mishra and Murphy, 2006; Mishra et al., 2007). However, in our study, forskolin treatment enhanced TG2-mediated cross-linking activity. The inhibition of TG2 cross-linking activity reported by Mishra et al. (2007) was observed using histidine-tagged TG2 immobilized on nickel-agarose and incubated with the catalytic subunit of PKA, whereas in our study, cells were treated with forskolin prior to measurement of TG2 cross-linking activity. The effects of forskolin on TG2 observed in our study may be PKA independent, since forskolin triggers an increase in ERK1/2 phosphorylation (Figure 13).
Importantly, PMA- and forskolin-stimulated TG activity in H9c2 cardiomyoblasts was inhibited by R283 and Z-DON, two structurally different TG2 inhibitors (Freund et al., 1994; Schaertl et al., 2010) confirming the involvement of TG2 (Figure 7). Although the expression of TG2 is regulated by PKC-δ in pancreatic cancer cells (Akar et al., 2007), there are no published data regarding the regulation of TG2 activity by PKC-dependent pathways. Hence, our data show, for the first time that TG2-mediated amine incorporation can be stimulated following treatment of cells with the PKC activator PMA. Similar effects were observed for TG1 following phorbol ester-induced PKC activation in keratinocytes (Bollag et al., 2005). Interestingly, TG1 activation by phorbol esters is sensitive to the MEK1 inhibitor PD98059, suggesting the involvement of ERK1/2 in this phenomenon (Bollag et al., 2005). Future experiments will explore the potential involvement of ERK1/2 and other downstream PKs in PMA-induced TG2 activation.
To confirm the involvement of PKA and PKC in forskolin- and PMA-mediated TG2 activation, inhibitors for these kinases were tested for their ability to block PMA- or forskolin-induced TG2 activity. PKC inhibitors Gö 6983 and chelerythrine and the PKA inhibitor H-89 reduced the activity of purified TG2, indicative of a direct interaction with TG2, thus negating their further use (Figure 5B). Although the PKC inhibitor Ro-318220 attenuated PMA-induced TG2 activity, it is unclear as to why this PKC inhibitor blocked forskolin-induced TG2 activity (Figure 6A), since it does not attenuate PKA activity (Davies et al., 2000). Further studies will investigate the ability of a wider range of PKC inhibitors to modulate purified TG2 activity and also to inhibit PMA-induced TG2 activity in H9c2 cells. Finally, the PKA inhibitors KT 5720 and Rp-8-Cl-cAMPS blocked forskolin-induced TG2 activity confirming the involvement of PKA in forskolin-mediated responses (Figure 6C and 6D).
In situ modulation of TG2 activity and detection of TG2 protein substrates
As treatment of H9c2 cells with PMA or forskolin caused elevated TG2 activity in cell lysates, immunocytochemistry was used to visualize in situ TG2 activity. The results were comparable to PMA- and forskolin-induced amine incorporation activity observed in vitro (Figure 2). However, given the covalent nature of biotin-X-cadaverine incorporation into protein substrates, it was surprising to observe that in situ TG2 activity returned to basal levels after 20 min (Figure 8). Possible explanations of this result include reversal of biotinylation by TG (Stamnaes et al., 2008), biotinylated proteins were targeted for degradation or that they were rapidly expelled from the cell. Figure 9 suggests that the biotinylated proteins are rapidly expelled from the cell since they are detected in the culture medium. However, we cannot rule out the possibility that the suggested mechanisms happen concurrently and this interesting result warrants further investigation.
In order to determine the electrophoretic profile of proteins targeted by TG2, cell lysates from PMA- and forskolin-treated cells were subjected to SDS-PAGE and Western blotting, then proteins covalently labelled with biotin-X-cadaverine in situ were visualized using ExtrAvidin HRP. Several proteins displayed increased incorporation of biotin-X-cadaverine following PMA and forskolin treatment (Figure 10). Proteomic analysis following in vivo biotin-X-cadaverine labelling revealed a number of biotin-labelled proteins (Table 1). These proteins appear to be mainly cytoskeletal, heat shock, mitochondrial and endomembrane fusion proteins. These data support a role for TG2 in cytoprotective mechanisms as it provides stabilization of the cytoskeletal network and modifies proteins, which enhance cell survival, for example, heat shock protein 90 and suppress apoptosis, for example, VDAC1 (Keinan et al., 2010).
Role of TG2 in PMA- and forskolin-induced cytoprotection
As TG2 activity appeared to be regulated by PKs associated with cell survival, we investigated whether TG2 was involved in PMA- and forskolin-induced cytoprotection. These data provide the first demonstration that inhibition of TG2 activity attenuates PMA- and forskolin-mediated cell survival (Figures 11 and 12). However, both PMA and forskolin-induced ERK1/2 activation in H9c2 cells (Figures 13 and 14). As the ERK1/2 pathway is a prominent PK associated with cardioprotection (Hausenloy and Yellon, 2004), the cytoprotective effects of PMA and forskolin observed in H9c2 cells may involve ERK1/2. Clearly, further studies investigating the effect of inhibitors of PKA, PKC and ERK1/2 would confirm/eliminate the involvement of these particular kinases in PMA- and forskolin-mediated cytoprotection in H9c2 cells.
Despite the uncertainty surrounding the identity of the PKs involved in PMA- and forskolin-induced cytoprotection of H9c2 cells, our findings suggest that TG2 activation is involved in their cytoprotective actions. H9c2 cells, which are derived from embryonic rat heart tissue (Kimes and Brandt, 1976), are increasingly used as an in vitro model since they display similar morphological, electrophysiological and biochemical properties to primary cardiac myocytes (Hescheler et al., 1991). However, the use of H9c2 cells clearly has its limitations when making assumptions with about the potential in vivo role of TG2 in cardioprotection. Although identifying the mechanism(s) associated with TG2-mediated cytoprotection are beyond the scope of the present study, it is important to consider the potential mechanism(s) underlying the cytoprotective function of TG2. Phosphorylation of TG2 by PKA in non-cardiomyocyte cell lines has several consequences, including the enhancement of protein–protein interactions and TG2 kinase activity, both of which may underlie its protective role (Mishra and Murphy, 2006; Mishra et al., 2007). For example, phosphorylation of TG2 at Ser216 by PKA creates a binding site for the adaptor protein 14-3-3 (Mishra and Murphy, 2006), which regulates diverse cellular functions including signalling pathways associated with cell survival (Mackintosh, 2004). Although not linked with PKA phosphorylation and independent of its transamidating activity, TG2-mediated protection of neuronal cells against hypoxia and glucose deprivation-induced cell death involves TG2 interaction with hypoxia inducible factor 1β (HIF1β), which attenuates HIF1 signalling (Filiano et al., 2008). Further work to identify TG2 interacting proteins in cardiomyocytes following stimulation with PMA and forskolin would be worthwhile.
TG2 also functions as a serine/threonine kinase that can phosphorylate insulin-like growth factor-binding protein 3, p53 and retinoblastoma protein (Gundemir et al., 2012). Since p53 and retinoblastoma protein are important regulators of apoptosis, it is conceivable that they are associated with TG2-induced cytoprotection. As the anti-apoptotic effects of TG2 involve the cross-linking of retinoblastoma protein (Boehm et al., 2002), it would be interesting to determine if retinoblastoma protein is a TG2 substrate in H9c2 cells. Finally, the phosphorylation of TG2 by PKA in mouse embryonic fibroblast cells plays an important role in TG2-mediated activation of NF-κB and PKB (Wang et al., 2012). Both these signalling pathways are associated with cardioprotection (Misra et al., 2003; Hausenloy and Yellon, 2007) and may be regulated by TG2 in forskolin-stimulated H9c2 cells. Thus, TG2 is capable of triggering pro-cell survival pathways relevant to cardioprotection that are either independent of its transamidating activity, require prior phosphorylation by PKA or rely on its PK function.
Here we show that TG2 activation prior to H2O2-induced oxidative stress is cytoprotective. It has been suggested that oxidative stress promotes the up-regulation of TG2, which, depending on a number of factors including cell type, may promote cell survival or apoptosis (Caccamo et al., 2012). Interestingly, oxidative stress up-regulates TG2 expression in rat neonatal cardiomyocytes contributing to H2O2-induced apoptosis (Song et al., 2011). We also observed increased TG2 activity in H9c2 cells following H2O2 stimulation (600 μM for 2 h; data not shown). Activation of TG2 may therefore promote cell survival if occurring prior to an oxidative insult but participates in cell death when activated afterwards. Future experiments will seek to address this potential dual role of TG2.
In conclusion, our data suggest that TG2 activity is regulated via PKC- and PKA-dependent signalling and that TG2 modulates PMA- and forskolin-mediated cytoprotection, suggesting a cell survival role for TG2 in H9c2 cells. Work to identify the potential cytoprotective mechanism(s) of TG2 is currently underway.
Acknowledgments
This work was supported by a PhD studentship from the Saudi Arabian Government (S2532). We would like to thank Dr David Boocock (Jon van Geest Cancer Research Centre, Nottingham Trent University, UK) for help in the proteomic analysis of samples.
Glossary
- MTT
(3-(4-5-dimethylthiazol-2-yl)-2,5-diphenyltetrazolium bromide)
- PMA
phorbol-12-myristate-13-acetate
- TG2
transglutaminase type 2
Author contributions
Ibtesam Almami is working on the project and has acquired the data for her PhD. She also contributed to the manuscript by providing a first draft. Philip L. R. Bonner, John M. Dickenson and Alan J. Hargreaves have jointly supervised Ibtesam's project contributing to the conception and design of the experiments, analysis and interpretation of the data, and to the drafting and editing the manuscript.
Conflict of interest
The authors state no conflict of interest.
References
- Akar U, Ozpolat B, Mehta K, Fok J, Kondo Y, Lopez-Berestein G. Tissue transglutaminase inhibits autophagy in pancreatic cancer cells. Mol Cancer Res. 2007;5:241–249. doi: 10.1158/1541-7786.MCR-06-0229. [DOI] [PubMed] [Google Scholar]
- Boehm JE, Singh U, Combs C, Antonyak MA, Cerione RA. Tissue transglutaminase protects against apoptosis by modifying the tumor suppressor protein p110 rb. J Biol Chem. 2002;277:20127–20130. doi: 10.1074/jbc.C200147200. [DOI] [PubMed] [Google Scholar]
- Bollag WB, Zhong X, Dodd EM, Hardy DM, Zheng X, Allred WT. Phospholipase D signaling and extracellular signal-regulated kinase-1 and -2 phosphorylation (activation) are required for maximal phorbol-ester-induced transglutaminase activity, a marker of keratinocyte differentiation. J Pharmacol Exp Ther. 2005;312:1223–1231. doi: 10.1124/jpet.104.075622. [DOI] [PubMed] [Google Scholar]
- Caccamo D, Currò M, Lentile R. Potential of transglutaminase 2 as a therapeutic target. Expert Opin Ther Targets. 2010;14:989–1003. doi: 10.1517/14728222.2010.510134. [DOI] [PubMed] [Google Scholar]
- Caccamo D, Currò M, Ferlazzo N, Condello S, Lentile R. Monitoring of transglutaminase 2 under different oxidative stress conditions. Amino Acids. 2012;42:1037–1043. doi: 10.1007/s00726-011-1018-8. [DOI] [PubMed] [Google Scholar]
- Csósz E, Meskó B, Fésüs L. Transdab wiki: the interactive transglutaminase substrate database on web 2.0 surface. Amino Acids. 2009;36:615–617. doi: 10.1007/s00726-008-0121-y. [DOI] [PubMed] [Google Scholar]
- Davies SP, Reddy H, Caivano M, Cohen P. Specificity and mechanism of action of some commonly used protein kinase inhibitors. Biochem J. 2000;351:95–105. doi: 10.1042/0264-6021:3510095. [DOI] [PMC free article] [PubMed] [Google Scholar]
- Davis PD, Hill CH, Keech E, Lawton G, Nixon JS, Sedgwick AD, et al. Potent selective inhibitors of protein kinase C. FEBS Lett. 1989;259:61–63. doi: 10.1016/0014-5793(89)81494-2. [DOI] [PubMed] [Google Scholar]
- Filiano AJ, Bailey CDC, Tucholski J, Gundemir S, Johnson GVW. Transglutaminase 2 protects against ischemic insult, interacts with HIF1β, and attenuates HIF1 signaling. FASEB J. 2008;22:2662–2675. doi: 10.1096/fj.07-097709. [DOI] [PMC free article] [PubMed] [Google Scholar]
- Fretwell L, Dickenson JM. Role of large-conductance Ca2+-activated potassium channels in adenosine A1 receptor-mediated pharmacological preconditioning in H9c2 cells. Eur J Pharmacol. 2009;618:37–44. doi: 10.1016/j.ejphar.2009.07.008. [DOI] [PubMed] [Google Scholar]
- Freund KF, Doshi KP, Gaul SL, Claremon DA, Remy DC, Baldwin JJ, et al. Transglutaminase inhibition by 2-[(2-oxopropyl)thio]imidazolium derivatives: mechanism of factor XIIIa inactivation. Biochemistry. 1994;33:10109–10119. doi: 10.1021/bi00199a039. [DOI] [PubMed] [Google Scholar]
- Griffin M, Casadio R, Bergamini CM. Transglutaminases: nature/s biological glues. Biochem J. 2002;368:377–396. doi: 10.1042/BJ20021234. [DOI] [PMC free article] [PubMed] [Google Scholar]
- Gundemir S, Colak G, Tucholski J, Johnson GVW. Transglutaminase 2: a molecular Swiss army knife. Biochim Biophys Acta. 2012;1823:406–419. doi: 10.1016/j.bbamcr.2011.09.012. [DOI] [PMC free article] [PubMed] [Google Scholar]
- Hausenloy DJ, Yellon DM. New directions for protecting the heart against ischaemia-reperfusion injury: targeting the Reperfusion Injury Salvage Kinase (RISK)-pathway. Cardiovasc Res. 2004;61:448–460. doi: 10.1016/j.cardiores.2003.09.024. [DOI] [PubMed] [Google Scholar]
- Hausenloy DJ, Yellon DM. Preconditioning and postconditioning: united at reperfusion. Pharmacol Ther. 2007;116:173–191. doi: 10.1016/j.pharmthera.2007.06.005. [DOI] [PubMed] [Google Scholar]
- Hescheler J, Meyer R, Plant S, Krautwurst D, Rosenthal W, Schultz G. Morphological, biochemical and electrophysiological characterization of a clonal cell (H9c2) line from rat heart. Circ Res. 1991;69:1476–1486. doi: 10.1161/01.res.69.6.1476. [DOI] [PubMed] [Google Scholar]
- Kase H, Iwahashi K, Nakanishi S, Matsuda Y, Yamada K, Takahashi M, et al. K-252 compounds, novel and potent inhibitors of protein kinase C and cyclic nucleotide-dependent protein kinases. Biochem Biophys Res Commun. 1987;142:436–440. doi: 10.1016/0006-291x(87)90293-2. [DOI] [PubMed] [Google Scholar]
- Keinan N, Tyomkin D, Shoshan-Barmatz V. Oligomerization of the mitochondrial protein voltage-dependent anion channel is coupled to the induction of apoptosis. Mol Cell Biol. 2010;30:5698–5709. doi: 10.1128/MCB.00165-10. [DOI] [PMC free article] [PubMed] [Google Scholar]
- Kimes BW, Brandt BL. Properties of a clonal muscle cell line from rat heart. Exp Cell Res. 1976;98:367–381. doi: 10.1016/0014-4827(76)90447-x. [DOI] [PubMed] [Google Scholar]
- Lee KN, Arnold SA, Birkbichler PJ, Patterson MK, Jr, Fraij BM, Takeuchi Y, et al. Site-directed mutagenesis of human tissue transglutaminase: cys-277 is essential for transglutaminase activity but not for GTPase activity. Biochim Biophys Acta. 1993;1202:1–6. doi: 10.1016/0167-4838(93)90055-v. [DOI] [PubMed] [Google Scholar]
- Lilley GR, Skill J, Griffin M, Bonner PLR. Detection of Ca2+-dependent transglutaminase activity in root and leaf tissue of monocotyledonous and dicotyledonous plants. Plant Physiol. 1998;117:1115–1123. doi: 10.1104/pp.117.3.1115. [DOI] [PMC free article] [PubMed] [Google Scholar]
- Lorand L, Conrad SM. Transglutaminases. Mol Cell Biochem. 1984;58:9–35. doi: 10.1007/BF00240602. [DOI] [PubMed] [Google Scholar]
- Mackintosh C. Dynamic interactions between 14-3-3 proteins and phosphoproteins regulate diverse cellular processes. Biochem J. 2004;381:329–3242. doi: 10.1042/BJ20031332. [DOI] [PMC free article] [PubMed] [Google Scholar]
- Mhaouty-Kodja S. Ghα/tissue transglutaminase 2: an emerging G protein in signal transduction. Biol Cell. 2004;96:363–367. doi: 10.1016/j.biolcel.2004.03.003. [DOI] [PubMed] [Google Scholar]
- Mishra S, Murphy LJ. Phosphorylation of transglutaminase 2 by PKA at Ser216 creates 14.3.3 binding sites. Biochem Biophys Res Commun. 2006;347:1166–1170. doi: 10.1016/j.bbrc.2006.07.041. [DOI] [PubMed] [Google Scholar]
- Mishra S, Melino G, Murphy LJ. Transglutaminase 2 kinase activity facilitates protein kinase A-induced phosphorylation of retinoblastoma protein. J Biol Chem. 2007;282:18108–18115. doi: 10.1074/jbc.M607413200. [DOI] [PubMed] [Google Scholar]
- Misra A, Haudek SB, Knuefermann P, Vallejo JG, Chen ZJC, Michael LH, et al. Nuclear factor-κB protects the adult cardiac myocyte against ischemia-induced apoptosis in a murine model of acute myocardial infarction. Circulation. 2003;108:3075–3078. doi: 10.1161/01.CIR.0000108929.93074.0B. [DOI] [PubMed] [Google Scholar]
- Nakaoka H, Perez DM, Baek KJ, Das T, Husain A, Mison K, et al. Gh: a GTP-binding protein with transglutaminase activity and receptor signaling function. Science. 1994;264:1593–1596. doi: 10.1126/science.7911253. [DOI] [PubMed] [Google Scholar]
- Nurminskaya MV, Belkin AM. Cellular functions of tissue transglutaminase. Int Rev Cell Mol Biol. 2012;294:1–97. doi: 10.1016/B978-0-12-394305-7.00001-X. [DOI] [PMC free article] [PubMed] [Google Scholar]
- Perry MJ, Mahoney SA, Haynes LW. Transglutaminase C in cerebellar granule neurons: regulation and localization of substrate cross-linking. Neuroscience. 1995;65:1063–1076. doi: 10.1016/0306-4522(94)00556-k. [DOI] [PubMed] [Google Scholar]
- Piacentini M, D'Eletto M, Falasca L, Farrace MG, Rodolfo C. Transglutaminase 2 at the crossroads of cell death and survival. Adv Enzymol Relat Areas Mol Biol. 2011;78:197–246. doi: 10.1002/9781118105771.ch5. [DOI] [PubMed] [Google Scholar]
- Sanada S, Komuro I, Kitakaze M. Pathophysiology of myocardial reperfusion injury: preconditioning, postconditioning, and translational aspects of protective measures. Am J Physiol Heart Circ Physiol. 2011;301:H1723–H1741. doi: 10.1152/ajpheart.00553.2011. [DOI] [PubMed] [Google Scholar]
- Schaertl S, Prime M, Wityak J, Dominguez C, Munoz-Sanjuan I, Pacifici RE, et al. A profiling platform for the characterization of transglutaminase 2 (TG2) inhibitors. J Biomol Screen. 2010;15:478–487. doi: 10.1177/1087057110366035. [DOI] [PubMed] [Google Scholar]
- Singh RN, McQueen T, Mehta K. Detection of the amine acceptor protein substrates of transglutaminase with 5-(biotinamido) pentylamine. Anal Biochem. 1995;231:261–263. doi: 10.1006/abio.1995.1529. [DOI] [PubMed] [Google Scholar]
- Slaughter TF, Achyuthan KE, Lai TS, Greenberg CS. A microtiter plate transglutaminase assay utilizing 5-(biotinamido) pentylamine as substrate. Anal Biochem. 1992;205:166–171. doi: 10.1016/0003-2697(92)90594-w. [DOI] [PubMed] [Google Scholar]
- Smith PK, Krohn RI, Hermanson GT, Mallia AK, Gartner FH, Provenzano MD, et al. Measurement of protein using bicinchoninic acid. Anal Biochem. 1985;150:76–85. doi: 10.1016/0003-2697(85)90442-7. [DOI] [PubMed] [Google Scholar]
- Song H, Kim BK, Chang W, Lim S, Song BW, Cha MJ, et al. Tissue transglutaminase 2 promotes apoptosis of rat neonatal cardiomyocytes under oxidative stress. J Recept Signal Transduct Res. 2011;31:66–74. doi: 10.3109/10799893.2010.529577. [DOI] [PubMed] [Google Scholar]
- Stamnaes J, Fleckenstein B, Sollid LM. The propensity for deamidation and transamidation of peptides by transglutaminase 2 is dependent on substrate affinity and reaction conditions. Biochim Biophys Acta. 2008;1784:1804–1811. doi: 10.1016/j.bbapap.2008.08.011. [DOI] [PMC free article] [PubMed] [Google Scholar]
- Szondy Z, Mastroberardino P, Varadi J, Farrace M, Nagy N, Bak I, et al. Tissue transglutaminase (TG2) protects cardiomyocytes against ischemia/reperfusion injury by regulating ATP synthesis. Cell Death Differ. 2006;13:1827–1829. doi: 10.1038/sj.cdd.4401889. [DOI] [PubMed] [Google Scholar]
- Trigwell SM, Lynch PT, Griffin M, Hargreaves AJ, Bonner PL. An improved colorimetric assay for the measurement of transglutaminase (type II)-(γ-glutamyl) lysine cross-linking activity. Anal Biochem. 2004;330:164–166. doi: 10.1016/j.ab.2004.03.068. [DOI] [PubMed] [Google Scholar]
- Wang Y, Ande SR, Mishra S. Phosphorylation of transglutaminase 2 (TG2) at serine-216 has a role in TG2 mediated activation of nuclear factor-kappa B and in the downregulation of PTEN. BMC Cancer. 2012;12:277. doi: 10.1186/1471-2407-12-277. [DOI] [PMC free article] [PubMed] [Google Scholar]
- de Wit RJ, Hekstra D, Jastorff B, Stec WJ, Baraniak J, Van Driel R, et al. Inhibitory action of certain cyclophosphate derivatives of cAMP on cAMP-dependent protein kinases. Eur J Biochem. 1984;142:255–260. doi: 10.1111/j.1432-1033.1984.tb08279.x. [DOI] [PubMed] [Google Scholar]
- Yellon DM, Downey JM. Preconditioning the myocardium: from cellular physiology to clinical cardiology. Physiol Rev. 2003;83:1113–1151. doi: 10.1152/physrev.00009.2003. [DOI] [PubMed] [Google Scholar]