

Abstract
BACKGROUND AND PURPOSE
The molecular identity of calcium-activated chloride channels (CaCCs) in vascular endothelial cells remains unknown. This study sought to identify whether anoctamin-1 (Ano1, also known as TMEM16A) functions as a CaCC and whether hypoxia alters the biophysical properties of Ano1 in mouse cardiac vascular endothelial cells (CVECs).
EXPERIMENTAL APPROACH
Western blot, quantitative real-time PCR, confocal imaging analysis and patch-clamp analysis combined with pharmacological approaches were used to determine whether Ano1 was expressed and functioned as CaCC in CVECs.
KEY RESULTS
Ano1 was expressed in CVECs. The biophysical properties of the current generated in the CVECs, including the Ca2+ and voltage dependence, outward rectification, anion selectivity and the pharmacological profile, are similar to those described for CaCCs. The density of ICl(Ca) detected in CVECs was significantly inhibited by T16Ainh-A01, an Ano1 inhibitor, and a pore-targeting, specific anti-Ano1 antibody, and was markedly decreased in Ano1 gene knockdown CVECs. The density of ICl(Ca) was significantly potentiated in CVECs exposed to hypoxia, and this hypoxia-induced increase in the density of ICl(Ca) was inhibited by T16Ainh-A01 or anti-Ano1 antibody. Hypoxia also increased the current density of ICl(Ca) in Ano1 gene knockdown CVECs.
CONCLUSIONS AND IMPLICATIONS
Ano1 formed CaCC in CVECs of neonatal mice. Hypoxia enhances Ano1-mediated ICl(Ca) density via increasing its expression, altering the ratio of its splicing variants, sensitivity to membrane voltage and to Ca2+. Ano1 may play a role in the pathophysiological processes during ischaemia in heart, and therefore, Ano1 might be a potential therapeutic target to prevent ischaemic damage.
Keywords: calcium-activated chloride channels, cardiac vascular endothelial cells, anoctamin, hypoxia
Introduction
Calcium-activated chloride channels (CaCCs) play an important role in epithelial secretion of electrolytes and water, sensory transduction, regulation of neuronal and cardiac excitability, and regulation of vascular tone (Hartzell et al., 2005; channel nomenclature follows Alexander et al., 2013). A member of a Ca2+-sensitive Cl− channel family (CLCA1), volume-regulated chloride channel (CLC-3), bestrophins and tweety were proposed as the CaCC candidate proteins; however, the biophysical features of the currents mediated by these channels are different from those of native classical CaCCs (Hartzell et al., 2009). Heterologous expression of the proteins anoctamin-1 (Ano1; TMEM16A) and Ano2 (TMEM16B) in a variety of cell types produced calcium-activated chloride currents [ICl(Ca)], with biophysical characteristics similar to those of native classical CaCCs. Therefore, Ano1 and Ano2 have been proposed as the novel candidate proteins for CaCCs (Caputo et al., 2008; Schroeder et al., 2008; Yang et al., 2008; Pifferi et al., 2009). Subsequent studies suggested that the gene product of Ano1 was the protein involved in native CaCC in gland acinar cells (Yang et al., 2008; Huang et al., 2009; Romanenko et al., 2010), epithelial cells (Ousingsawat et al., 2009; Rock et al., 2009; Dutta et al., 2011), interstitial cells of Cajal (Hwang et al., 2009) and smooth muscle cells (SMCs) (Davis et al., 2010; Manoury et al., 2010).
CaCCs are expressed in various endothelial cell types of different species, including calf pulmonary artery endothelial cells (Nilius et al., 1997), mouse aorta endothelial cells (Suh et al., 1999) and human umbilical vein endothelial cells (Zhong et al., 2000). CaCCs have been implicated in the control of the membrane potential, which helps to maintain the driving force for Ca2+. In vascular endothelial cells, the resting membrane potential (approximately −40 mV) is more negative than the equilibrium potential for Cl− (approximately −28 mV) (Ono et al., 1998). As a consequence of agonist-induced increase in cytosolic Ca2+ ([Ca2+]i), CaCCs are activated and Cl− leaves the cell, which results in a shift of the membrane potential of endothelial cells towards the Cl− equilibrium potential, and possibly inducing a negative feedback during agonist stimulation. Therefore, CaCCs are functionally important in the control of the membrane potential, the driving force for Ca2+ influx and regulation of Ca2+ signalling in endothelial cells (Hosoki and Iijima, 1994). CaCCs may also be involved in control of volume, cell shape and cell proliferation, as well as intracellular pH regulation (Nilius et al., 1997; Hartzell et al., 2005). The CaCCs are involved in many important physiological processes in vascular endothelial cells but their molecular identity and roles in ischaemic conditions remain unknown.
In the present study, we investigated whether Ano1 functions as a CaCC and whether hypoxia alters the biophysical properties of Ano1 in cardiac vascular endothelial cells (CVECs) isolated from neonatal mice. The novel findings of the functional properties of Ano1 in the normal and ischaemic CVECs may provide new therapeutic target for the treatment of ischaemia-induced damage in the vascular system.
Methods
Isolation and culture of CVECs and Ano1 gene silencing in CVECs
All animal care and experimental procedures were approved by the Harbin Medical University Animal Supervision Committee. All studies involving animals are reported in accordance with the ARRIVE guidelines for reporting experiments involving animals (Kilkenny et al., 2010; McGrath et al., 2010). Over 200 animals were used in the experiments described here.
Neonatal BALB/c mice were purchased from Experimental Animal Center of Harbin Medical University. CVECs were isolated from the left ventricles of hearts from neonatal mice, as previously described (Zhou et al., 2010), with slight modifications. Briefly, each pup was placed on a 37°C temperature-controlled pad for general anesthesia from spontaneous respirations of 3.0% isoflurane in oxygen. After anaesthesia, the hearts were quickly excised and washed, then minced in ice-cold serum-free DMEM. The atrial, cardiac valves and right ventricle were stripped under a microscope. Then the isolated left ventricles were immersed in 70% ethanol for 10 s to devitalize epicardial mesothelial and endocardial endothelial cells. The left ventricular tissue was finely minced and transferred into a tube containing 5 mL of trypsin (0.25%) for twice for 5 min at 37oC, in a shaking water bath. Dissociated cells were filtered through a 100 μm mesh filter and centrifuged at 100× g for 5 min in a sealed centrifuge (C3i centrifuge, Jouan Laboratories, Saint-Herblain, France). Cells were resuspended in DMEM supplemented with 10% FBS, 100 IU mL−1 penicillin and 100 μg mL−1 streptomycin, and then transferred into a cell culture dish for 30 min at 37oC in 5% CO2 incubator to remove the attached fibroblasts. After these procedures, the CVECs were harvested (Zhou et al., 2010) and were identified using CD31 antibody. The non-attached viable CVECs were collected and seeded onto coverslips or dishes for the following experiments. The CVECs reached ∼80% confluence within 3–4 days and displayed uniform ‘cobblestone’ morphology under optical microscope and were ready for the experiments.
Ano1 gene silencing was carried out as follows. CEVCs were cultured in 6-well plates. After cells became 80% confluent, Ano1-specific small hairpin RNAs (shRNAs) were transfected using lipofectamine 2000 (Invitrogen, Carlsbad, CA, USA). The sequences of shRNA constructs are listed in Supplement Table 1. The shRNAs were cloned into the pGPU6/GFP/Neo-shRNA vector by inserting constructs into the 3'-UTR of the GFP gene (GenePharma, Shanghai, China). Evaluation of gene silencing efficiency assays (qRT-PCR and western blot assays) were performed 48 hrs after transfection. In addition, the green fluorescent protein (GFP) was used as an additional indicator for success of transfection.
Quantitative real-time PCR (qRT-PCR)
Total RNA was extracted from CVECs using TRIzol reagent (Invitrogen, Carlsbad, CA, USA). Reverse transcription was performed with the RT system protocol in a 20 μL reaction mixture. Total RNA (1 μg) was used in the reaction, and a random primer was used for the initiation of cDNA synthesis, the reaction mixture was incubated at 25oC for 10 min, 37oC for 120 min and 85oC for 5 min, respectively. Then qRT-PCR was performed using the ABI Prism 7500 sequence detection system with SYBR Green PCR reagents (Applied Biosystems, USA). The primers used are listed in Supplement Table 1. After circle reaction, the threshold cycle (Ct) was determined and relative Ano1 and Ano2 mRNA levels were calculated based on the Ct values and normalized by β-actin level in each sample.
For determining whether hypoxia leads to an altered expression ratio of Ano1 splicing variants in CVECs, we used the primers listed in Supplement Table 2, in which exons 6b, 13 and 15 were excluded. The values for the mRNA products of these Ano1 splicing variants, obtained either from normoxic or hypoxic condition, were then normalized to the values of Ano1 mRNA product obtained using the primers shown in Supplement Table 3 under normoxic condition.
Western blotting
CVECs were homogenized in RIPA lysis buffer containing 10 μL mL−1 protease inhibitor cocktail, and centrifuged at 13,500g for 15 min at 4oC to precipitate cell debris. Equal concentration of denatured proteins were separated on 10% SDS-polyacrylamide gels and were transferred onto polyvinylidene difluoride (PVDF) membranes, blocked by 5% nonfat dry milk for 1 hr, followed by incubating with rabbit polyclonal anti-Ano1 antibody (Abcam ab53213, 1:500 dilution) for overnight. After washing with TBS-T, the membranes were incubated with horseradish peroxidase-conjugated goat anti-rabbit IgG secondary antibody (Santa Cruz-2793, CA, 1:4000 dilution) for 1 hr, labeled proteins were visualized with enhanced chemiluminescence (ECL) (Invitrogen WP20005, Carlsbad, CA, USA) and quantified by scanning densitometry (Bio-Rad). The intensities of interesting band were normalized by the intensity of β-actin (Santa Cruzsc-47778, 1:1000 dilution) bands.
Immunostaining
Neonatal mouse heart was fixed with 4% paraformaldehyde for 2 hrs followed by 18% sucrose 16 hrs, then preserved in optimum cutting temperature compound (−80°C). Longitudinal sections of the left ventricular wall were cut with a cryostat microtome (CM 3500 cryostat, Israel) at a thickness of 4 mm and permeabilized with 0.2% Triton X-100 (PBST) for 10 min and blocked with 5% bovine serum albumin (BSA) PBST for 1 hr. Rabbit polyclonal anti-Ano1 antibody (1:1000 dilution) (Yu et al., 2010) and sheep polyclonal antibody to von Willebrand factor (vWF) were added in 1% BSA/PBST for overnight at 4°C. The sections were washed in PBST and incubated with Alexa Fluor 488 conjugated donkey anti-rabbit IgG (Invitrogen A21206, 1:1000 dilution) or TRITC conjugated donkey anti-sheep (Abcam ab6897, 1:1000 dilution) for 1 hr.
The endothelial cells of passage one were washed with ice-cold PBS. After fixation with 4% paraformaldehyde at room temperature (22–24°C), cells were permeabilized with 0.2% Triton X-100 in PBS for 10 min and blocked with 5% BSA/PBST for 30 min. Rabbit polyclonal anti-Ano1 antibody (1:1000 dilution) (Yu et al., 2010), endothelial cells markers CD31 (Abcam ab7388, 1:1000 dilution) was added in 1% BSA/PBS overnight at 4°C. Subsequently, the cells were washed in PBS containing 0.1% Tween and incubated with Alexa Fluor 488 conjugated donkey anti-rabbit IgG (Invitrogen A21206, 1:1000 dilution) or Alexa Fluor 594 conjugated donkey anti-rat IgG (Invitrogen A21209, 1:1000 dilution) for 1 hr. All slides were imaged using a confocal microscope (Olympus, Fluoview1000, Japan). Identical acquisition settings were used for all images.
Cell proliferation assays
3-(4, 5-Dimethyl-thiazol-2-yl)-2, 5-diphenyltetrazolium bromide (MTT) assay was employed to evaluate cell proliferation rate. The CVECs were plated into 96-well plates at a density of 50,000 cells per well in 200 μl culture medium. After 8 hrs recovery, cells were treated with 30 μM T16Ainh-A01 for 48 hrs. For hypoxic group CVECs were cultured under normal condition for 32 hrs and followed by culturing in the hypoxic incubator for 16 hrs, in the absence or in the presence of 30 μM T16Ainh-A01. Then 20 μl PBS-buffered MTT (5 mg mL−1) solution was added to each well and the cells were incubated at 37°C for 4 hrs. Subsequently, the supernatant was then discarded form each well and 100 μL DMSO was added into each well and mixed thoroughly for 10 min to ensure all crystals were dissolved. The absorbance of samples was measured by a microplate reader at wavelength of 570 nm (Tecan, Mannedorf, Switzerland). The quantity of formazan product would be proportional to the number of living cells in culture.
Exposure of CVECs to hypoxia
For hypoxic treatment, ∼80% confluent CVECs were placed in a hypoxic incubator (Thermo Scientific Series WJ 8000, Waltham, MA, USA) and were kept at 37°C for 16 h with a constant stream of water-saturated 93% N2, 5% CO2 and 2% O2. There was no apoptosis that occurred under this condition, as detected by TUNEL assays (data not shown).
Patch-clamp recording
The whole-cell patch-clamp technique was used to record ICl(Ca) in voltage-clamp mode using an Axopatch 200B amplifier, and data were filtered at 1 kHz and sampled at 5 kHz (Axon Instruments, Foster City, CA, USA). Borosilicate glass electrodes were pulled with a four-stage puller (Sutter, Novato, CA, USA) and had a resistance of 1–2 MΩ when filled with pipette solution. ICl(Ca) was recorded using a holding potential of 0 mV followed by voltage steps from −100 to +100 mV in 20 mV increment for a duration of 1000 ms, and then repolarized to −100 mV for 300 ms. Membrane current densities were obtained by dividing the measured current amplitude by the cell capacitance. The current density–voltage relationships (I–V) were plotted using the calculated current density from the beginning (instantaneous) or the end (steady state) of 1000 ms, as a function of voltages. The activation time constant (τact) and the inactivation time constant (τinact) were, respectively, obtained by fitting 400 ms of whole-cell current following the end of the capacitance transient and by fitting 200 ms of whole-cell current following the repolarization currents measured after capacitance transient to a single exponential function. The macroscopic chord conductance (G) was calculated by an equation: G = I/(VM – Vrev), where I represents the amplitude of steady-state current measured at the end of 1000 ms of each voltage, VM indicates the membrane potential and Vrev is the reversal potential (since Vrev is ∼0 mV for all records, we set Vrev to 0 mV for all calculations). The G obtained from each tested voltage was then normalized to the G calculated from +100 mV (Gmax, the maximal cord conductance). These data points were plotted as a function of voltages and were fitted by the Boltzmann function: G = Gmax/{1 + exp[−(VM − V1/2)/k]}, where V1/2 represents the voltage at which 50% of activation occurs and k is the slope factor. Prior to analysis, the whole-cell recording traces were further filtered to 100 Hz (Clampfit 10.2; Molecular Devices, Sunnyvale, CA, USA).
For anion selectivity experiments, the data were corrected for junction potentials at the ground bridge (3 M KCl in 3% agar), which ranged from 2 to 4 mV as determined with a free-flowing KCl electrode. Vrev for chloride and for each test anion were used to calculate relative permeability [anion X− to Cl− permeability (Px−/PCl−)] values according to the Goldman–Hodgkin–Katz equation (Hille, 1992).
The extracellular solution contained (in mM): 150 NaCl, 1 CaCl2, 1 MgCl2, 10 glucose, 10 sucrose, 10 HEPES (pH = 7.4 with NaOH); the pipette solution contained (in mM): 130 CsCl, 10 EGTA, 1 MgCl2, 10 HEPES, 1 ATP and different concentrations of CaCl2 to obtain the desired free Ca2+ concentration (calculated according to the method posted at http://www.stanford.edu/~cpatton/; 1 mM for 18 nM, 6 mM for 290 nM, 7 mM for 453 nM, 8 mM for 777 nM, 8.5 mM for 1.1 μM, and 10 mM for 36.5 μM) (pH = 7.3 with CsOH), as determined with the Ca-EGTA calculator.
Data analyses
Data are reported as mean values ± SEM for n observations. All data gathered in Excel were plotted using Origin 8.5 software (OriginLab, Northampton, MA, USA). Significance was determined using Student's t-tests for paired or unpaired data. P < 0.05 was considered statistically significant.
Materials
Unless otherwise noted, all chemicals and reagents were purchased from Sigma-Aldrich (St. Louis, MO, USA). The specific Ano1 inhibitor, T16Ainh-A01, was purchased from EMD Millipore Biosciences (Billerica, MA, USA).
Results
A Ca2+- and voltage-dependent macroscopic current was detected in CVECs
A group of macroscopic currents was recorded from mouse CVECs in the presence of a variety concentrations of free [Ca2+]i (Fig. 1A–F). The current recorded, in the presence of 18 nM free [Ca2+]i, exhibited no outward rectification and time-dependent relaxation (Fig. 1A and G). The amplitude of the outward currents was amplified gradually and the outward rectification and time-dependent relaxation became more profound, as free [Ca2+]i was increased from 290 nM to 1.1 μM (Fig. 1B–E and G). However, when free [Ca2+]i reached 36.5 μM, the inward and outward currents were nearly equal in amplitude, and time-dependent relaxation was almost lost (Fig. 1F and G). The macroscopic currents were deactivated by switching membrane potential to −100 mV. The average instantaneous tail current density measured at −100 mV after pre-pulses to different membrane voltage was plotted as a function of free [Ca2+]i and the data points were fitted to the Hill equation (Fig. 1H). The data show that EC50 of free [Ca2+]i decreased by about fourfold [2.08 ± 1.04 μM at 0 mV (n = 7–11) vs. 0.53 ± 0.06 μM at +100 mV (n = 7–11)]. These results suggest that the gating of the macroscopic currents recorded from CVECs is Ca2+- and voltage-dependent.
Figure 1.

(A–F) Representative macroscopic currents were recorded in CVECs, in the presence of desired free [Ca2+]i, with the voltage protocol shown in the inset. (G) Calculated steady-state current densities, in the presence of a variety of free [Ca2+]i, were plotted as a function of membrane potentials (n = 5–11 for different data points). (H) Current densities calculated from tail currents measured at −100 mV after pre-pulses between +100 and −100 mV were plotted against [Ca2+]i and were fitted with the Hill equation (n = 7–11 for different data points).
A chloride channel mediates the voltage- and Ca2+-dependent currents in CVECs
For the rest of the experiments, 777 nM free [Ca2+]i was used. We assessed anion selectivity experiments to determine whether the voltage- and Ca2+-dependent macroscopic current is mediated by a chloride channel. The magnitude of outward currents was significantly reduced by replacing extracellular Cl− with gluconate−, and the Vrev shifted from near zero (−1.37 ± 0.79 mV) to depolarizing potential (52.5 ± 2.31 mV) (n = 5) (Fig. 2A–C). Substitution of extracellular Cl− with NO3− resulted in a dramatic increase in the amplitude of outward current, and the Vrev shifted from near zero (−0.92 ± 0.68 mV) to hyperpolarizing potentials (−23.11 ± 1.04 mV) (n = 8) (Fig. 2D–F). The relative permeability ratios for Pglu/PCl and PNO3/PCl were 0.13 ± 0.01 and 2.30 ± 0.10. Moreover, the macroscopic current was reversibly blocked by 100 μM niflumic acid (NFA), a non-specific chloride channel blocker (n = 6) (Fig. 2G–J). These data together suggest that the voltage- and Ca2+-dependent current recorded from CVECs is mediated by a chloride channel.
Figure 2.

Representative macroscopic current traces were respectively recorded from CVECs with the voltage protocol depicted in the inset, in the presence of NaCl (A and D), Na-gluconate (B) or NaNO3 (E). The steady-state current densities obtained from indicated experimental conditions were plotted as a function of membrane potentials (C and F) (n = 5–8 for different data points). (G–I) Representative macroscopic current traces were respectively recorded from a CVEC under control condition (G) or in the presence of 100 μM NFA (H), and followed by washing out NFA (I). (J) Steady-state I–V relationships show that the current was significantly blocked by 100 μM NFA (n = 6).
Ano1 presents in CVECs isolated from neonatal mouse
The biophysical features and pharmacological profile of the ICl(Ca) detected in CVECs are similar to those of CaCCs. We reasoned that ICl(Ca) might be mediated by Ano1. As seen in Fig. 3A, Ano1 mRNA, but not Ano2 mRNA, was detected in CVECs (Fig. 3A). Western blot analysis demonstrated that CVECs expressed Ano1 (Fig. 3B). We further stained the neonatal mouse heart with anti-Ano1 antibody and anti-vWF antibody, a marker for endothelial cells, and sliced the left ventricular walls in longitudinal sections. Ano1 (green) was nicely present at endothelium and co-localized with endothelial marker (red) (Fig. 3C; the white arrow heads indicate blood vessels). Confocal imaging analyses also revealed that a co-localization of Ano1 (green) and CD31 (red) occurred at the plasma membrane of CVECs (Fig. 3D) because the highest merged fluorescence intensity (peaks) appeared in the vicinity of the plasma membrane (Fig. 3E). These results led us to hypothesize that the ICl(Ca) is carried by Ano1 in CVECs.
Figure 3.
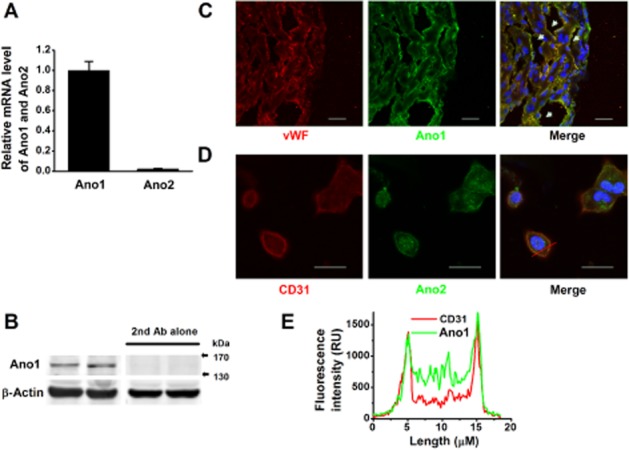
(A) qRT-PCR demonstrates the relative mRNA levels of Ano1 and Ano2 in CVECs (n = 6); Ano1, but not Ano2, was expressed in CVECs. (B) Western blots shown at the two left panels indicate CVECs express Ano1; with the secondary antibody alone, no band was detected (two panels at right) (repeated five times). (C) Representative immunofluorescence images of the sliced left ventricular wall in longitudinal section, labelled with antibodies raised against vWF (red) and against Ano1 (green). The white arrow heads indicate blood vessels. (D) Representative immunofluorescence images of isolated CVECs labelled with antibodies raised against CD31 (red) and against Ano1 (green). Scale bar represents 20 μm. (E) The representative fluorescence intensity histograms, constructed across a CVEC [the red solid line shown in (D)]. The majority of Ano1 (green) was distributed at and/or in the vicinity of the plasma membrane.
The ICl(Ca) in CVECs is mediated by Ano1
T16Ainh-A01, a newly identified specific Ano1 inhibitor (Forrest et al., 2012; Davis et al., 2013), and a specific pore-targeting anti-Ano1 antibody (Thomas-Gatewood et al., 2011) were respectively applied to the bath solution to test the hypothesis that the ICl(Ca) recorded from CVECs is mediated by Ano1. Figure 4A–D showed that the ICl(Ca) was significantly and reversibly inhibited by 30 μM T16Ainh-A01 (∼60%). The specific pore-targeting Ano1 antibody also dramatically inhibited ICa(Cl) (∼57%) (Fig. 4E–G); however, the boiled-specific pore-targeting, anti-ANO1 antibody had no effect on the amplitude of the ICa(Cl) (Fig. 4H–J). Furthermore, the ICa(Cl) was almost completely blocked in Ano1-specific shRNA transfected CVECs; in contrast, the ICa(Cl) was not altered in CVECs expressing scramble shRNA (Fig. 4K–N) (refer to Supporting Information Fig. S1 for gene silencing efficiency; since shRNAs were linked with GFP, the cells showing green were used for patch-clamp analyses). These data strongly suggest that the ICa(Cl) recorded from CVECs is mediated by Ano1.
Figure 4.

(A–C) Representative macroscopic currents were respectively generated in the same cell under control condition, in the presence of 30 μM T16Ainh-A01 followed by washing out. (D) Steady-state current densities obtained from indicated experimental conditions were plotted as a function of the membrane voltages. The macroscopic currents were significantly and reversibly inhibited by T16Ainh-A01 (n = 5). (E and F) Representative whole-cell currents were recorded from the same cell under control condition and 10 min after application of specific pore-targeting anti-Ano1 antibody. (G) I–V relationships show that the macroscopic currents were significantly inhibited by anti-Ano1 antibody (n = 6). (H and I) Representative macroscopic currents were respectively obtained from the same cell, in the absence or in the presence of boiled anti-Ano1 antibody. (J) I–V relationships show that the boiled anti-Ano1 antibody did not affect the macroscopic current density (n = 6). (K–M) Representative macroscopic currents were respectively generated from control cells (n = 8), the cells transfected with scramble shRNA (n = 6) and the cells transfected with shRNA against Ano1 (n = 6). (N) I–V relationships show that the macroscopic currents were greatly diminished in Ano1 knockdown CVECs.
Hypoxia potentiates Ano1-mediated ICl(Ca) in CVECs
As shown in Fig. 5A, B, F and G, the steady-state current (Iss) and the instantaneous current (Iinst) were significantly potentiated by hypoxia, although with different extent (approximately twofold for Iss and approximately fourfold for Iinst at depolarizing potentials). Hypoxia-induced increased in the amplitude of ICa(Cl) was significantly inhibited by the specific pore-targeting Ano1 antibody (Fig. 5C, F and G) and by T16Ainh-A01 (data not shown). Moreover, hypoxia also significantly enhanced the amplitude of ICa(Cl) in Ano1 knockdown CVECs (Fig. 5D and E; I–V data not shown), suggesting that the residual Ano1 was up-regulated by hypoxia. These data further confirm that the ICa(Cl) recorded in CVECs is mediated by Ano1. The data shown in Fig. 5H and I demonstrate that the mRNA and protein expression levels of Ano1 were slightly, but significantly increased by exposure of CVECs to hypoxia. However, the increased Ano1 protein expression levels (∼20%) were not in agreement with hypoxia-induced increase in current density (approximately twofold for Iss and approximately fourfold for Iinst), suggesting that there might be other mechanisms by which hypoxia induces an increase in the current density of Ano1. Moreover, the proliferation rate of CVECs was increased ∼20% by hypoxia. This hypoxia-induced increase in proliferation rate was not affected by T16Ainh-A01 in either control cells or in the cells exposed to hypoxia (Fig. 5J).
Figure 5.

Representative macroscopic currents were respectively recorded from control cells (A), cells exposed to hypoxia in the absence (B) or in the presence of anti-Ano1 antibody (n = 6) (C), from Ano1 knockdown cells (n = 6) (D), the cells exposed to hypoxia (n = 7) (E). (F and G) The densities of Iss and Iinst were plotted versus membrane potentials; the data show that the densities of Iss and Iinst were potentiated by approximately twofold and fourfold, respectively, by hypoxia and were dramatically inhibited by anti-Ano1 antibody. (H) Western blots demonstrating the expression levels of Ano1 under control and hypoxic condition. (I) Summarized bar graph demonstrates that the expression levels of Ano1 mRNA and protein were up-regulated by hypoxia (n = 7). (J) MTT assays demonstrating the cell proliferation rate under different experimental conditions (n = 6 for each set of experiment). *P < 0.05, **P < 0.01, significantly different from control.
Hypoxia amplifies the current density of Ano1 via enhancing its sensitivity to Ca2+ and to membrane voltage
Figure 6A shows that in hypoxic CVECs, the ratios of Iinst/Iss (obtained from the records shown in Fig. 5A and B) were increased by hypoxia at the depolarizing potentials. Furthermore, the average τact values were significantly smaller in the cells exposed to hypoxia than in control cells (Fig. 6B). These data suggest that hypoxia alters the activation kinetics of Ano1 in CVECs during sustained depolarization, which is sensitive to Ca2+ (Kuruma and Hartzell, 2000; Xiao et al., 2011). The τinact values were increased in CVECs exposed to the hypoxia, suggesting that hypoxia retarded the deactivation of Ano1 channels (Fig. 6E). Furthermore, EC50 of [Ca2+]i for activating Ano1-mediated ICa(Cl) was 534 ± 63.2 nM for control (n = 7–11 for different data points) and 385 ± 35.4 nM for hypoxia (n = 6–8 for different data points) (P < 0.05), with Hill coefficients of 2.20 for control and 4.33 for hypoxia (Fig. 6F). The data described earlier suggest that hypoxia potentiates the sensitivity of Ano1-mediated ICa(Cl) to Ca2+, for example, activation of Ano1-mediated ICa(Cl) requires much lower [Ca2+]i under hypoxic condition. Figure 6G shows that the half maximum activation voltage (V1/2) was shifted from 103 ± 10 mV for control (n = 11) to 8.21 ± 2.30 mV for hypoxia (n = 8) (P < 0.01), with the corresponding slope factor (k) values of 42.77 ± 2.10 and 53.01 ± 2.61, respectively, suggesting that hypoxia enhances sensitivity of Ano1-mediated ICa(Cl) to membrane voltage, for example, activation of Ano1-mediated ICa(Cl) requires significantly less membrane depolarization.
Figure 6.

(A) The ratios of Iinst and Iss obtained from control (n = 11) and cells exposed to hypoxia (n = 11) were plotted against voltage. (B) Average τact obtained from control (as shown in Fig. 5A; n = 11) and hypoxic cells (as shown in Fig. 5B; n = 11) was plotted against voltage. (C and D) Representative macroscopic currents were respectively recorded from the CVECs under the control and hypoxic conditions using a voltage protocol shown in inset. (E) Average τinact obtained from control (shown in C; n = 6) and hypoxic (shown in D; n = 5) cells was plotted versus voltage. (F) Current densities calculated from tail currents measured at −100 mV after pre-pulses between +100 and −100 mV in control and hypoxic cells (from the records as shown in Fig. 5B) were plotted against [Ca2+]i and were respectively fitted with the Hill equation. The blue and green diamonds, respectively, indicate the mean EC50 of [Ca2+]i for activating Ano1-mediated ICa(Cl) in control (n = 7–11) and hypoxia CVECs (n = 6–8). (G) The G was plotted against each tested potential and the data points were fitted to the Boltzmann function to obtain mean steady-state activation curves (n = 11 for control; n = 8 for hypoxia).
Hypoxia induces an altered expression ratio of the Ano1 variants
The human Ano1 splicing variants (deletion of exons 6b, 13 and 15) are known to generate the currents with distinct biophysical properties to wild-type Ano1 (Ferrera et al., 2009; Mazzone et al., 2011). Furthermore, there are a variety of Ano1 splicing variants in mouse heart and these splicing events are highly conserved between human and mouse (O'Driscoll et al., 2011). Therefore, we examined whether hypoxia may cause the changes in the ratio of Ano1 splicing variants, which, in turn, alter the biophysical properties of Ano1-mediated ICa(Cl). Our qRT-PCR data showed that under hypoxic condition, the mRNA expression levels of Ano1 splicing variants lacking of exons 6b and 13 (Fig. 7A and B), but not lacking exon 15 (Fig. 7C), were significantly higher than those of control (the primers used are listed in Supporting Information Table S2). These results suggest that changes in the ratio of Ano1 splicing variants may involve in the altered biophysical properties of Ano1-mediated ICa(Cl) under hypoxic condition.
Figure 7.

qRT-PCR demonstrating hypoxia induces an altered expression ratio of Ano1 splicing variants in CVECs. (A and B) The relative mRNA expression levels of exons 6b and 13 excluded Ano1 were significantly up-regulated by hypoxia (n = 7). (C) Hypoxia did not affect the expression levels of exon 15 excluded Ano1 (n = 7). *P < 0.05, significantly different from control.
Discussion
The major findings of the present study are as follows: (i) demonstrating that mouse CVECs express Ano1; (ii) the ICl(Ca) recorded from CVECs is mediated by Ano1 and the biophysical properties of the Ano1-encoded ICl(Ca) are compatible with those of CaCCs; (iii) hypoxia up-regulates Ano1-mediated ICl(Ca) via enhancing its expression levels and an altered expression ratio of Ano1 splicing variants, thereby potentiating its sensitivity to Ca2+ and the membrane voltage.
Although the ICl(Ca) in endothelial cells was discovered more than 20 years ago, its molecular identity remains uncertain (Hartzell et al., 2005). Therefore, we aimed to identify the gene responsible for CaCCs in mouse CVECs. We detected a NFA-sensitive macroscopic current with profound outward rectification, time-dependent relaxation and an anionic selectivity sequence of NO3− > Cl− > Glu−. The gating of this macroscopic current was dependent upon Ca2+ and upon membrane voltage. These data suggest that the macroscopic current detected in CVECs is an ICl(Ca). The biophysical features of the ICl(Ca) in CVECs are consistent with what has been reported for CaCC (Qu et al., 2003). The results obtained from qRT-PCR, Western blot and immunofluorescence imaging analyses suggest that Ano1 is present in CVECs. The ICl(Ca) recorded from CVECs was reversibly blocked by T16Ainh-A01, a specific Ano1 inhibitor (Forrest et al., 2012; Davis et al., 2013), and was significantly inhibited by a specific pore-targeting anti-Ano1 antibody (Thomas-Gatewood et al., 2011) and was greatly diminished in Ano1 knockdown CVECs. Furthermore, hypoxia-induced augmentation of the ICl(Ca) was completely inhibited by the specific pore-targeting anti-Ano1 antibody. These results strongly suggest that the ICl(Ca) recorded from mouse CVECs is mediated by Ano1.
Recent reports suggest that translation of mouse Ano1 yields a molecular weight of ∼110 kDa (Davis et al., 2010). The exclusion of exon 18 in the mouse transcript could result in a truncated Ano1 protein of ∼60–75 kDa (O'Driscoll et al., 2011). We have to notice that the molecular weight of Ano1 in mouse CVECs, detected by Western blots, is ∼150 kDa, which is similar to those described in distal colonic epithelial cells and neck squamous cell carcinoma (He et al., 2011; Duvvuri et al., 2012). Human Ano1 has various protein isoforms generated by alternative splicing and has been labelled the four identified alternative segments as a, b, c and d (Ferrera et al., 2009). The TMEM16 (abc)-mediated channel was strongly inactivated by 1.25 μM Ca2+ (Ferrera et al., 2011). In comparison, we were able to generate Ano1 current at 36.5 μM Ca2+, albeit with no outward rectification and time-dependent relaxation. Our result is very compatible with those obtained from HEK293 cells overexpressing Ano1 (Xiao et al., 2011). Our data show that mouse Ano1 has a much lower EC50 for Ca2+ (∼0.53 μM at +100 mV) compared with those human varieties of Ano1 [∼3.32 μM for (abc) and ∼0.85 μM for (ac)] (Ferrera et al., 2009). It is no surprise because alternative splicing events are thought to affect Ca2+ sensitivity, voltage dependence and the kinetics of activation and deactivation of the Ano1 channel (Ferrera et al., 2009; 2011; Xiao et al., 2011).
Hypoxia is associated with angina pectoris, myocardial infarction, heart failure and peripheral artery disease. Severe hypoxia induces cell proliferation and angiogenesis (Li et al., 2007). Vascular endothelial cell proliferation plays an essential role in angiogenesis and revascularization of the myocardium following myocardial infarction (Isner and Losordo, 1999). Sun and co-workers suggested that an increase in expression levels of Ano1 in SMCs, isolated from chronic-hypoxic pulmonary hypertension rat, is responsible for enhanced current density of Ano1 (Sun et al., 2012). A similar result was observed in monocrotaline-induced pulmonary hypertension rat model (Forrest et al., 2012). In comparison, our results demonstrate that hypoxia enhances the density of Ano1-mediated ICl(Ca) not only through increasing expression of Ano1 but also through potentiating its sensitivity to Ca2+ and to membrane voltage. Recent studies suggest that a variety of Ano1 splicing variants are present in mouse heart (O'Driscoll et al., 2011). Therefore, we speculated that the hypoxia-induced increase in Ano1 expression levels and altered biophysical features of Ano1 in CVECs might be associated with the changes in the ratio of Ano1 splicing variants. We found that the relative mRNA expression levels of exons 6b and 13 excluded Ano1 variants were significantly up-regulated by hypoxia. Due to overexpression of exon 6b, omitted human Ano1 in HEK293 cells led to a significantly increased sensitivity to Ca2+ (Ferrera et al., 2009); we also speculate that hypoxia-induced increase in Ca2+ sensitivity of Ano1-mediated ICl(Ca) could be attributable to elevated expression levels of exon 6b excluded Ano1 variant in CVECs. Furthermore, hypoxia-induced increase in voltage sensitivity of Ano1-mediated ICl(Ca) might be caused by the increased fraction of exon 13 excluded Ano1 variant, since a reduction of the voltage dependence of activation was found in HEK293 cells expressing exon 13 deleted human Ano1 variant (Ferrera et al., 2009). Overexpression of exon 15 deleted human Ano1 variant in HEK293 resulted in a significant faster activation and deactivation kinetics (Mazzone et al., 2011). However, we did not detect if hypoxia caused changes in the relative ratio of exon 15 excluded Ano1 variant in CVECs. Finally, this hypoxia-induced increase in Ano1 current density might be, at least in part, due to Ca2+ overload under this condition (Abdallah et al., 2007).
Ano1 may be involved in hypertension-induced cerebrovascular remodelling, based upon the facts that knockdown of Ano1 facilitates and overexpression of Ano1 inhibits angiotensin II-induced cell cycle transition and cell proliferation in rat basilar SMCs (Wang et al., 2012). Other studies suggest that the function of Ano1 is an important factor for contraction of SMCs both in membrane potential-dependent and membrane potential-independent ways (Dam et al., 2013). Several studies have suggested that Ano1 expression levels are associated with cell proliferation including interstitial cells of Cajal in the small intestine (Stanich et al., 2011), head and neck squamous cell carcinoma cells, the T24 bladder cancer cells (Duvvuri et al., 2012) and the gastrointestinal stromal tumour cells (Simon et al., 2013). Our data suggest that hypoxia also induces an increase in the proliferation rate of CVECs; however, it appears that this hypoxia-induced proliferation is not due to enhanced Ano1 activity because T16Ainh-A01 (up to 30 μM for 48 h) did not affect the cell growth.
In summary, we suggest that Ano1 forms CaCC in CVECs and that hypoxia up-regulates Ano1-mediated ICl(Ca) via enhancing its expression levels and an altered expression ratio of Ano1 splicing variants, thereby potentiating its sensitivity to Ca2+ and the membrane voltage.
Acknowledgments
This study was supported by Key Project of Chinese National Program for Fundamental Research and Development (973 Program 2014CB542401, 2012CB517803 to Z. Z.), National Natural Science Foundation of China (30871007, 81270340 and 81320108002 to Z. Z.), Doctoral Tutor Foundation of Ministry of Education (20122307110008 to Z. Z.), Overseas Talent Foundation of Department of Education, Heilongjiang Province (1154HZ11 to Z. Z.) and the Natural Science Foundation of Heilongjiang Province (ZD200807-01, ZD200807-02 to Z. Z. and QC2010097 to D. Z.). This study was also supported by American Heart Association Western States Affiliate Grant-in-Aid (11GRNT7610161 to D. D.) and the National Institute of Health Grant (HL106256 to D. D.).
Glossary
- Ano1
anoctamin-1
- CaCC
calcium-activated chloride channel
- ICl(Ca)
calcium-activated chloride current
- CVEC
cardiac vascular endothelial cell
Author contributions
Z-RZ, DZ and DDD conceived and designed the experiments; M-MW, JL, B-LS, Y-FG, Y-CL, CY, Q-SW, T-XM and KM collected, analysed and interpreted the data; Z-RZ, DZ and M-MW drafted the manuscript; HCH and DDD revised the manuscript; and all authors approved the final version of the manuscript.
Conflict of interest
None declared.
Supporting information
Additional Supporting Information may be found in the online version of this article at the publisher's web-site:
http://dx.doi.org/10.1111/bph.12730
Figure S1 (A) Immunofluorescence images demonstrate the transfection efficiency. Images were taken by fluorescence microscope. The green colour represents GFP. Scale bars represent 40 μm. (B) qRT-PCR demonstrating the expression levels of Ano1 mRNA under indicated conditions (n = 6). (C) Representative immunoblots demonstrating the expression levels of Ano1 protein under different experimental conditions. (D) Summarized bar graph represents the abundance of Ano1 protein under different experimental conditions as indicated (n = 6). **Indicates P < 0.01 compared to either control or scramble shRNA transfected group.
Table S1 Specific shRNAs sequences for Ano1.
Table S2 Primers used for qRT-PCR of Ano1 exon variants.
Table S3 Oligo nucleotide primers for qRT-PCR.
Appendix S1 Methods and results.
References
- Abdallah Y, Gligorievski D, Kasseckert SA, Dieterich L, Schafer M, Kuhlmann CR, et al. The role of poly(ADP-ribose) polymerase (PARP) in the autonomous proliferative response of endothelial cells to hypoxia. Cardiovasc Res. 2007;73:568–574. doi: 10.1016/j.cardiores.2006.11.027. [DOI] [PubMed] [Google Scholar]
- Alexander SPH, Benson HE, Faccenda E, Pawson AJ, Sharman JL, Catterall WA, et al. The Concise Guide to PHARMACOLOGY 2013/14: Ion Channels. Br J Pharmacol. 2013;170:1607–1651. doi: 10.1111/bph.12447. [DOI] [PMC free article] [PubMed] [Google Scholar]
- Caputo A, Caci E, Ferrera L, Pedemonte N, Barsanti C, Sondo E, et al. TMEM16A, a membrane protein associated with calcium-dependent chloride channel activity. Science. 2008;322:590–594. doi: 10.1126/science.1163518. [DOI] [PubMed] [Google Scholar]
- Dam VS, Boedtkjer DM, Nyvad J, Aalkjaer C, Matchkov V. TMEM16A knockdown abrogates two different Ca-activated Cl currents and contractility of smooth muscle in rat mesenteric small arteries. Pflugers Arch. 2013 doi: 10.1007/s00424-013-1382-1. doi: 10.1007/s00424-013-1382-1. [DOI] [PMC free article] [PubMed] [Google Scholar]
- Davis AJ, Forrest AS, Jepps TA, Valencik ML, Wiwchar M, Singer CA, et al. Expression profile and protein translation of TMEM16A in murine smooth muscle. Am J Physiol Cell Physiol. 2010;299:C948–C959. doi: 10.1152/ajpcell.00018.2010. [DOI] [PMC free article] [PubMed] [Google Scholar]
- Davis AJ, Shi J, Pritchard HA, Chadha PS, Leblanc N, Vasilikostas G, et al. Potent vasorelaxant activity of the TMEM16A inhibitor T16A(inh) -A01. Br J Pharmacol. 2013;168:773–784. doi: 10.1111/j.1476-5381.2012.02199.x. [DOI] [PMC free article] [PubMed] [Google Scholar]
- Dutta AK, Khimji AK, Kresge C, Bugde A, Dougherty M, Esser V, et al. Identification and functional characterization of TMEM16A, a Ca2+-activated Cl− channel activated by extracellular nucleotides, in biliary epithelium. J Biol Chem. 2011;286:766–776. doi: 10.1074/jbc.M110.164970. [DOI] [PMC free article] [PubMed] [Google Scholar]
- Duvvuri U, Shiwarski DJ, Xiao D, Bertrand C, Huang X, Edinger RS, et al. TMEM16A induces MAPK and contributes directly to tumorigenesis and cancer progression. Cancer Res. 2012;72:3270–3281. doi: 10.1158/0008-5472.CAN-12-0475-T. [DOI] [PMC free article] [PubMed] [Google Scholar]
- Ferrera L, Caputo A, Ubby I, Bussani E, Zegarra-Moran O, Ravazzolo R, et al. Regulation of TMEM16A chloride channel properties by alternative splicing. J Biol Chem. 2009;284:33360–33368. doi: 10.1074/jbc.M109.046607. [DOI] [PMC free article] [PubMed] [Google Scholar]
- Ferrera L, Scudieri P, Sondo E, Caputo A, Caci E, Zegarra-Moran O, et al. A minimal isoform of the TMEM16A protein associated with chloride channel activity. Biochim Biophys Acta. 2011;1808:2214–2223. doi: 10.1016/j.bbamem.2011.05.017. [DOI] [PMC free article] [PubMed] [Google Scholar]
- Forrest AS, Joyce TC, Huebner ML, Ayon RJ, Wiwchar M, Joyce J, et al. Increased TMEM16A-encoded calcium-activated chloride channel activity is associated with pulmonary hypertension. Am J Physiol Cell Physiol. 2012;303:C1229–C1243. doi: 10.1152/ajpcell.00044.2012. [DOI] [PMC free article] [PubMed] [Google Scholar]
- Hartzell C, Putzier I, Arreola J. Calcium-activated chloride channels. Annu Rev Physiol. 2005;67:719–758. doi: 10.1146/annurev.physiol.67.032003.154341. [DOI] [PubMed] [Google Scholar]
- Hartzell HC, Yu K, Xiao Q, Chien LT, Qu Z. Anoctamin/TMEM16 family members are Ca2+-activated Cl− channels. J Physiol. 2009;587((Pt 10)):2127–2139. doi: 10.1113/jphysiol.2008.163709. [DOI] [PMC free article] [PubMed] [Google Scholar]
- He Q, Halm ST, Zhang J, Halm DR. Activation of the basolateral membrane Cl− conductance essential for electrogenic K+ secretion suppresses electrogenic Cl− secretion. Exp Physiol. 2011;96:305–316. doi: 10.1113/expphysiol.2010.055038. [DOI] [PMC free article] [PubMed] [Google Scholar]
- Hille B. Ionic Channels of Excitable Membranes. 2nd edn. Sunderland, MA: Sinauer Associates; 1992. [Google Scholar]
- Hosoki E, Iijima T. Chloride-sensitive Ca2+ entry by histamine and ATP in human aortic endothelial cells. Eur J Pharmacol. 1994;266:213–218. doi: 10.1016/0922-4106(94)90129-5. [DOI] [PubMed] [Google Scholar]
- Huang F, Rock JR, Harfe BD, Cheng T, Huang X, Jan YN, et al. Studies on expression and function of the TMEM16A calcium-activated chloride channel. Proc Natl Acad Sci U S A. 2009;106:21413–21418. doi: 10.1073/pnas.0911935106. [DOI] [PMC free article] [PubMed] [Google Scholar]
- Hwang SJ, Blair PJ, Britton FC, O'Driscoll KE, Hennig G, Bayguinov YR, et al. Expression of anoctamin 1/TMEM16A by interstitial cells of Cajal is fundamental for slow wave activity in gastrointestinal muscles. J Physiol. 2009;587((Pt 20)):4887–4904. doi: 10.1113/jphysiol.2009.176198. [DOI] [PMC free article] [PubMed] [Google Scholar]
- Isner JM, Losordo DW. Therapeutic angiogenesis for heart failure. Nat Med. 1999;5:491–492. doi: 10.1038/8374. [DOI] [PubMed] [Google Scholar]
- Kilkenny C, Browne W, Cuthill IC, Emerson M, Altman DG. Animal research: reporting in vivo experiments: the ARRIVE guidelines. Br J Pharmacol. 2010;160:1577–1579. doi: 10.1111/j.1476-5381.2010.00872.x. [DOI] [PMC free article] [PubMed] [Google Scholar]
- Kuruma A, Hartzell HC. Bimodal control of a Ca(2+)-activated Cl(−) channel by different Ca(2+) signals. J Gen Physiol. 2000;115:59–80. doi: 10.1085/jgp.115.1.59. [DOI] [PMC free article] [PubMed] [Google Scholar]
- Li W, Petrimpol M, Molle KD, Hall MN, Battegay EJ, Humar R. Hypoxia-induced endothelial proliferation requires both mTORC1 and mTORC2. Circ Res. 2007;100:79–87. doi: 10.1161/01.RES.0000253094.03023.3f. [DOI] [PubMed] [Google Scholar]
- McGrath JC, Drummond GB, McLachlan EM, Kilkenny C, Wainwright CL. Guidelines for reporting experiments involving animals: the ARRIVE guidelines. Br J Pharmacol. 2010;160:1573–1576. doi: 10.1111/j.1476-5381.2010.00873.x. [DOI] [PMC free article] [PubMed] [Google Scholar]
- Manoury B, Tamuleviciute A, Tammaro P. TMEM16A/anoctamin 1 protein mediates calcium-activated chloride currents in pulmonary arterial smooth muscle cells. J Physiol. 2010;588((Pt 13)):2305–2314. doi: 10.1113/jphysiol.2010.189506. [DOI] [PMC free article] [PubMed] [Google Scholar]
- Mazzone A, Bernard CE, Strege PR, Beyder A, Galietta LJ, Pasricha PJ, et al. Altered expression of Ano1 variants in human diabetic gastroparesis. J Biol Chem. 2011;286:13393–13403. doi: 10.1074/jbc.M110.196089. [DOI] [PMC free article] [PubMed] [Google Scholar]
- Nilius B, Prenen J, Szucs G, Wei L, Tanzi F, Voets T, et al. Calcium-activated chloride channels in bovine pulmonary artery endothelial cells. J Physiol. 1997;498((Pt 2)):381–396. doi: 10.1113/jphysiol.1997.sp021865. [DOI] [PMC free article] [PubMed] [Google Scholar]
- O'Driscoll KE, Pipe RA, Britton FC. Increased complexity of Tmem16a/Anoctamin 1 transcript alternative splicing. BMC Mol Biol. 2011;12:35. doi: 10.1186/1471-2199-12-35. [DOI] [PMC free article] [PubMed] [Google Scholar]
- Ono K, Nakao M, Iijima T. Chloride-sensitive nature of the histamine-induced Ca2+ entry in cultured human aortic endothelial cells. J Physiol. 1998;511((Pt 3)):837–849. doi: 10.1111/j.1469-7793.1998.837bg.x. [DOI] [PMC free article] [PubMed] [Google Scholar]
- Ousingsawat J, Martins JR, Schreiber R, Rock JR, Harfe BD, Kunzelmann K. Loss of TMEM16A causes a defect in epithelial Ca2+-dependent chloride transport. J Biol Chem. 2009;284:28698–28703. doi: 10.1074/jbc.M109.012120. [DOI] [PMC free article] [PubMed] [Google Scholar]
- Pifferi S, Dibattista M, Menini A. TMEM16B induces chloride currents activated by calcium in mammalian cells. Pflugers Arch. 2009;458:1023–1038. doi: 10.1007/s00424-009-0684-9. [DOI] [PubMed] [Google Scholar]
- Qu Z, Wei RW, Hartzell HC. Characterization of Ca2+-activated Cl− currents in mouse kidney inner medullary collecting duct cells. Am J Physiol Renal Physiol. 2003;285:F326–F335. doi: 10.1152/ajprenal.00034.2003. [DOI] [PubMed] [Google Scholar]
- Rock JR, O'Neal WK, Gabriel SE, Randell SH, Harfe BD, Boucher RC, et al. Transmembrane protein 16A (TMEM16A) is a Ca2+-regulated Cl− secretory channel in mouse airways. J Biol Chem. 2009;284:14875–14880. doi: 10.1074/jbc.C109.000869. [DOI] [PMC free article] [PubMed] [Google Scholar]
- Romanenko VG, Catalan MA, Brown DA, Putzier I, Hartzell HC, Marmorstein AD, et al. Tmem16A encodes the Ca2+-activated Cl− channel in mouse submandibular salivary gland acinar cells. J Biol Chem. 2010;285:12990–13001. doi: 10.1074/jbc.M109.068544. [DOI] [PMC free article] [PubMed] [Google Scholar]
- Schroeder BC, Cheng T, Jan YN, Jan LY. Expression cloning of TMEM16A as a calcium-activated chloride channel subunit. Cell. 2008;134:1019–1029. doi: 10.1016/j.cell.2008.09.003. [DOI] [PMC free article] [PubMed] [Google Scholar]
- Simon S, Grabellus F, Ferrera L, Galietta L, Schwindenhammer B, Muhlenberg T, et al. DOG1 regulates growth and IGFBP5 in gastrointestinal stromal tumors. Cancer Res. 2013;73:3661–3670. doi: 10.1158/0008-5472.CAN-12-3839. [DOI] [PMC free article] [PubMed] [Google Scholar]
- Stanich JE, Gibbons SJ, Eisenman ST, Bardsley MR, Rock JR, Harfe BD, et al. Ano1 as a regulator of proliferation. Am J Physiol Gastrointest Liver Physiol. 2011;301:G1044–G1051. doi: 10.1152/ajpgi.00196.2011. [DOI] [PMC free article] [PubMed] [Google Scholar]
- Suh SH, Vennekens R, Manolopoulos VG, Freichel M, Schweig U, Prenen J, et al. Characterisation of explanted endothelial cells from mouse aorta: electrophysiology and Ca2+ signalling. Pflugers Arch. 1999;438:612–620. doi: 10.1007/s004249900085. [DOI] [PubMed] [Google Scholar]
- Sun H, Xia Y, Paudel O, Yang XR, Sham JS. Chronic hypoxia-induced upregulation of Ca2+-activated Cl− channel in pulmonary arterial myocytes: a mechanism contributing to enhanced vasoreactivity. J Physiol. 2012;590((Pt 15)):3507–3521. doi: 10.1113/jphysiol.2012.232520. [DOI] [PMC free article] [PubMed] [Google Scholar]
- Thomas-Gatewood C, Neeb ZP, Bulley S, Adebiyi A, Bannister JP, Leo MD, et al. TMEM16A channels generate Ca(2)-activated Cl currents in cerebral artery smooth muscle cells. Am J Physiol Heart Circ Physiol. 2011;301:H1819–H1827. doi: 10.1152/ajpheart.00404.2011. [DOI] [PMC free article] [PubMed] [Google Scholar]
- Wang M, Yang H, Zheng LY, Zhang Z, Tang YB, Wang GL, et al. Downregulation of TMEM16A calcium-activated chloride channel contributes to cerebrovascular remodeling during hypertension by promoting basilar smooth muscle cell proliferation. Circulation. 2012;125:697–707. doi: 10.1161/CIRCULATIONAHA.111.041806. [DOI] [PubMed] [Google Scholar]
- Xiao Q, Yu K, Perez-Cornejo P, Cui Y, Arreola J, Hartzell HC. Voltage- and calcium-dependent gating of TMEM16A/Ano1 chloride channels are physically coupled by the first intracellular loop. Proc Natl Acad Sci U S A. 2011;108:8891–8896. doi: 10.1073/pnas.1102147108. [DOI] [PMC free article] [PubMed] [Google Scholar]
- Yang YD, Cho H, Koo JY, Tak MH, Cho Y, Shim WS, et al. TMEM16A confers receptor-activated calcium-dependent chloride conductance. Nature. 2008;455:1210–1215. doi: 10.1038/nature07313. [DOI] [PubMed] [Google Scholar]
- Yu K, Lujan R, Marmorstein A, Gabriel S, Hartzell HC. Bestrophin-2 mediates bicarbonate transport by goblet cells in mouse colon. J Clin Invest. 2010;120:1722–1735. doi: 10.1172/JCI41129. [DOI] [PMC free article] [PubMed] [Google Scholar]
- Zhong N, Fang QZ, Zhang Y, Zhou ZN. Volume- and calcium-activated chloride channels in human umbilical vein endothelial cells. Acta Pharmacol Sin. 2000;21:215–220. [PubMed] [Google Scholar]
- Zhou Y, Zhang Y, Gao F, Guo F, Wang J, Cai W, et al. N-n-butyl haloperidol iodide protects cardiac microvascular endothelial cells from hypoxia/reoxygenation injury by down-regulating Egr-1 expression. Cell Physiol Biochem. 2010;26:839–848. doi: 10.1159/000323993. [DOI] [PubMed] [Google Scholar]
Associated Data
This section collects any data citations, data availability statements, or supplementary materials included in this article.
Supplementary Materials
Figure S1 (A) Immunofluorescence images demonstrate the transfection efficiency. Images were taken by fluorescence microscope. The green colour represents GFP. Scale bars represent 40 μm. (B) qRT-PCR demonstrating the expression levels of Ano1 mRNA under indicated conditions (n = 6). (C) Representative immunoblots demonstrating the expression levels of Ano1 protein under different experimental conditions. (D) Summarized bar graph represents the abundance of Ano1 protein under different experimental conditions as indicated (n = 6). **Indicates P < 0.01 compared to either control or scramble shRNA transfected group.
Table S1 Specific shRNAs sequences for Ano1.
Table S2 Primers used for qRT-PCR of Ano1 exon variants.
Table S3 Oligo nucleotide primers for qRT-PCR.
Appendix S1 Methods and results.