Significance
Single-particle tracking in living cells provides a way to identify a particle's binding state based on how it moves. In this work, we track fluorescently labeled ribosomal subunits in bacterial cells. We show that translating ribosomes move much slower than free subunits. More importantly, we show that it is only translating ribosomes that are excluded from the bacterial nucleoid, whereas free subunits have full access to the nucleoid. This finding is important because several gene-regulation mechanisms require that ribosomes are able to initiate translation as soon as the RNA polymerase has initiated transcription, and it has been difficult to reconcile such a requirement with the observation that ribosomes are nucleoid-excluded.
Keywords: nucleoid exclusion, transcription-translation coupling, antibiotics, single-molecule tracking, single-molecule imaging
Abstract
Biochemical and genetic data show that ribosomes closely follow RNA polymerases that are transcribing protein-coding genes in bacteria. At the same time, electron and fluorescence microscopy have revealed that ribosomes are excluded from the Escherichia coli nucleoid, which seems to be inconsistent with fast translation initiation on nascent mRNA transcripts. The apparent paradox can be reconciled if translation of nascent mRNAs can start throughout the nucleoid before they relocate to the periphery. However, this mechanism requires that free ribosomal subunits are not excluded from the nucleoid. Here, we use single-particle tracking in living E. coli cells to determine the fractions of free ribosomal subunits, classify individual subunits as free or mRNA-bound, and quantify the degree of exclusion of bound and free subunits separately. We show that free subunits are not excluded from the nucleoid. This finding strongly suggests that translation of nascent mRNAs can start throughout the nucleoid, which reconciles the spatial separation of DNA and ribosomes with cotranscriptional translation. We also show that, after translation inhibition, free subunit precursors are partially excluded from the compacted nucleoid. This finding indicates that it is active translation that normally allows ribosomal subunits to assemble on nascent mRNAs throughout the nucleoid and that the effects of translation inhibitors are enhanced by the limited access of ribosomal subunits to nascent mRNAs in the compacted nucleoid.
In bacteria, translation often starts soon after the ribosome-binding site emerges from the RNA exit channel of the RNA polymerase. The transcribing RNA polymerase is then closely followed by translating ribosomes in such a way that the overall transcription elongation rate is tightly controlled by the translation rate (1). This coupling between transcription and translation of nascent mRNAs is important for regulatory mechanisms that respond to the formation of gaps between the transcribing RNA polymerases and the trailing ribosomes. Such gaps may, for example, allow the formation of secondary structures that allow RNA polymerases to proceed through transcription termination sites (2). The gaps may also allow the transcription termination factor Rho to access the nascent mRNAs and terminate transcription (3).
Bacterial 70S ribosomes are formed when large 50S subunits and small 30S subunits assemble on mRNAs. Electron and fluorescence microscopy have revealed that ribosomes are excluded from the Escherichia coli nucleoid (4–6), but this spatial separation of DNA and ribosomes has not yet been reconciled with cotranscriptional translation. The paradox can be resolved if translation of nascent mRNAs can start throughout the nucleoid before they relocate to the periphery (7). However, this mechanism requires that free ribosomal subunits are not excluded from the nucleoid.
To determine whether free ribosomal subunits are excluded from the nucleoid, we use single-particle tracking, a technique that allows for quantitative analysis of the localization and movement of particles. In this technique, trajectories are constructed by determining and connecting the positions of individual particles from consecutive time-lapse images. Importantly, such trajectories can be used to determine whether an individual particle is bound or free if the free particle diffuses significantly faster than its binding targets and remains bound or free for a long time (8, 9). Recent advances have made it possible to track hundreds of particles in each cell by labeling the particles of interest with photoactivatable or photoconvertible fluorescent proteins and tracking one or a few at a time (10, 11). We use this approach to determine whether individual subunits are free or mRNA-bound and to quantify the degree of nucleoid exclusion of bound and free subunits separately. As a complement, we also determine the spatial distributions of the subunits throughout the bacterial cell-division cycle.
Results
Fractions of Free Ribosomal Subunits.
To obtain trajectories for ribosomal subunits, we constructed E. coli strains that express the 50S ribosomal protein L1 and 30S ribosomal protein S2 as fusions to the photoconvertible fluorescent protein mEos2 (12) from their endogenous loci. The labeling did not affect the growth of the cells (SI Appendix, Fig. S1), showing that the function of the mEos2-labeled ribosomes was not significantly impaired. To determine how fast free ribosomal subunits diffuse, we tracked them in cells treated with the antibiotic rifampicin, which inhibits transcription and leads to depletion of mRNA-bound ribosomal subunits (13). The apparent diffusion coefficients of the subunits in the rifampicin-treated cells (Fig. 1A) are one order of magnitude lower than the corresponding coefficients of a freely diffusing fluorescent protein (SI Appendix, Fig. S2) (8), showing that we tracked ribosomal subunits as opposed to unincorporated L1- or S2-mEos2.
Fig. 1.
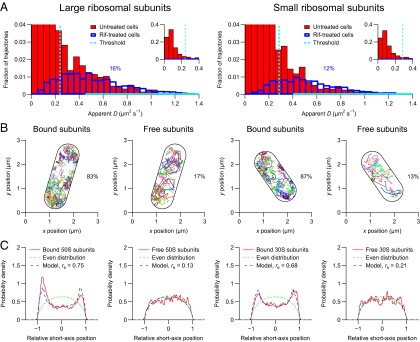
Tracking of individual ribosomal subunits in living E. coli cells. The cells were imaged at 50 Hz for 5 min on agarose pads with a laser excitation exposure time of 5 ms. The geometries of the imaged cells were determined from the positions of the individual ribosomal subunits. The lengths of the imaged cells were determined to be between 1.8 and 2.9 µm. Similar results are obtained if the geometries of the imaged cells are determined from out-of-focus bright-field images (SI Appendix, Fig. S9). (A) Distributions of apparent diffusion coefficients of individual large (Left) and small (Right) ribosomal subunits. The distributions in the untreated cells (red bars) are fitted with the corresponding distributions in rifampicin-treated cells (blue outlines) in the regions indicated by solid cyan lines. Each distribution corresponds to >1,000 trajectories from eight cells. (B) Trajectories of individual ribosomal subunits. Trajectories of free and mRNA-bound subunits are plotted separately. (C) Distributions of relative short-axis positions of bound and free ribosomal subunits in the cylindrical parts of eight cells (solid red curves) fitted with a model for nucleoid-excluded particles (dashed blue curves). Each distribution corresponds to >1,000 positions. The relative exclusion radius (re) is 0 for an evenly distributed particle (dashed green curves) and 1 for a membrane-bound particle.
We estimated the fractions of the free large and small subunits to be 0.16 and 0.12, respectively, which is in agreement with the observation that 15% of the ribosomal subunits are free, irrespective of the growth medium (14). The estimates were performed by treating each distribution of apparent diffusion coefficients in the untreated cells as the sum of an unknown distribution for the bound subunits and a known distribution in the rifampicin-treated cells (Fig. 1A), where all ribosomal subunits are free (13) and are assumed to diffuse as fast as in the untreated cells. To verify that the rifampicin treatment does not radically change the overall diffusivity in the cell, we tracked the photoconvertible fluorescent protein Dendra2 in untreated and rifampicin-treated cells and found that the mean apparent diffusion coefficients were only marginally different (10.1 ± 0.2 µm2⋅s−1 compared with 11.6 ± 0.4 µm2⋅s−1) (SI Appendix, Fig. S2).
Free Ribosomal Subunits Are Not Excluded from the Nucleoid.
To classify the individual subunits in the untreated cells as bound or free, we determined thresholds for the apparent diffusion coefficients of the individual subunits that give 16% and 12% free large and small subunits, respectively (SI Appendix, Table S1). We estimated the classification precisions for the individual subunits to be at least 80% (SI Appendix, Table S1) by classifying the subunits in the rifampicin-treated cells (SI Appendix, Fig. S3), where all ribosomal subunits are free (13). To determine whether free subunits are excluded from the nucleoid, we classified the subunits in the untreated cells (Fig. 1B and SI Appendix, Figs. S4 and S5) and determined the spatial distributions of the bound and free subunits separately (Fig. 1C). The spatial distributions confirm that bound subunits are excluded from the nucleoid and reveal that free subunits are not excluded from the nucleoid. To quantify the degree of exclusion, we fitted the spatial distributions of the subunits with a model in which the subunits are excluded from a cylinder of unknown radius in the center of the cell (Fig. 1C). This model of the nucleoid is very simple compared with state-of-the-art, four-dimensional descriptions of the nucleoid in individual cells (15). However, because the analysis was performed on the average distribution in several cells, we would not have been able to confidently fit a model with more parameters. Using our simple model, we determined that bound large and small subunits are excluded from 56% and 46% of the space in the cylindrical parts of the cells, respectively, and that free subunits are excluded from <5% of the space in the cylindrical parts of the cells (Fig. 1C).
To determine whether the trajectory classification is robust despite the relatively short trajectories, we simulated trajectories of bound and free particles with the same length distributions as in the experimental data (SI Appendix, Fig. S6) and analyzed them in the same way as described above (SI Appendix, Fig. S7 and Table S2). The analysis resulted in accurate estimates of the fraction of free particles and the classification precisions (SI Appendix, Table S2).
To determine whether the spatial distribution of the free subunits differs significantly at different stages of the cell-division cycle, we performed high-throughput tracking of small ribosomal subunits in thousands of exponentially growing cells in a microfluidic device. We classified the subunits as bound or free by determining a threshold that gives 12% free small subunits and mapped the trajectories to the internal coordinates of each cell. The classification and the mapping allowed us to determine the average spatial distributions of bound and free subunits in cells of different sizes (Fig. 2). We also determined the spatial distributions of the nucleoid by performing high-throughput single-molecule imaging of mEos2-labeled alpha subunits of the nucleoid-associated protein HU, which has been shown to be distributed throughout the E. coli nucleoid (5, 15). The spatial distributions reveal that, unlike the nucleoid, bound subunits occupy the center of the cell at later stages of the cell-division cycle and that the spatial distribution of the free subunits does not differ significantly at different stages of the cell-division cycle (Fig. 2).
Fig. 2.
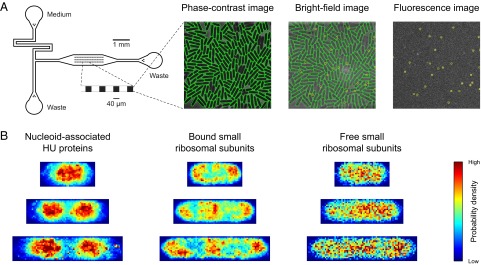
High-throughput imaging and tracking of individual HU proteins and small ribosomal subunits in living E. coli cells in microfluidic devices. (A) Phase-contrast (Center Left), bright-field (Center Right), and fluorescence (Right) images of a microcolony in a microfluidic device (Left). The microfluidic device contains 51 cell traps with dimensions of 40 × 40 × 0.9 µm3. Each trap contains ∼200 E. coli cells that grow in a monolayer. The traps are surrounded by 10-µm-deep flow channels that provide the cells with fresh medium for exponential growth and flush out cells that grow out of the traps. The cell contours are determined from the phase-contrast image. The bright-field and phase-contrast images are used to map the positions of the HU proteins and ribosomal subunits to internal cell coordinates. (B) Spatial distributions of HU proteins (Left) and small bound (Center) and free (Right) ribosomal subunits in living E. coli cells at different stages of the cell-division cycle. Each microcolony was imaged at 50 Hz for 32 s with a laser excitation exposure time of 5 ms. The probability density maps were constructed by generating histograms of normalized positions for three different cell length intervals. The cell length intervals are 1.5–2.5 µm, 2.5–3.5 µm, and 3.5–4.5 µm. Each probability density map corresponds to >5,000 positions from >500 cells.
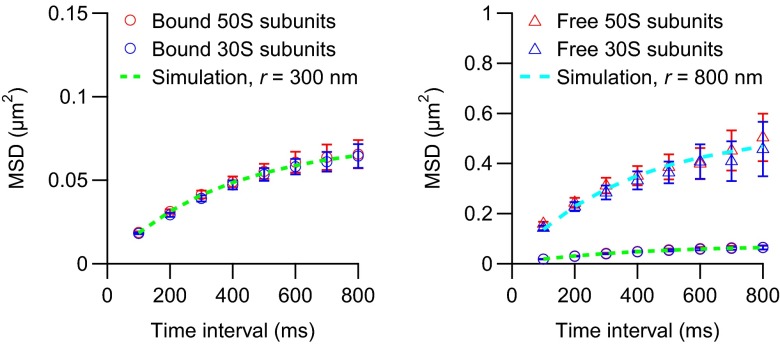
It has been observed that ribosomes display confined diffusion in bacteria (8, 16). To determine whether free ribosomal subunits also display confined diffusion, we tracked the subunits at a lower frame rate and classified them as bound or free by determining thresholds that give 16% and 12% free large and small subunits, respectively. The mean square displacements of the bound subunits plateau at 0.07 µm2, which corresponds to diffusion in a sphere with a radius of 300 nm (Fig. 3). As expected, the bound large and small subunits plateau at the same low level, which strongly suggests that they are part of the same mRNA complexes. In contrast, the mean square displacements of the free subunits approach a level corresponding to cellular confinement (Fig. 3).
Fig. 3.
Mean square displacements of mRNA-bound (Left) and free (Right) ribosomal subunits in living E. coli cells. The cells were imaged at 10 Hz for 5 min on agarose pads with a laser excitation exposure time of 5 ms. The mean square displacements of the bound subunits are also included in the right plot as a reference. Each experimental curve corresponds to >70 trajectories from 16 cells. The simulated mean square displacements (dashed curves) were obtained by simulating 10,000 normal diffusion trajectories in a sphere with a radius of 300 (green curve) or 800 (cyan curve) nm. The diffusion coefficient was set to 0.055 (green curve) or 0.40 (cyan curve) μm2·s−1. The error bars represent SEMs.
Free Ribosomal Subunit Precursors Are Partially Excluded from the Compacted Nucleoid after Translation Inhibition.
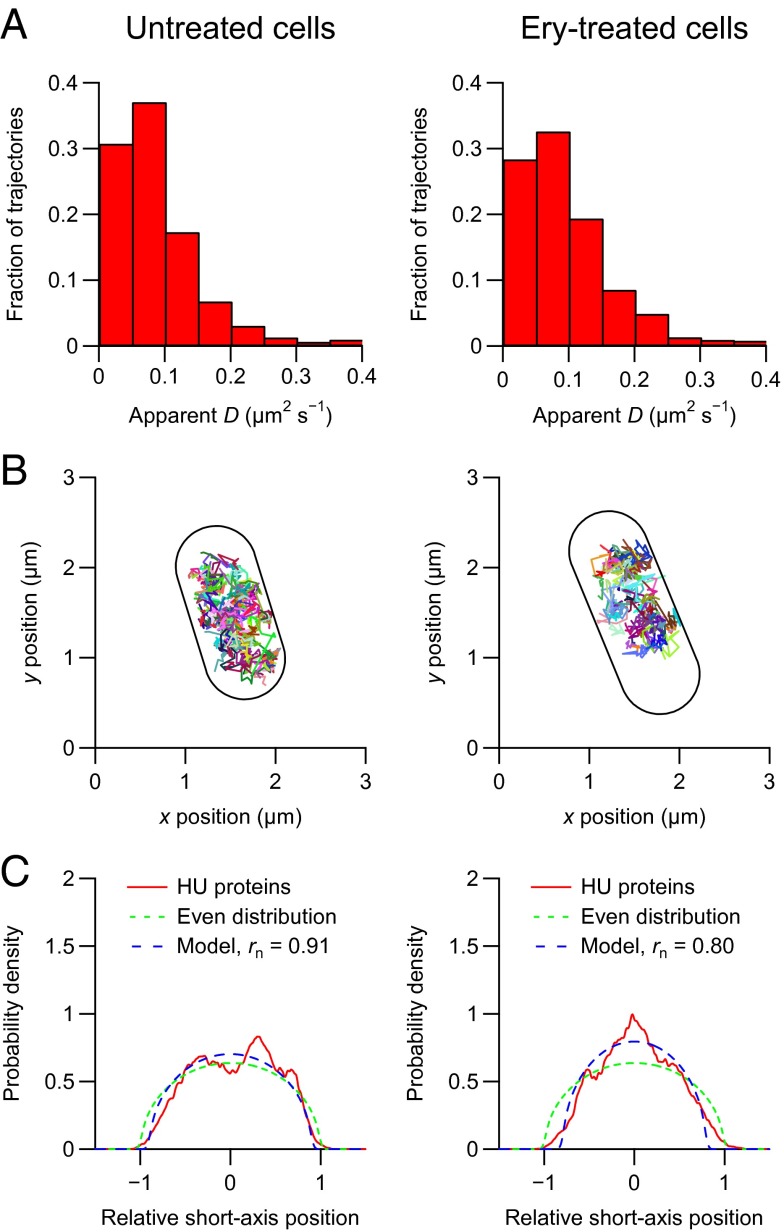
To determine the effects of translation on nucleoid exclusion, we used the antibiotic erythromycin, which inhibits translation and induces an accumulation of ribosomal precursor particles (17, 18). First, we determined the effects of translation on the size of the nucleoid by tracking HU proteins in untreated and erythromycin-treated cells (Fig. 4). The apparent diffusion coefficients of the HU proteins (Fig. 4A) are two orders of magnitude lower than the corresponding coefficients for a freely diffusing fluorescent protein (SI Appendix, Fig. S2) (8), showing that we only tracked DNA-bound HU proteins. To estimate the change in the size of the nucleoid, we fitted the spatial distributions of the HU proteins with a model in which the nucleoid is a cylinder of unknown radius in the center of the cell (Fig. 4C). We determined that in erythromycin-treated cells, the nucleoid volume is at least 23% smaller than in untreated cells (Fig. 4C).
Fig. 4.
Tracking of individual HU proteins in untreated (Left) and erythromycin-treated (Right) E. coli cells. The cells were imaged at 50 Hz for 5 min on agarose pads with a laser excitation exposure time of 5 ms. The geometries of the imaged cells were determined from out-of-focus bright-field images. The lengths of the imaged cells were determined to be between 2.0 and 3.2 µm. (A) Distributions of apparent diffusion coefficients of individual HU proteins. Each distribution corresponds to >900 trajectories from eight cells. (B) Trajectories of individual HU proteins. (C) Distributions of relative short-axis positions of HU proteins in the cylindrical parts of eight cells (solid red curves) fitted with a model for nucleoid-associated particles (dashed blue curves). Each distribution corresponds to >10,000 positions. rn is the relative nucleoid radius.
Next, we tracked ribosomal particles in erythromycin-treated cells and analyzed the trajectories in the same way as described above (Fig. 5 and SI Appendix, Fig. S8). We determined the fractions of the free large and small precursors to be 0.21 and 0.27, respectively (Fig. 5A). As expected, the thresholds and the classification precisions are similar to the ones obtained from untreated cells (SI Appendix, Tables S1 and S3). Interestingly, the spatial distributions of the free precursors reveal that they are partially excluded from the nucleoid (Fig. 5C). We determined that the free large and small precursors are excluded from 20% and 29% of the space in the cylindrical parts of the cells, respectively (Fig. 5C).
Fig. 5.
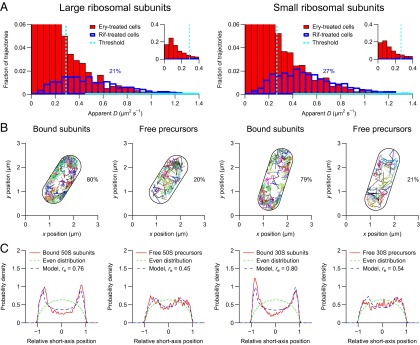
Tracking of individual ribosomal particles in erythromycin-treated E. coli cells. The cells were imaged at 50 Hz for 5 min on agarose pads with a laser excitation exposure time of 5 ms. The geometries of the imaged cells were determined from the positions of the individual ribosomal subunits. The lengths of the imaged cells were determined to be between 1.8 and 2.9 µm. Similar results are obtained if the geometries of the imaged cells are determined from out-of-focus bright-field images (SI Appendix, Fig. S10). (A) Distributions of apparent diffusion coefficients of individual ribosomal particles. (Left) Large ribosomal subunits. (Right) Small ribosomal subunits. The distributions in the erythromycin-treated cells (red bars) are fitted with the corresponding distributions in rifampicin-treated cells (blue outlines) in the regions indicated by solid cyan lines. Each distribution corresponds to >1,000 trajectories from eight cells. (B) Trajectories of individual ribosomal particles. Trajectories of free and mRNA-bound particles are plotted separately. (C) Distributions of relative short-axis positions of bound and free ribosomal particles in the cylindrical parts of eight cells (solid red curves) fitted with a model for nucleoid-excluded particles (dashed blue curves). Each distribution corresponds to >1,000 positions. The relative exclusion radius (re) is 0 for an evenly distributed particle (dashed green curves) and 1 for a membrane-bound particle.
Discussion
Using single-particle tracking in untreated and rifampicin-treated E. coli cells, we show that the mean apparent diffusion coefficient of free and mRNA-bound ribosomal subunits is four times lower than the mean apparent diffusion coefficient of free subunits alone. This difference allows us to determine the fractions of free subunits, classify individual subunits as bound or free, and quantify the degree of exclusion of bound and free subunits separately. We show that free subunits are not excluded from the nucleoid—that is, free subunits have full access to nascent mRNAs. Thus, nucleoid exclusion of ribosomes does not prevent cotranscriptional translation from starting throughout the nucleoid before the translating 70S ribosomes are translocated to the periphery, for example, by entropic forces (19).
Cotranscriptional translation may also contribute to the expansion of the nucleoid, which would explain why it is compacted when translation is inhibited with antibiotics. We show that after translation inhibition, free subunit precursors are partially excluded from the compacted nucleoid. This observation suggests that it is active translation that normally allows ribosomal subunits to access nascent mRNAs throughout the nucleoid. This effect results in a positive feedback loop in which active translation allows ribosomal subunits to assemble on nascent mRNAs throughout the nucleoid and continue translation in exponentially growing cells. Conversely, a situation could arise in which translation cannot start because ribosomal subunits have limited access to nascent mRNAs in the compacted nucleoid. This limited access would enhance the effects of translation inhibitors and result in extended lag phases when cells recover from conditions where nucleoids are more compact such as stationary phase.
Materials and Methods
Detailed materials and methods are provided in SI Appendix, SI Materials and Methods. Briefly, epifluorescence microscopes with laser excitation and sensitive detection were used. Strains expressing L1- or S2-mEos2 with a glycine residue as a linker were constructed by lambda Red-mediated insertion of DNA fragments encoding mEos2 and chloramphenicol acetyltransferase into the BW25993 chromosome (20). Dendra2 was expressed from a pQE30-derived plasmid in BW25993. Cells were grown at room temperature in M9 minimal medium supplemented with 0.4% glucose and RPMI 1640 amino acids. Where indicated, cells were treated with 200 µg⋅ml−1 erythromycin or rifampicin for 3 h and placed on a 2.5% (wt/vol) agarose pad containing fresh medium and 200 µg⋅ml−1 of the same antibiotic. Cells were imaged in microfluidic devices or on agarose pads as indicated in the figure legends. Data analysis and simulations were performed in IGOR Pro (version 6.32; WaveMetrics) and MATLAB (version R2014a; MathWorks). Positions of individual proteins and ribosomal subunits were determined by calculating the centroids of their images (microfluidics data) or by fitting elliptical Gaussian functions to their images (agarose pad data). Cell geometries of cells imaged in microfluidic devices were determined by fitting active contour models to phase-contrast images (21, 22). Cell geometries of cells imaged on agarose pads were approximated as cylinders with hemispherical caps and were determined from out-of-focus bright-field images or positions of individual ribosomal subunits. Trajectories were constructed by connecting points from consecutive images and were kept if they consisted of at least five points. Apparent diffusion coefficients were calculated from mean square displacements of individual proteins or ribosomal subunits over 5, 20, or 100 ms.
Supplementary Material
Acknowledgments
We thank Xiaowei Zhuang for providing a bacterial strain expressing HupA–mEos2 and members of the J.E. laboratory and the Ribosome Consortium of Research and Education for helpful discussions and comments on the manuscript. This work was supported by the European Research Council, Vetenskapsrådet, the Knut and Alice Wallenberg Foundation, and the Foundation for Strategic Research.
Footnotes
The authors declare no conflict of interest.
*This Direct Submission article had a prearranged editor.
This article contains supporting information online at www.pnas.org/lookup/suppl/doi:10.1073/pnas.1411558111/-/DCSupplemental.
References
- 1.Proshkin S, Rahmouni AR, Mironov A, Nudler E. Cooperation between translating ribosomes and RNA polymerase in transcription elongation. Science. 2010;328(5977):504–508. doi: 10.1126/science.1184939. [DOI] [PMC free article] [PubMed] [Google Scholar]
- 2.Yanofsky C. Attenuation in the control of expression of bacterial operons. Nature. 1981;289(5800):751–758. doi: 10.1038/289751a0. [DOI] [PubMed] [Google Scholar]
- 3.Richardson JP. Preventing the synthesis of unused transcripts by Rho factor. Cell. 1991;64(6):1047–1049. doi: 10.1016/0092-8674(91)90257-y. [DOI] [PubMed] [Google Scholar]
- 4.Hobot JA, et al. Shape and fine structure of nucleoids observed on sections of ultrarapidly frozen and cryosubstituted bacteria. J Bacteriol. 1985;162(3):960–971. doi: 10.1128/jb.162.3.960-971.1985. [DOI] [PMC free article] [PubMed] [Google Scholar]
- 5.Wang W, Li GW, Chen C, Xie XS, Zhuang X. Chromosome organization by a nucleoid-associated protein in live bacteria. Science. 2011;333(6048):1445–1449. doi: 10.1126/science.1204697. [DOI] [PMC free article] [PubMed] [Google Scholar]
- 6.Bakshi S, Siryaporn A, Goulian M, Weisshaar JC. Superresolution imaging of ribosomes and RNA polymerase in live Escherichia coli cells. Mol Microbiol. 2012;85(1):21–38. doi: 10.1111/j.1365-2958.2012.08081.x. [DOI] [PMC free article] [PubMed] [Google Scholar]
- 7.Campos M, Jacobs-Wagner C. Cellular organization of the transfer of genetic information. Curr Opin Microbiol. 2013;16(2):171–176. doi: 10.1016/j.mib.2013.01.007. [DOI] [PMC free article] [PubMed] [Google Scholar]
- 8.English BP, et al. Single-molecule investigations of the stringent response machinery in living bacterial cells. Proc Natl Acad Sci USA. 2011;108(31):E365–E373. doi: 10.1073/pnas.1102255108. [DOI] [PMC free article] [PubMed] [Google Scholar]
- 9.Uphoff S, Reyes-Lamothe R, Garza de Leon F, Sherratt DJ, Kapanidis AN. Single-molecule DNA repair in live bacteria. Proc Natl Acad Sci USA. 2013;110(20):8063–8068. doi: 10.1073/pnas.1301804110. [DOI] [PMC free article] [PubMed] [Google Scholar]
- 10.Manley S, et al. High-density mapping of single-molecule trajectories with photoactivated localization microscopy. Nat Methods. 2008;5(2):155–157. doi: 10.1038/nmeth.1176. [DOI] [PubMed] [Google Scholar]
- 11.Niu L, Yu J. Investigating intracellular dynamics of FtsZ cytoskeleton with photoactivation single-molecule tracking. Biophys J. 2008;95(4):2009–2016. doi: 10.1529/biophysj.108.128751. [DOI] [PMC free article] [PubMed] [Google Scholar]
- 12.McKinney SA, Murphy CS, Hazelwood KL, Davidson MW, Looger LL. A bright and photostable photoconvertible fluorescent protein. Nat Methods. 2009;6(2):131–133. doi: 10.1038/nmeth.1296. [DOI] [PMC free article] [PubMed] [Google Scholar]
- 13.Blundell MR, Wild DG. Altered ribosomes after inhibition of Escherichia coli by rifampicin. Biochem J. 1971;121(3):391–398. doi: 10.1042/bj1210391. [DOI] [PMC free article] [PubMed] [Google Scholar]
- 14.Forchhammer J, Lindahl L. Growth rate of polypeptide chains as a function of the cell growth rate in a mutant of Escherichia coli 15. J Mol Biol. 1971;55(3):563–568. doi: 10.1016/0022-2836(71)90337-8. [DOI] [PubMed] [Google Scholar]
- 15.Fisher JK, et al. Four-dimensional imaging of E. coli nucleoid organization and dynamics in living cells. Cell. 2013;153(4):882–895. doi: 10.1016/j.cell.2013.04.006. [DOI] [PMC free article] [PubMed] [Google Scholar]
- 16.Montero Llopis P, et al. Spatial organization of the flow of genetic information in bacteria. Nature. 2010;466(7302):77–81. doi: 10.1038/nature09152. [DOI] [PMC free article] [PubMed] [Google Scholar]
- 17.Siibak T, et al. Erythromycin- and chloramphenicol-induced ribosomal assembly defects are secondary effects of protein synthesis inhibition. Antimicrob Agents Chemother. 2009;53(2):563–571. doi: 10.1128/AAC.00870-08. [DOI] [PMC free article] [PubMed] [Google Scholar]
- 18.Siibak T, et al. Antibiotic-induced ribosomal assembly defects result from changes in the synthesis of ribosomal proteins. Mol Microbiol. 2011;80(1):54–67. doi: 10.1111/j.1365-2958.2011.07555.x. [DOI] [PubMed] [Google Scholar]
- 19.Mondal J, Bratton BP, Li Y, Yethiraj A, Weisshaar JC. Entropy-based mechanism of ribosome-nucleoid segregation in E. coli cells. Biophys J. 2011;100(11):2605–2613. doi: 10.1016/j.bpj.2011.04.030. [DOI] [PMC free article] [PubMed] [Google Scholar]
- 20.Datsenko KA, Wanner BL. One-step inactivation of chromosomal genes in Escherichia coli K-12 using PCR products. Proc Natl Acad Sci USA. 2000;97(12):6640–6645. doi: 10.1073/pnas.120163297. [DOI] [PMC free article] [PubMed] [Google Scholar]
- 21.Sliusarenko O, Heinritz J, Emonet T, Jacobs-Wagner C. High-throughput, subpixel precision analysis of bacterial morphogenesis and intracellular spatio-temporal dynamics. Mol Microbiol. 2011;80(3):612–627. doi: 10.1111/j.1365-2958.2011.07579.x. [DOI] [PMC free article] [PubMed] [Google Scholar]
- 22.Ullman G, et al. High-throughput gene expression analysis at the level of single proteins using a microfluidic turbidostat and automated cell tracking. Philos Trans R Soc Lond B Biol Sci. 2013;368(1611):20120025. doi: 10.1098/rstb.2012.0025. [DOI] [PMC free article] [PubMed] [Google Scholar]


