Significance
Bidirectional signaling between ligand and receptor facilitates cell–cell communication. Recent studies show that members of the well-known Semaphorin family proteins can mediate both forward and reverse signaling in regulating neural network formation. In this study, we identify new components of the Semaphorin reverse signaling pathway and reveal a novel mechanism by which Semaphorin reverse signaling promotes axon–axon attraction in patterning neuronal circuitry during development.
Abstract
Semaphorin family proteins are well-known axon guidance ligands. Recent studies indicate that certain transmembrane Semaphorins can also function as guidance receptors to mediate axon–axon attraction or repulsion. The mechanisms by which Semaphorin reverse signaling modulates axon-surface affinity, however, remain unknown. In this study, we reveal a novel mechanism underlying upregulation of axon–axon attraction by Semaphorin-1a (Sema1a) reverse signaling in the developing Drosophila visual system. Sema1a promotes the phosphorylation and activation of Moesin (Moe), a member of the ezrin/radixin/moesin family of proteins, and downregulates the level of active Rho1 in photoreceptor axons. We propose that Sema1a reverse signaling activates Moe, which in turn upregulates Fas2-mediated axon–axon attraction by inhibiting Rho1.
The Semaphorin family of proteins are well-known axon guidance cues or ligands, which activate their receptors on a variety of axons to control axonal pathfinding, fasciculation, branching, and target selection in vertebrates and invertebrates (1, 2). Recent studies demonstrate that certain transmembrane Semaphorins can also function as a receptor to mediate downstream signaling events in both vertebrates and invertebrates (3–7). For example, we show that the transmembrane Semaphorin-1a (Sema1a) functions as an axon guidance receptor for PlexinA (PlexA) in mediating reverse signaling in the developing Drosophila visual system (3, 8). Sema1a reverse signaling promotes photoreceptor (R cell) axon–axon attractions during the establishment of R-cell-to-optic-lobe connections (8). A recent study by Kolodkin and colleagues also demonstrates that Sema1a reverse signaling mediates axon–axon repulsion in Drosophila motor axon guidance (6).
To understand the mechanisms underlying upregulation of axon–axon attractions by Sema1a reverse signaling, we set out to examine potential genetic interactions between Sema1a and other genes in R-cell axon guidance. The establishment of R-cell-to-optic-lobe connections in the Drosophila adult visual system begins at the third-instar larval stage (9). At the third-instar larval stage, differentiating R cells in the eye-imaginal disk extend axons through the optic stalk into the developing optic lobe. R1–R6 axons terminate at the superficial lamina layer, where their growth cones closely associate with each other at the lamina termination site. R7 and R8 axons bypass the lamina and terminate in the deeper medulla layer.
In this study, we present evidence that Sema1a reverse signaling promotes R-cell axon–axon attraction by upregulating the adhesive function of Fasciclin 2 (Fas2). Sema1a interacts genetically and physically with Moesin (Moe), a member of the ezrin/radixin/moesin (ERM) family proteins, and downregulates the level of active Rho1. Our results support that Sema1a-induced reduction in the level of active Rho1 in R-cell axons contributes to an increase in Fas2-mediated R-cell axon–axon attraction.
Results
Sema1a Interacts with Fas2 in Regulating R-Cell Axonal Projections.
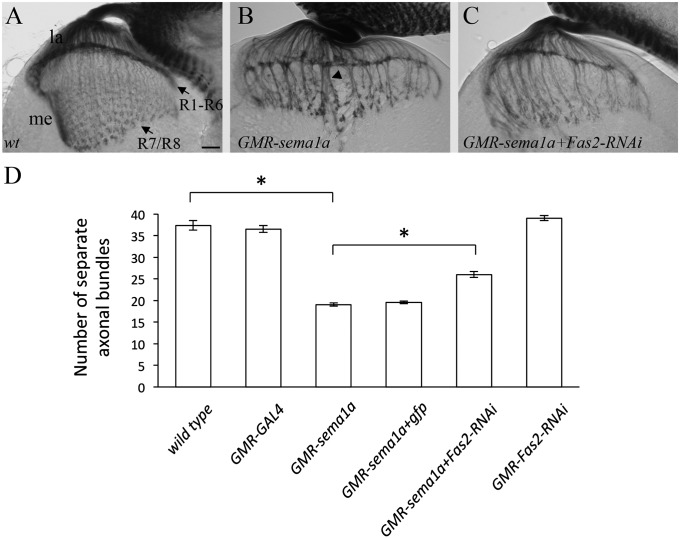
In our previous study (3), we showed that hyper-activation of Sema1a reverse signaling by Sema1a overexpression induces hyper-fasciculation of R-cell axons (Fig. 1B). To identify other components of the Sema1a reverse-signaling pathway, we tested if reducing the level of other genes (i.e., candidate genes encoding cell-surface receptors and intracellular signaling proteins) modifies the Sema1a hyper-activation phenotype. Interestingly, we found that eye-specific knockdown of Fas2 significantly suppressed the hyper-fasciculation phenotype induced by sema1a overexpression (Fig. 1 C and D and SI Appendix, Fig. S1), suggesting that Fas2 is a downstream target of Sema1a reverse signaling. Consistently, we found that Fas2, like Sema1a (3), is present in R-cell axons (SI Appendix, Fig. S2).
Fig. 1.
sema1a interacts genetically with Fas2 in R-cell axonal projections. (A) In wild-type third-instar larvae, R1–R6 growth cones form a smooth layer in the lamina intermediate target region. R7 and R8 axons extend into the medulla. (B) In flies overexpressing Sema1a in R-cell axons, R-cell axons formed thicker bundles (arrowhead). (C) Knockdown Fas2 in flies overexpressing Sema1a partially suppressed the hyper-fasciculation phenotype. Note that many individulas also displayed defects at the R1–R6 terminal layer. (D) The data were quantified by examining R-cell axonal projections in third-instar larvae with comparable eye-disk size (more than 10 rows of differentiating R-cell clusters). The number of separate axonal bundles that were located between lamina and medulla was counted. Overexpression of Sema1a induced the formation of thicker bundles and thus decreased the number of separate R-cell axonal bundles. *P < 0.001. la, lamina; me, medulla. (Scale bar, 20 μm.) Error bars: SEM.
Sema1a Promotes Fas2-Mediated Cell–Cell Adhesion.
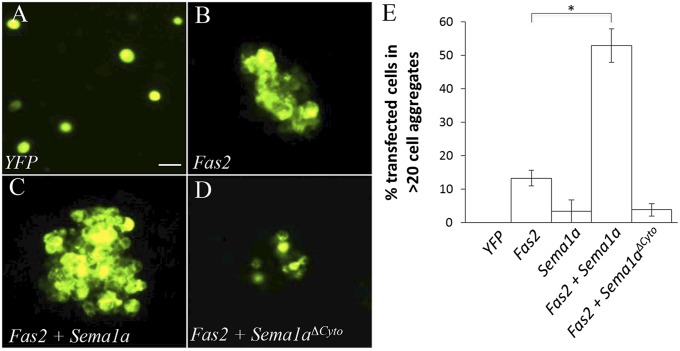
To determine the mechanisms underlying the observed genetic interaction between Fas2 and Sema1a, we performed cell culture study. Expression of Fas2-YFP in the Drosophila Schneider-2 cells (S2 cells) induced the formation of large homotypic cell aggregates (>20 cells) (Fig. 2 B and E), whereas cells transfected with YFP expression construct did not form large cell aggregates (Fig. 2 A and E). We found that expression of Sema1a greatly enhanced Fas2-mediated cell–cell adhesion (Fig. 2 C and E). To determine domain requirements, we tested a truncated Sema1a mutant (i.e., Sema1aΔCyto) in which a large portion of the cytoplasmic domain was deleted. Although Sema1aΔCyto was still capable of binding to PlexA (SI Appendix, Fig. S3), it did not enhance Fas2-mediated cell–cell aggregation (Fig. 2 D and E). This result indicates that Sema1a uses its cytoplasmic domain to activate downstream signaling events, which then upregulate the adhesive function of Fas2.
Fig. 2.
Sema1a enhances Fas2-mediated cell–cell adhesion. (A) Cells transfected with YFP expression construct did not form large cell aggregates (i.e., an aggregate with the size of >20 cells). (B) Cells expressing Fas2-YFP formed large cell aggregates (>20 cells). (C) Coexpression of Sema1a greatly increased the frequency of Fas2-induced cell aggregates and the size of aggregates. (D) Coexpression of a Sema1a mutant lacking a large portion of the cytoplasmic domain did not enhance Fas2-induced cell–cell aggregation. (E) The percentage of Fas2-positive cells that formed large cell aggregates (>20 cells) were quantified. The bar for YFP-transfected cells did not show up as no large cell aggregate (>20 cells) was observed. *P = 0.0019. (Scale bar, 20 μm.) Error bars: SEM.
Loss of Fas2 Causes a sema1a-Like Phenotype.
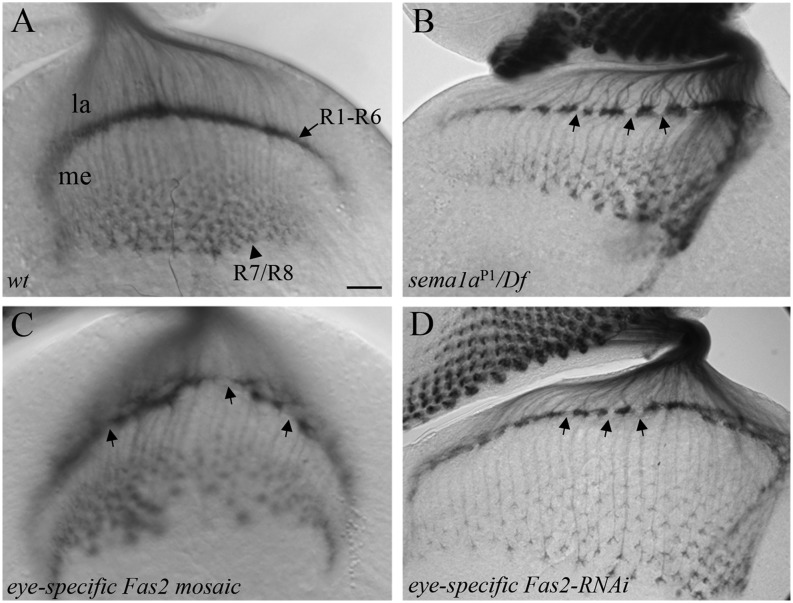
To examine if Fas2, like Sema1a, is required for R-cell axon–axon association in the developing optic lobe, we performed loss-of-function analysis. In wild type (Fig. 3A and SI Appendix, Fig. S4A), differentiating R cells project axons through the optic stalk into the optic lobe. R1–R6 axons terminate in the superficial lamina layer, where their growth cones associate closely with each other to form a dense and smooth layer at the lamina termination site. R7 and R8 axons extend through the lamina into the deeper medullar layer, where their growth cones expand significantly in size. In our previous studies (3), we showed that loss of Sema1a reverse signaling disrupts R-cell axon–axon association, leading to the appearance of many gaps at the lamina termination layer and frequently dispersed distribution of R-cell axonal terminals (∼72.7%, n = 11; Fig. 3B and SI Appendix, Fig. S4 B and C). We performed eye-specific genetic mosaic analysis to generate large clones of homozygous Fas2 mutant cells in third-instar eye discs (Fig. 3C). Like sema1a mutants (Fig. 3B), Fas2 eye-specific mosaic animals displayed a discontinuous and loose R-cell lamina termination layer (∼70%, n = 50; Fig. 3C and SI Appendix, Fig. S4D). A similar phenotype was also observed when Fas2 was knocked down in R-cell axons (∼79.3%, n = 29; Fig. 3D and SI Appendix, Fig. S2C).
Fig. 3.
Loss of Fas2 disrupts R-cell axon–axon association. (A) Wild type. (B) In mutants defective in Sema1a reverse signaling [e.g., sema1aP1/Df(2L)BSC204], R-cell axons displayed defects in axon–axon attraction, leading to the appearance of many gaps (more than three; arrows) at the lamina intermediate target region. (C) In Fas2 null mutant (i.e., Fas2EB112) eye-specific mosaic animals, gaps (arrows) at the lamina target region were frequently observed. (D) In Fas2 eye-specific knockdown animals, similar disruption at the lamina target region was observed. The arrows indicate gaps at the lamina termination layer. la, lamina; me, medulla. (Scale bar, 20 μm.)
To further investigate the functional relationship between Sema1a and Fas2, we examined if loss of sema1a affects the level of Fas2 in R-cell axons. Compared with that in wild type (SI Appendix, Fig. S5)—although there was a decrease in Fas2 level in R7/R8 terminals in sema1a mutants—no such change was observed in R1–R6 terminals in sema1a mutants (SI Appendix, Fig. S5). Interestingly, although overexpression of Fas2 in wild type caused a hyper-fasciculation phenotype similar to that of Sema1a overexpression, no hyper-fasciculation phenotype was observed when Fas2 was overexpressed in sema1a mutants (SI Appendix, Fig. S6). Moreover, many sema1a mutants in which Fas2 was overexpressed still displayed defects similar to those in sema1a mutants (∼72.2%, n = 18). These results, together with the fact that Sema1a promotes Fas2-mediated cell–cell adhesion in S2 cells (Fig. 2), suggest a role for Sema1a in upregulating the adhesive activity and/or stability of Fas2.
Sema1a Downregulates the Level of Active Rho1 in R-Cell Axons.
To elucidate the signaling events underlying upregulation of Fas2 by Sema1a, we tested candidate intracellular signaling proteins for a potential role in the Sema1a reverse-signaling pathway. Among them, Rho1 is a particularly attractive candidate. In our previous study (8), we presented genetic evidence supporting that Sema1a reverse signaling negatively regulates Rho1 in controlling R-cell axonal projections. To gain mechanistic insights into negative regulation of Rho1 by Sema1a reverse signaling, we examined the effects of manipulating the level of Sema1a on the activation of Rho1 in R-cell axons in the developing Drosophila visual system.
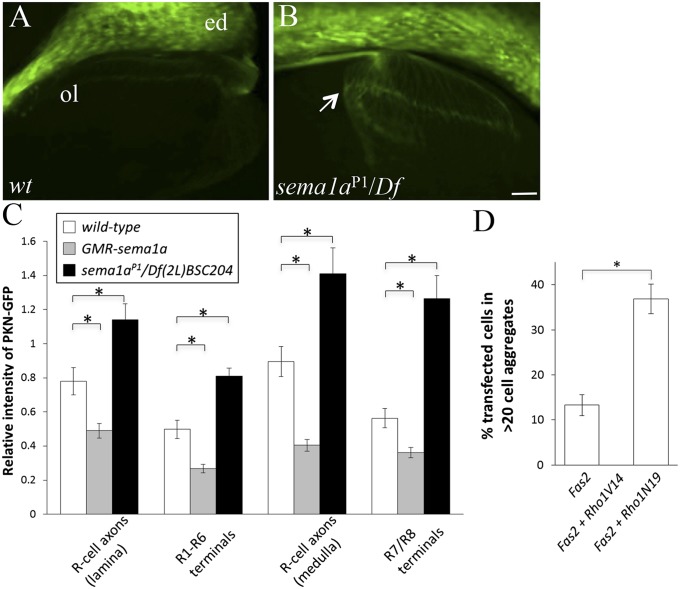
The distribution of active Rho1 was monitored with the Rho1 sensor PKNG58AeGFP (PKN-GFP). PKN-GFP binds to active Rho1 (i.e., GTP-bound form) and has been used to follow Rho1 activation (10). The relative level of active Rho1 (i.e., axon versus R-cell bodies in the eye disk) was measured. Loss of sema1a led to a significant increase in the level of active Rho1 in R-cell axons (Fig. 4 B and C). Conversely, overexpression of Sema1a decreased the level of active Rho1 in R-cell axons (Fig. 4C). These results indicate that Sema1a downregulates the level of active Rho1 in R-cell axons.
Fig. 4.
Sema1a downregulates the level of active Rho1 in R-cell axons. (A–C) PKN-GFP was used to visualize and quantify the level of active Rho1 in R cells. (A) The distribution of PKN-GFP in wild-type third-instar eye–brain complexes. (B) In sema1aP1/Df(2L)BSC204 mutants, the level of PKN-GFP in R-cell axons was increased significantly. Arrow indicates R-cell axons. (C) The relative level of active Rho1 was quantified. The relative intensity of PKN-GFP at different segments of R-cell axons was calculated by measuring the ratio of PKN-GFP intensity in R-cell axonal segments versus that in R-cell bodies in the same eye disk. *P < 0.01. (D) The effects of manipulating the activity of Rho1 on Fas2-induced cell–cell aggregation were examined. The percentage of Fas2-positive cells that formed large cell aggregates were quantified. The bar for cells coexpressing Fas2 and Rho1V14 did not show up as no large cell aggregates (>20 cells) were observed. By contrast, expression of Rho1N19 greatly enhanced Fas2-mediated cell aggregation (*P = 0.0028). ed, eye disk; ol, optic lobe. (Scale bar, 20 μm.) Error bars: SEM.
Rho1 Inhibits Fas2-Mediated Cell–Cell Adhesion.
To test if Rho1 plays a role in regulating the function of Fas2, we examined the effects of manipulating the activity of Rho1 on Fas2-mediated cell–cell adhesion. The activity of Rho1 in cultured cells was manipulated by expressing constitutively active (i.e., Rho1V14) or dominant-negative (i.e., Rho1N19) forms of Rho1. Although increasing Rho1 activity by expressing the constitutively active Rho1V14 abolished Fas2-mediated cell–cell aggregation (Fig. 4D), downregulating Rho1 activity with Rho1N19 significantly enhanced Fas2-mediated cell adhesion (Fig. 4D).
Rho1 Activation Decreases the Surface Level of Fas2.
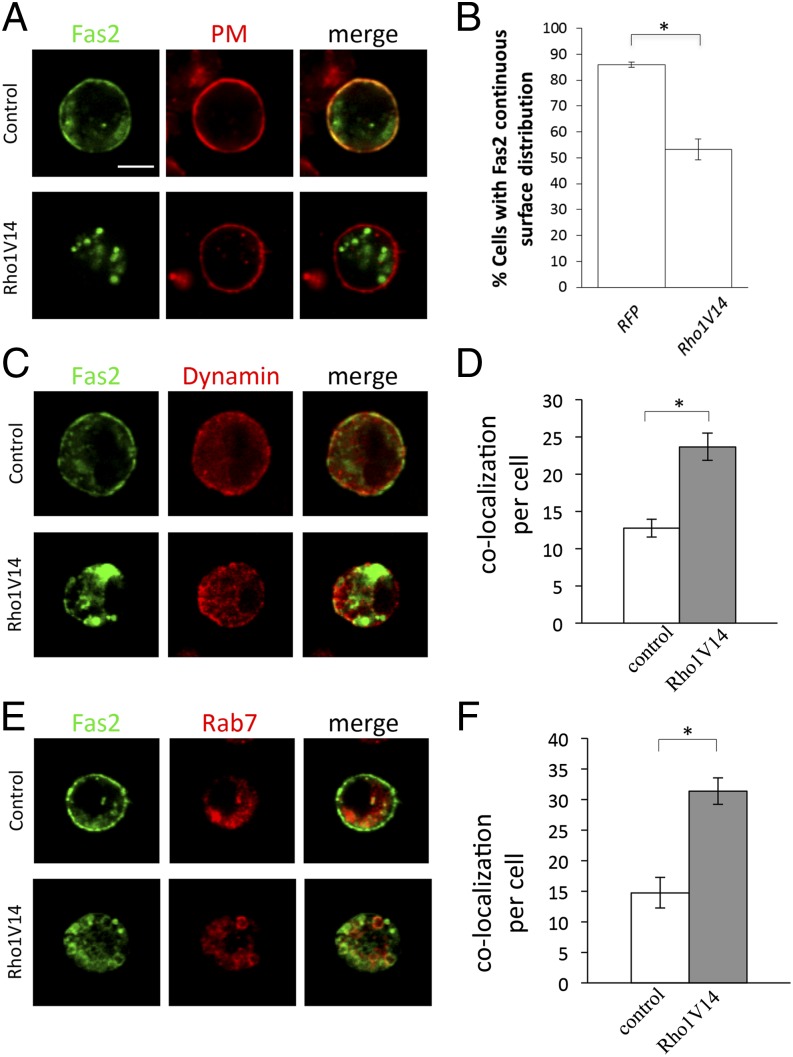
To determine the mechanisms by which Rho1 inhibits Fas2, we examined the effects of Rho1 on the distribution pattern of Fas2. In S2 cells transfected with Fas2-YFP alone (Fig. 5 A and B), Fas2 showed continuous cell-surface staining. In S2 cells expressing both Fas2-YFP and Rho1V14 (Fig. 5 A and B), however, the surface presence of Fas2 was significantly reduced. Many cells displayed discontinuous surface distribution of Fas2, coincident with the appearance of vesicle-like particles within the cytoplasm. We also tested the effects of Rho1 activation on several other cell-surface receptors, but did not observe a similar decrease in their surface levels (SI Appendix, Fig. S7). These results indicate that Rho1 negatively regulates Fas2-mediated cell–cell adhesion by decreasing the surface level of Fas2.
Fig. 5.
Rho1 downregulates the surface level of Fas2 in cultured cells. (A) S2 cells expressing Fas2-YFP (Upper) or both Fas2-YFP and Rho1V14 (Lower) were labeled with CellMask Plasma Membrane Stains (Life Technologies) to visualize plasma membrane (PM). Cells expressing Fas2-YFP displayed continuous cell-surface distribution of Fas2. However, many cells coexpressing Fas2-YFP and Rho1V14 showed disruptions in surface distribution of Fas2, which was coincidentally with an increase in the intracellular presence of Fas2. (B) The percentage of cells showing continuous surface distribution of Fas2 was quantified. *P = 0.0013. (C) S2 cells expressing Fas2-YFP (Upper) or both Fas2-YFP and Rho1V14 (Lower) were stained with anti-Dynamin antibody (red). Compared with that in control cells (Upper) (n = 15), the number of vesicles positive for both Fas2 (green) and Dynamin (red) were significantly increased in Rho1V14-expressing cells (n = 18). (D) The number of vesicles that were colabeled by anti-Dynamin and YFP in each cell was quantified. *P = 3.71E-05. (E) S2 cells expressing Fas2-YFP and Rab7-HA (Upper) or Fas2-YFP, Rab7-HA, and Rho1V14 (Lower) were colabeled with YFP fluorescence (green) and anti-HA (red). Compared with that in control cells (Upper) (n = 15), the number of vesicles positive for both Fas2-YFP and Rab7-HA was significantly increased in Rho1V14-expressing cells (n = 14). (F) The number of vesicles that were colabeled by Fas2-YFP and Rab7-HA in each cell was quantified. *P = 3.02E-05. (Scale bar, 5 μm.) Error bars: SEM.
To determine the mechanisms by which Rho1 activation leads to a decrease in the surface level of Fas2, we examined the effects of Rho1 activation on intracellular trafficking of Fas2. Expression of Rho1V14 significantly increased the localization of Fas2 to intracellular vesicles positive for Drosophila Dynamin (i.e., Shibire) (Fig. 5 C and D), a key component of the endocytic pathway (11). By contrast, no increase was observed in colocalization of Fas2 with Rab11 (SI Appendix, Fig. S8), a key player in the recycling endosome pathway (12). Expression of Rho1V14 also significantly increased the colocalization of Fas2 with vesicles positive for Rab7 (Fig. 5 E and F), which plays an important role in regulating late endosome/lysosome trafficking (12). These results suggest that Rho1 activation decreases the surface level of Fas2 by promoting intracellular trafficking and degradation of Fas2.
Sema1a Interacts Physically and Genetically with Moe.
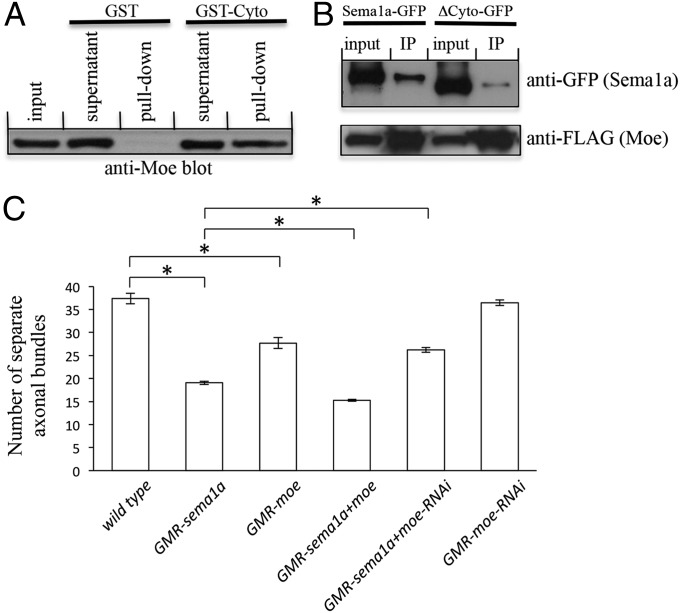
To determine the mechanisms by which Sema1a regulates the level of active Rho1, we tested the potential interaction between Sema1a and Moe, a member of the ERM family of proteins that was reported to be a negative regulator of Rho1 in Drosophila epithelial morphogenesis (13). A Glutathione-S (GST) fusion protein containing the cytoplasmic domain of Sema1a (GST-Cyto) was used in GST pull-down experiments. GST-Cyto, but not GST, precipitated Moe from fly lysates (Fig. 6A). This result suggests that Sema1a binds to Moe. To further address this, we performed coimmunoprecipitation. We found that Sema1a-GFP could coprecipitate with Moe-FLAG in transfected S2 cells (Fig. 6B). Coprecipitation was substantially reduced when a portion of the cytoplasmic domain of Sema1a was deleted (Fig. 6B). These results suggest that Sema1a associates with Moe to promote axon–axon interactions in the developing Drosophila visual system.
Fig. 6.
Sema1a interacts physically and genetically with Moe. (A) Western blot analysis of precipitates pulled down from lysates of flies expressing Moe-Myc by GST or GST fusion protein containing the cytoplasmic domain of Sema1a (i.e., GST-Cyto). Moe was detected in GST-Cyto precipitates, but not in GST precipitates. (B) Anti-FLAG antibody was used to precipitate Moe-FLAG from S2 cells coexpressing Moe-FLAG and Sema1a-GFP or Moe-FLAG and ΔCyto-GFP (Sema1a mutant lacking a portion of the cytoplasmic domain). (Upper) The blot was probed with anti-GFP antibody. (Lower) The same blot was stripped and reprobed with anti-FLAG antibody. (C) The effects of manipulating the level of Moe on the Sema1a-overexpression–induced hyper-fasciculation phenotype were quantified. Third-instar larvae with comparable eye-disk size (more than 10 rows of differentiating R-cell clusters) were examined, and the number of separate axonal bundles that are located between lamina and medulla was counted. The Sema1a-overexpression–induced hyper-fasciculation phenotype was enhanced by overexpression of Moe and suppressed by knockdown of Moe. *P < 0.001. Error bars: SEM.
To determine the in vivo relevance of the association of Sema1a with Moe, we examined potential genetic interactions between Sema1a and Moe in R-cell axonal projections. We found that the knockdown the level of Moe significantly suppressed the hyper-fasciculation phenotype induced by Sema1a overexpression (Fig. 6C and SI Appendix, Fig. S9), whereas overexpression of Moe enhanced the Sema1a overexpression phenotype (Fig. 6C and SI Appendix, Fig. S9). We also found that reducing the level of Fas2 suppressed the hyper-fasciculation phenotype induced by expressing a constitutively active form of Moe (i.e., MoeT559D) (SI Appendix, Fig. S10) or a dominant-negative form of Rho1 (i.e., Rho1N19) (SI Appendix, Fig. S10).
Sema1a Is Required for the Phosphorylation and Activation of Moe in R-Cell Axons.
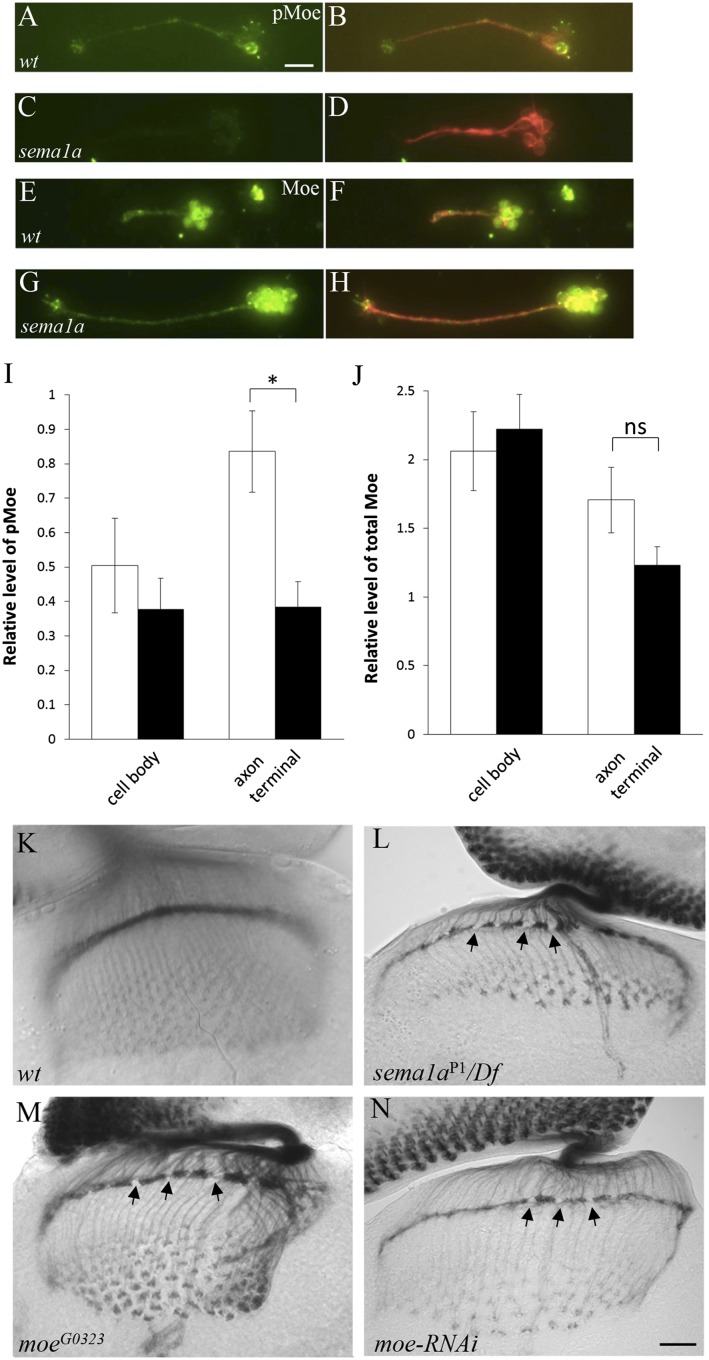
To further determine the functional relationship between Sema1a and Moe, we examined the effects of manipulating the level of Sema1a on the level and activation of Moe in R-cell axons in the developing Drosophila visual system. Because Moe is expressed in all cell types in the developing visual system, the presence of Moe in individual R-cell bodies and axons could not be unequivocally identified (SI Appendix, Fig. S11C). To circumvent this problem, we performed immunostaining of dissociated R cells from third-instar larval eye discs (SI Appendix, Fig. S11D). The expression level of total Moe was examined with a rabbit anti-Moe antibody (14), whereas the level of active Moe (i.e., pMoe) that is phosphorylated on Thr556 was examined with a rabbit anti-pMoe antibody (15) (SI Appendix, Fig. S12). The relative level of total Moe and pMoe in R-cell bodies and axons was quantified. Loss of sema1a did not affect the relative level of total Moe in R-cell bodies and axons (Fig. 7 G, H, and J), indicating that Sema1a reverse signaling is not required for transcription or translation of Moe. The relative level of phosphorylated Moe, however, was decreased substantially in the absence of Sema1a (Fig. 7 C, D, and I). We also found that Moe is involved in downregulating the level of active Rho1 in dissociated R-cell axonal terminals (SI Appendix, Fig. S13) and in R1–R6 terminals in the developing Drosophila visual system (SI Appendix, Fig. S14). These results indicate that Semala reverse signaling negatively regulates Rho1 by promoting the activation of Moe in R-cell axons.
Fig. 7.
Sema1a is required for the phosphorylation and activation of Moe in R-cell axons. (A–H) Dissociated R cells from third-instar eye discs were cultured. (A–D) The distribution of phosphorylated active Moe (pMoe) was visualized with anti-phosphorylated Moe antibody. (A) Phosphorylated Moe was detected in wild-type R-cell bodies and axons. (B) R cells in A were double-stained with R-cell–specific monoclonal antibody MAb 24B10. (C) In sema1aP1/Df(2L)BSC204 mutant R cells, the level of phosphorylated Moe in R-cell axonal terminals was significantly decreased. (D) R cells in C were double-stained with MAb 24B10. (E–H) The distribution of total Moe protein was visualized with anti-Moe antibody. (E) Moe was detected in wild-type R-cell bodies and axons. (F) R cells in E were double-stained with MAb 24B10. (G) In sema1aP1/Df(2L)BSC204 mutant R cells, the level of total Moe in R-cell axonal terminals was similar to that in wild type (E). (H) R cells in G were double-stained with MAb 24B10. (I) The relative level of phosphorylated Moe was quantified (n = 10). Loss of sema1a significantly decreased the level of phosphorylated Moe in R-cell axonal terminals (P = 0.0045). (J) The relative level of total Moe was quantified (n > 16). Loss of sema1a did not significantly affect the level of total Moe in R-cell axonal terminals (P > 0.05). ns, not significant. (K–N) R-cell axonal projection pattern was visualized with MAb 24B10 staining. (K) Wild type. (L) sema1aP1/Df(2L)BSC204 mutants. The arrows indicate gaps at the lamina termination layer. (M) moeG0323 mutants frequently displayed gaps (arrows) at the lamina termination layer, a phenotype similar to that in sema1a mutants (L). (N) Eye-specific knockdown of moe also caused the appearance of gaps (arrows) at the lamina termination layer. (Scale bar: A–H, 10 μm; K–N, 20 μm.) Error bars: SEM.
Loss of moe also Disrupts the Association of R-Cell Axons.
To determine if Moe is required for R-cell axon–axon association, we performed loss-of-function analysis. The level of both phosphorylated Moe and total Moe protein was significantly reduced in moeG0323 mutants and moe knockdown flies (SI Appendix, Figs. S11 and S12). Similar to that in sema1a mutants (Fig. 7L), the close association of R-cell axons at the lamina termination layer was disrupted in moeG0323 mutants (∼66.7%, n = 21; Fig. 7M), and larvae in which the level of Moe was knocked down by eye-specific expression of a UAS-moe-RNAi transgene (∼50%, n = 22; Fig. 7N). Together, these results support a role for Moe in the Sema1a reverse-signaling pathway in regulating R-cell axon–axon interactions.
Discussion
Our previous studies establish a key role for Sema1a reverse signaling in promoting R-cell axon–axon association at the intermediate target region in the developing visual system (3, 8). In this study, we reveal a novel mechanism underlying modulation of axon-surface affinity by Sema1a reverse signaling. Our results implicate the homophilic cell adhesion molecule Fas2 as a downstream target of Sema1a reverse signaling. We show that the Sema1a-induced axonal hyper-fasciculation phenotype is suppressed by reducing the level of Fas2. Loss of Fas2 disrupts the association of R-cell axons in the lamina, a phenotype similar to that in sema1a mutants. Consistently, we found that expression of Sema1a, but not of the Semala mutant lacking the cytoplasmic domain, enhances Fas2-mediated cell–cell adhesion in vitro. We propose that upregulation of Fas2-mediated axon–axon attraction by Sema1a reverse signaling is a key step in organizing R-cell axons at their intermediate target region before establishing synaptic connections with their final target neurons in the optic lobe.
Our results revealing the regulation of Fas2 by Sema1a reverse signaling shed new light on the mechanisms controlling axon–axon interactions in circuit development. Fas2 and its mammalian ortholog NCAM have been implicated in a variety of processes in neural development and function, such as axon guidance, synaptic development, and plasticity (16). The function of Fas2/NCAM is tightly controlled to ensure proper development of the nervous system. For example, the expression of Fas2 is negatively regulated by the transcriptional factor Adf-1 in regulating dendrite development (17). In mammals, it is reported that removal of the polysialic-acid moiety of NCAM plays an important role in upregulating NCAM-mediated neurite–neurite adhesion during development (18).
We favor the model in which PlexA-Sema1a reverse signaling upregulates the function of Fas2 in mediating axon–axon association for circuit development in the visual system for the following reasons. First, PlexA, Sema1a, and Fas2 are expressed and genetically required in R-cell axons (3, 8) (Fig. 3 and SI Appendix, Fig. S4). Second, overexpression of PlexA, Sema1a, or Fas2 causes similar hyper-fasciculation of R-cell axons (3, 8) (SI Appendix, Fig. S6). And third, loss of PlexA, Sema1a, or Fas2 causes dispersed distribution of R-cell axonal terminals and frequent appearance of gaps in the target region (8) (SI Appendix, Fig. S4). However, our current data cannot completely exclude an additional role of Sema1a in target recognition. It remains possible that, in addition to promoting Fas2-mediated R-cell axon–axon attraction, Sema1a reverse signaling also regulates interactions between R-cell axons and their target regions for visual circuit assembly.
The Rho-family small GTPase Rho1 appears to be a key target of Sema1a reverse signaling in regulating the function of Fas2. Our previous study from genetic analysis suggests a role for Sema1a in negatively regulating the function of Rho1 in the developing Drosophila visual system (8). In the present study, we show that Sema1a decreases the level of active Rho1. Moreover, Fas2-mediated cell–cell adhesion is enhanced by reducing the activity of Rho1 and inhibited by increasing the activity of Rho1. Together, these results establish a key role for negative regulation of Rho1 by Sema1a reverse signaling in upregulating Fas2.
That Rho1 promotes intracellular trafficking and degradation of Fas2 in cultured cells suggests that upregulation of Fas2 surface level by Sema1a-mediated inhibition of Rho1 is a possible mechanism for promoting Fas2-mediated axon–axon attraction. However, no obvious change in Fas2 level in R1–R6 terminals was detected in sema1a mutants. One possible explanation for this discrepancy is that, due to technical limitation, we could measure only the level of total Fas2, but not surface Fas2, in R-cell axonal terminals. Another possibility is that upregulation of Fas2 is transient, which makes it difficult to detect a change in Fas2 expression level when Sema1a is manipulated. It also remains possible that inhibition of Rho1 by Sema1a reverse signaling may increase both surface level and binding activity of Fas2. Future studies will be needed to address these possibilities.
In addition to the role of Rho1 in the Sema1a reverse-signaling pathway in the visual system, a recent study by Kolodkin and colleagues shows that Sema1a reverse signaling also regulates Rho1 in Drosophila motor axon guidance (6). The difference between photoreceptor and motor axons in the modulation of Rho1 by Sema1a reverse signaling may account for distinct effects on axon–axon interactions. Although negative regulation of Rho1 by Sema1a reverse signaling promotes axon–axon association in the visual system, Sema1a reverse signaling activates Rho1 in motor axons leading to axon–axon repulsion. One likely explanation is that Sema1a uses different downstream effectors to modulate Rho1 in different cell types. Whereas Moe is activated by Sema1a in photoreceptor axons, Pebble and RhoGAPp190 appear to link Sema1a reverse signaling with the modulation of Rho1 activity in motor axons (6). It remains unknown how Sema1a-induced changes in Rho1 activity modulate cell-surface adhesiveness leading to axon–axon repulsion in motor axon guidance.
Previous studies identify Moe as a negative regulator of Rho1 in epithelial morphogenesis (13). In this study, we provide several lines of evidence supporting that Sema1a negatively regulates the activity of Rho1 in R-cell axons by upregulating Moe. First, Moe interacts genetically with Sema1a in regulating R-cell axonal projections. Second, Sema1a associates with Moe and is required for the phosphorylation and activation of Moe in R-cell axons. And third, like Sema1a, Moe displays a similar effect on the level of active Rho1 in R-cell axons. The association of Moe with Sema1a may bring Moe in close proximity to its upstream kinase, thus facilitating the phosphorylation and activation of Moe. Thus, overexpression of Sema1a may allow the recruitment and activation of sufficient Moe protein in R-cell axons in a PlexA-independent manner, which upregulates the adhesive activity and/or stability of Fas2 by inhibiting Rho1. In addition to its interaction with Sema1a, Moe is recently reported to interact with the tumor necrosis factor receptor Wengen in regulating R8 photoreceptor axon targeting (19). Moe may be a common target of multiple receptors to regulate different processes in circuit development.
In conclusion, our present study supports a model in which Sema1a reverse signaling negatively regulates the activity of Rho1 and thus promotes Fas2-mediated axon–axon attraction in the Drosophila visual system. It will be of interest to determine if transmembrane Semaphorins in vertebrates also function similarly in regulating axon–axon interactions.
Materials and Methods
Genetics.
To overexpress Fas2 in R cells, UAS-Fas2-yfp flies (20) were crossed with GMR-GAL4 or GMR-GAL4, UAS-sema1a flies. To knock down the level of Fas2 in R cells, UAS-Fas2-RNAi (BDSC#34084) flies were crossed with GMR-GAL4 flies. Large clones (>50% of retina) of homozygous Fas2EB112 mutant tissues were generated in an otherwise heterozygous or wild-type eye by eye-specific mitotic recombination using the eyFLP/FRT system (21). To knock down the level of Moe in R cells, UAS-moe-RNAi flies (Bloomington Drosophila Stock Center #33936) were crossed with GMR-GAL4 flies. To overexpress Moe in R cells, UAS-moe-myc flies (22) were crossed with GMR-GAL4 or GMR-GAL4, UAS-sema1a flies. To express PKN-GFP in wild-type and sema1a-overexpression R cells, UAS-Pkn-gfp flies (10) were crossed with wild-type or GMR-GAL4, UAS-sema1a flies, respectively. To express PKN-GFP in sema1a mutant R cells, GMR-GAL4, sema1aP1/CyO; UAS-Pkn-gfp flies were crossed with Df(2L)BSC204/CyO-gfp.
Molecular Biology.
To generate UAS-Fas2-yfp, the DNA fragment containing the Fas2-yfp sequence was amplified from flies carrying the UAS-Fas2-yfp transgene (20) by PCR and subcloned into pCR2.1 vector. A NotI/KpnI fragment of the resulting plasmid was then subcloned into pUAST. To generate UAS-sema1a-rfp and UAS-sema1a-venus, the DNA sequence encoding Sema1a was amplified from UAS-sema1a by PCR and subcloned into pTWR and pTWV [Drosophila Genetic Resource Center (DGRC)] by using the gateway system (Invitrogen), respectively. To generate UAS-sema1a∆Cyto-venus and UAS-sema1a∆Cyto-flag, the DNA sequence encoding the entire sequence of extracellular and transmembrane domains and 16-amino-acid cytoplasmic sequence following the transmembrane region was amplified from the plasmid UAS-sema1a by PCR and subcloned into pTWV and pTWF (DGRC) by using the gateway system, respectively. To generate GST-Cyto, the sequence encoding the cytoplasmic domain of Sema1a was amplified from the plasmid UAS-sema1a by PCR and subcloned into the EcoRI/XhoI sites of pGEX-4T-1 vector. The UAS-Pkn-gfp plasmid was provided by António Jacinto (Universidade de Lisboa, Lisbon, Portugal) (10). To generate UAS-moe-flag, the DNA sequence encoding Moe was amplified from the plasmid DH0120 (provided by David R. Hipfner, Institut de Recherches Cliniques de Montréal, Montréal) by PCR and subcloned into the pTWF vector by using the gateway system. To generate UAS-Rho1N19 and UAS-Rho1V14, the sequence was amplified from flies carrying UAS-Rho1.N19 and UAS-Rho1.V14 transgenes by PCR, respectively. The resulting fragment was then subcloned into the EcoRI/XhoI sites of pUAST vector.
Immunostaining.
Dissection and immunostaining of the eye–brain complexes from third-instar larvae were performed as described previously (23). Antibodies were used at the following dilutions: MAb24B10 [1:100; Developmental Studies Hybridoma Bank (DSHB)], mouse anti-Fas2 1D4 (1:100; DSHB), rabbit anti-Moe (1:20,000; provided by D. Hipfner), rabbit anti-pMoe (1:200; Cell Signaling Technology), mouse anti-Dynamin (1:500; BD Biosciences), and rat anti-HA (1:3,000; Roche). Cultured S2 cells were labeled with CellMask Deep Red Plasma Membrane Stains (1:2,000; Life Technologies) for 7 min to visualize plasma membrane. Dissociated R cells from third-instar larval eye discs were cultured and stained with antibodies similarly as described previously (24).
Cell–Cell Aggregation Assays.
Drosophila S2 cells were cultured in EX-CELL 420 serum-free medium (Sigma-Aldrich) at 25 °C. Cell transfection and aggregation assays were performed similarly as described previously (25).
Biochemistry.
Information about purification of GST and GST-Sema1aCyto fusion proteins, pull-down, and coimmunoprecipitation assays is described in SI Appendix.
Statistical Analysis.
Student t test was used for statistical analysis. The difference is considered as significant when a P value is <0.05.
Supplementary Material
Acknowledgments
We thank people in the Y.R. laboratory for comments and suggestions. We also thank Dr. P. Barker, Dr. H. Bellen, Dr. D. Hipfner, Dr. A. Jacinto, Dr. A. Nose, Dr. D. Ready, Dr. F. Shoeck, and Dr. S. Simões for reagents and fly stocks and the Bloomington Stock Center, the Drosophila Genomics Resource Center, and the Transgenic RNAi Project at Harvard Medical School (National Institutes of Health/National Institute of General Medical Sciences R01-GM084947). This work was supported by an operating grant (MOP-14688) from Canadian Institutes of Health Research (to Y.R.) and by a McGill University Health Centre studentship (to H.-H.H.).
Footnotes
The authors declare no conflict of interest.
This article is a PNAS Direct Submission. A.L.K. is a guest editor invited by the Editorial Board.
This article contains supporting information online at www.pnas.org/lookup/suppl/doi:10.1073/pnas.1321433111/-/DCSupplemental.
References
- 1.Yazdani U, Terman JR. The semaphorins. Genome Biol. 2006;7(3):211. doi: 10.1186/gb-2006-7-3-211. [DOI] [PMC free article] [PubMed] [Google Scholar]
- 2.Mann F, Chauvet S, Rougon G. Semaphorins in development and adult brain: Implication for neurological diseases. Prog Neurobiol. 2007;82(2):57–79. doi: 10.1016/j.pneurobio.2007.02.011. [DOI] [PubMed] [Google Scholar]
- 3.Cafferty P, Yu L, Long H, Rao Y. Semaphorin-1a functions as a guidance receptor in the Drosophila visual system. J Neurosci. 2006;26(15):3999–4003. doi: 10.1523/JNEUROSCI.3845-05.2006. [DOI] [PMC free article] [PubMed] [Google Scholar]
- 4.Komiyama T, Sweeney LB, Schuldiner O, Garcia KC, Luo L. Graded expression of semaphorin-1a cell-autonomously directs dendritic targeting of olfactory projection neurons. Cell. 2007;128(2):399–410. doi: 10.1016/j.cell.2006.12.028. [DOI] [PubMed] [Google Scholar]
- 5.Godenschwege TA, Hu H, Shan-Crofts X, Goodman CS, Murphey RK. Bi-directional signaling by Semaphorin 1a during central synapse formation in Drosophila. Nat Neurosci. 2002;5(12):1294–1301. doi: 10.1038/nn976. [DOI] [PubMed] [Google Scholar]
- 6.Jeong S, Juhaszova K, Kolodkin AL. The control of semaphorin-1a-mediated reverse signaling by opposing pebble and RhoGAPp190 functions in Drosophila. Neuron. 2012;76(4):721–734. doi: 10.1016/j.neuron.2012.09.018. [DOI] [PMC free article] [PubMed] [Google Scholar]
- 7.Toyofuku T, et al. Guidance of myocardial patterning in cardiac development by Sema6D reverse signalling. Nat Cell Biol. 2004;6(12):1204–1211. doi: 10.1038/ncb1193. [DOI] [PubMed] [Google Scholar]
- 8.Yu L, Zhou Y, Cheng S, Rao Y. Plexin a-semaphorin-1a reverse signaling regulates photoreceptor axon guidance in Drosophila. J Neurosci. 2010;30(36):12151–12156. doi: 10.1523/JNEUROSCI.1494-10.2010. [DOI] [PMC free article] [PubMed] [Google Scholar]
- 9.Hadjieconomou D, Timofeev K, Salecker I. A step-by-step guide to visual circuit assembly in Drosophila. Curr Opin Neurobiol. 2011;21(1):76–84. doi: 10.1016/j.conb.2010.07.012. [DOI] [PubMed] [Google Scholar]
- 10.Simões S, et al. Compartmentalisation of Rho regulators directs cell invagination during tissue morphogenesis. Development. 2006;133(21):4257–4267. doi: 10.1242/dev.02588. [DOI] [PubMed] [Google Scholar]
- 11.Ferguson SM, De Camilli P. Dynamin, a membrane-remodelling GTPase. Nat Rev Mol Cell Biol. 2012;13(2):75–88. doi: 10.1038/nrm3266. [DOI] [PMC free article] [PubMed] [Google Scholar]
- 12.Pfeffer SR. Rab GTPase regulation of membrane identity. Curr Opin Cell Biol. 2013;25(4):414–419. doi: 10.1016/j.ceb.2013.04.002. [DOI] [PMC free article] [PubMed] [Google Scholar]
- 13.Speck O, Hughes SC, Noren NK, Kulikauskas RM, Fehon RG. Moesin functions antagonistically to the Rho pathway to maintain epithelial integrity. Nature. 2003;421(6918):83–87. doi: 10.1038/nature01295. [DOI] [PubMed] [Google Scholar]
- 14.Hipfner DR, Keller N, Cohen SM. Slik Sterile-20 kinase regulates Moesin activity to promote epithelial integrity during tissue growth. Genes Dev. 2004;18(18):2243–2248. doi: 10.1101/gad.303304. [DOI] [PMC free article] [PubMed] [Google Scholar]
- 15.Kunda P, Pelling AE, Liu T, Baum B. Moesin controls cortical rigidity, cell rounding, and spindle morphogenesis during mitosis. Curr Biol. 2008;18(2):91–101. doi: 10.1016/j.cub.2007.12.051. [DOI] [PubMed] [Google Scholar]
- 16.Hinsby AM, Berezin V, Bock E. Molecular mechanisms of NCAM function. Front Biosci. 2004;9:2227–2244. doi: 10.2741/1393. [DOI] [PubMed] [Google Scholar]
- 17.Timmerman C, et al. The Drosophila transcription factor Adf-1 (nalyot) regulates dendrite growth by controlling FasII and Staufen expression downstream of CaMKII and neural activity. J Neurosci. 2013;33(29):11916–11931. doi: 10.1523/JNEUROSCI.1760-13.2013. [DOI] [PMC free article] [PubMed] [Google Scholar]
- 18.Acheson A, Sunshine JL, Rutishauser U. NCAM polysialic acid can regulate both cell-cell and cell-substrate interactions. J Cell Biol. 1991;114(1):143–153. doi: 10.1083/jcb.114.1.143. [DOI] [PMC free article] [PubMed] [Google Scholar]
- 19.Ruan W, Unsain N, Desbarats J, Fon EA, Barker PA. Wengen, the sole tumour necrosis factor receptor in Drosophila, collaborates with moesin to control photoreceptor axon targeting during development. PLoS ONE. 2013;8(3):e60091. doi: 10.1371/journal.pone.0060091. [DOI] [PMC free article] [PubMed] [Google Scholar]
- 20.Kohsaka H, Takasu E, Nose A. In vivo induction of postsynaptic molecular assembly by the cell adhesion molecule Fasciclin2. J Cell Biol. 2007;179(6):1289–1300. doi: 10.1083/jcb.200705154. [DOI] [PMC free article] [PubMed] [Google Scholar]
- 21.Newsome TP, Asling B, Dickson BJ. Analysis of Drosophila photoreceptor axon guidance in eye-specific mosaics. Development. 2000;127(4):851–860. doi: 10.1242/dev.127.4.851. [DOI] [PubMed] [Google Scholar]
- 22.Karagiosis SA, Ready DF. Moesin contributes an essential structural role in Drosophila photoreceptor morphogenesis. Development. 2004;131(4):725–732. doi: 10.1242/dev.00976. [DOI] [PubMed] [Google Scholar]
- 23.Ruan W, Pang P, Rao Y. The SH2/SH3 adaptor protein dock interacts with the Ste20-like kinase misshapen in controlling growth cone motility. Neuron. 1999;24(3):595–605. doi: 10.1016/s0896-6273(00)81115-0. [DOI] [PubMed] [Google Scholar]
- 24.Li C, Meinertzhagen IA. Conditions for the primary culture of eye imaginal discs from Drosophila melanogaster. J Neurobiol. 1995;28(3):363–380. doi: 10.1002/neu.480280309. [DOI] [PubMed] [Google Scholar]
- 25.Cameron S, et al. Visual circuit assembly requires fine tuning of the novel Ig transmembrane protein Borderless. J Neurosci. 2013;33(44):17413–17421. doi: 10.1523/JNEUROSCI.1878-13.2013. [DOI] [PMC free article] [PubMed] [Google Scholar]


