Significance
Proteins function in a sea of macromolecules within cells, but are traditionally studied under ideal conditions in vitro. The more details we amass from experiments performed in cells, the closer we will get to understanding fundamental aspects of protein chemistry in the cellular environment. In addition to furthering our essential knowledge of biochemistry, advancements in the field of macromolecular crowding will drive efforts to stabilize protein-based therapeutics. Here, we show that protein stability can be measured at the residue level in living cells without adding destabilizing cosolutes or heat.
Keywords: protein thermodynamics, H/D exchange, macromolecular crowding, protein NMR
Abstract
The intracellular milieu differs from the dilute conditions in which most biophysical and biochemical studies are performed. This difference has led both experimentalists and theoreticians to tackle the challenging task of understanding how the intracellular environment affects the properties of biopolymers. Despite a growing number of in-cell studies, there is a lack of quantitative, residue-level information about equilibrium thermodynamic protein stability under nonperturbing conditions. We report the use of NMR-detected hydrogen–deuterium exchange of quenched cell lysates to measure individual opening free energies of the 56-aa B1 domain of protein G (GB1) in living Escherichia coli cells without adding destabilizing cosolutes or heat. Comparisons to dilute solution data (pH 7.6 and 37 °C) show that opening free energies increase by as much as 1.14 ± 0.05 kcal/mol in cells. Importantly, we also show that homogeneous protein crowders destabilize GB1, highlighting the challenge of recreating the cellular interior. We discuss our findings in terms of hard-core excluded volume effects, charge–charge GB1-crowder interactions, and other factors. The quenched lysate method identifies the residues most important for folding GB1 in cells, and should prove useful for quantifying the stability of other globular proteins in cells to gain a more complete understanding of the effects of the intracellular environment on protein chemistry.
Proteins function in a heterogeneous and crowded intracellular environment. Macromolecules comprise 20–30% of the volume of an Escherichia coli cell and reach concentrations of 300–400 g/L (1, 2). Theory predicts that the properties of proteins and nucleic acids can be significantly altered in cells compared with buffer alone (3, 4). Nevertheless, most biochemical and biophysical studies are conducted under dilute (<10 g/L macromolecules) conditions. Here, we augment the small but growing list of reports probing the equilibrium thermodynamic stability of proteins in living cells (5–9), and provide, to our knowledge, the first measurement of residue-level stability under nonperturbing conditions.
Until recently, the effects of macromolecular crowding on protein stability were thought to be caused solely by hard-core, steric repulsions arising from the impenetrability of matter (4, 10, 11). The expectation was that crowding enhances stability by favoring the compact native state over the ensemble of denatured states. Increased attention to transient, nonspecific protein-protein interactions (12–15) has led both experimentalists (16–19) and theoreticians (20–22) to recognize the effects of chemical interactions between crowder and test protein when assessing the net effect of macromolecular crowding. These weak, nonspecific interactions can reinforce or oppose the effect of hard-core repulsions, resulting in increased or decreased stability depending on the chemical nature of the test protein and crowder (23–26).
We chose the B1 domain of streptococcal protein G (GB1) (27) as our test protein because its structure, stability and folding kinetics have been extensively studied in dilute solution (28–38). Its small size (56 aa; 6.2 kDa) and high thermal stability make GB1 well suited for studies by NMR spectroscopy.
Quantifying the equilibrium thermodynamic stability of proteins relies on determining the relative populations of native and denatured states. Because the denatured state ensemble of a stable protein is sparsely populated under native conditions, stability is usually probed by adding heat or a cosolute to promote unfolding so that the concentration ratio of the two states can be determined (39). However, stability can be measured without these perturbations by exploiting the phenomenon of backbone amide H/D exchange (40) detected by NMR spectroscopy (41). The observed rate of amide proton (N–H) exchange, kobs, is related to equilibrium stability by considering a protein in which each N–H exists in an open (exposed, exchange-competent) state, or a closed (protected, exchange-incompetent) state (40, 42):
| [1] |
Each position opens and closes with rate constants, kop and kcl (where Kop = kop/kcl), and exchange from the open state occurs with intrinsic rate constant, kint. Values for kint are based on exchange data from unstructured peptides (43, 44). If the test protein is stable (i.e., kcl >> kop), the observed rate becomes:
| [2] |
Exchange occurs within two limits (42). At the EX1 limit, closing is rate determining, and kobs = kop. This limit is usually observed for less stable proteins and at basic pH (45). Most globular proteins undergo EX2 kinetics, where exchange from the open state is rate limiting (i.e., kcl >> kint), and kobs values can be converted to equilibrium opening free energies, (46):
| [3] |
| [4] |
where RT is the molar gas constant multiplied by the absolute temperature.
The backbone amides most strongly involved in H-bonded regions of secondary structure exchange only from the fully unfolded state, yielding a maximum value of (47–49). For these residues approximates the free energy of denaturation, , providing information on global stability. Lower amplitude fluctuations of the native state can give rise to partially unfolded forms (50), resulting in residues with values less than those of the global unfolders.
In summary, NMR-detected H/D exchange can measure equilibrium thermodynamic stability of a protein at the level of individual amino acid residues under nonperturbing conditions. Inomata et al. (51) used this technique to measure kobs values in human cells for four residues in ubiquitin, but experiments confirming the exchange mechanism were not reported and opening free energies were not quantified. Our results fill this void and provide quantitative residue-level protein stability measurements in living cells under nonperturbing conditions.
Results
In Cells.
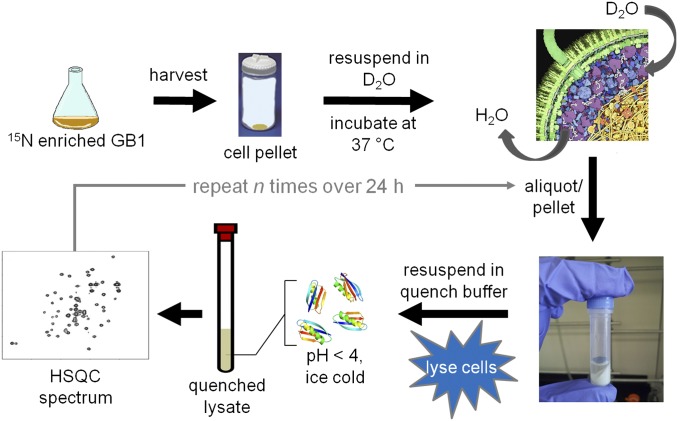
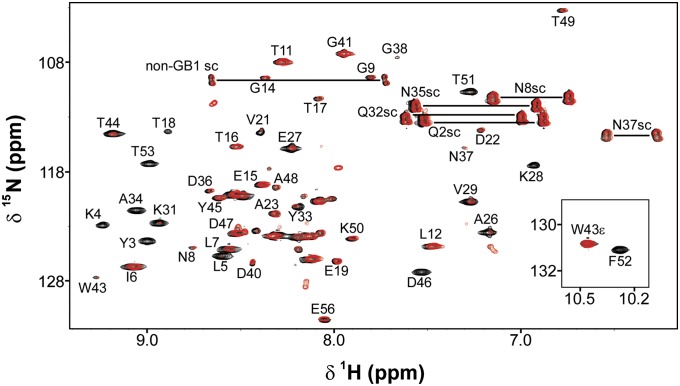
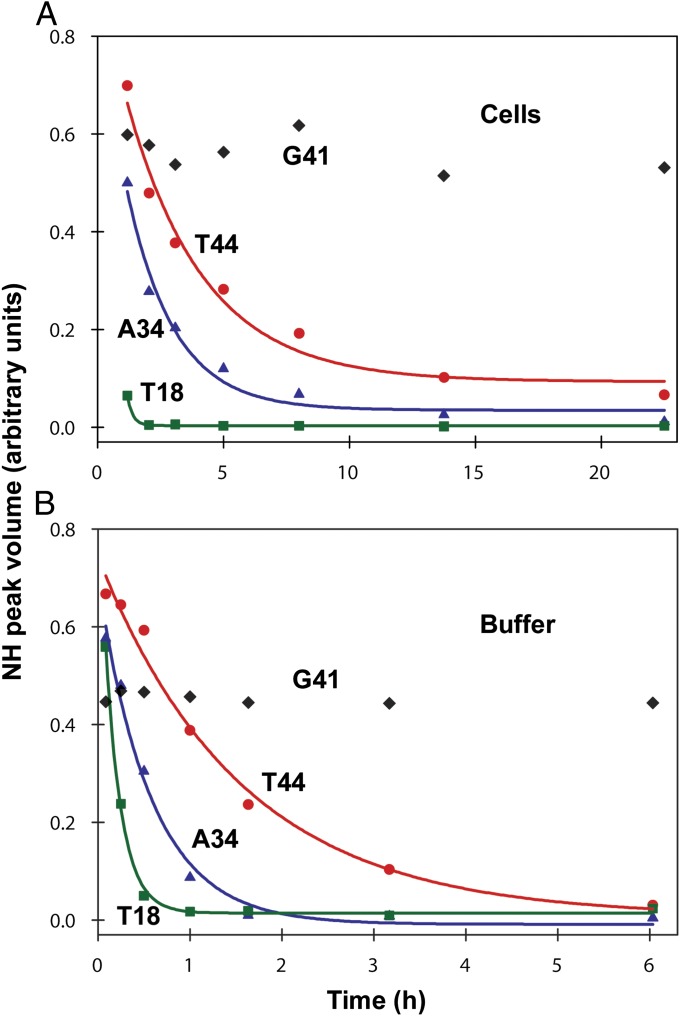
We attempted to measure GB1 stability directly in cells by pairing H/D exchange with in-cell NMR (52) and conventional serial 15N–1H heteronuclear single quantum coherence (HSQC) analysis (53), because GB1 is one of the few proteins that gives reasonable spectra in E. coli (13, 14, 54, 55). The signal-to-noise ratios of the spectra, however, were insufficient for quantification. We overcame this problem by modifying the approach of Ghaemmaghami and Oas (7) for measuring stability in discrete, quenched cell lysates (Fig. 1, Fig. S1, and SI Materials and Methods). Briefly, the cells are transferred and washed into D2O, where they remain viable (SI Materials and Methods). An aliquot of cell slurry is removed at defined times, the cells lysed, exchange quenched, and the lysate analyzed by NMR. The dead time is ∼1 h. Representative HSQC spectra of the initial and final lysates of WT GB1 illustrate the decrease in N–H cross-peak volume for 17 backbone amides due to exchange (Fig. 2). Profiles for representative residues are shown in Fig. 3. Values of kobs are tabulated in Table S1.
Fig. 1.
In-cell H/D exchange protocol. The cross-sectional illustration of an E. coli cell is used with permission from David S. Goodsell (Scripps Research Institute, La Jolla, CA).
Fig. 2.
Overlaid 15N–1H HSQC spectra with assignments [side chain (sc)] of the initial (black; 1-h exchange) and final (red; 22-h exchange) quenched lysates of an in-cell H/D exchange experiment on GB1. Assignments are based on published work (28).
Fig. 3.
Backbone amide H/D decay profiles with corresponding best fits for T44, A34, and T18 in (A) cells and in (B) buffer (PBS, pH 7.6, 37 °C). Data for G41 are included to illustrate quench labeling.
The decay of the T18 cross-peak illustrates the upper limit for measuring exchange. Quantification of kobs for T18 required a lower contour level and fitting to fewer times than the 17 more slowly exchanging residues. At contour levels lower than those shown in Fig. 2, resonances from six additional residues (K10, A20, A24, T25, Q32, and N35) are detectable in the spectrum from the initial time point, but decay is too rapid to obtain kobs. Rates for these residues are listed as >kobs,T18.
Cross-peaks from 24 backbone amides do not appear to exchange. We conclude that these residues are quench labeled, that is, they are least protected from solvent and, therefore, are labeled with protons immediately before quenching, when the proton concentration increases 104-fold. This conclusion arises from two considerations. First, the side chain amides, which are solvent exposed, behave similarly. Second, as discussed below, quench labeling is not observed in the serially acquired (i.e., no quench step) dilute solution data. Exchange rates for quench-labeled residues are also listed as >kobs,T18, even though their rates are probably even larger than those for the six residues described above. We attempted to assign the remaining residues, but the lysate was not stable enough for acquisition of 3D NMR data.
In summary, 48 of the 56 residues provide information on exchange. For the 17 slowly exchanging residues, kobs values were converted to free energies of opening, , by using Eq. 4 (Fig. S2 and Table S2). The value for T18 was not included because its rate in cells was obtained from limited data. Elevated rates of intrinsic exchange (10–100 s−1) under our conditions (pHcorr 7.6, 37 °C) prevented quantification of 30 residues. Based on our results for T18, we conclude that the kobs values for these 30 residues are >7 × 10⁻⁴ s−1 in cells and >3 × 10⁻⁴ s−1 in buffer (see In Dilute Solution).
In Dilute Solution.
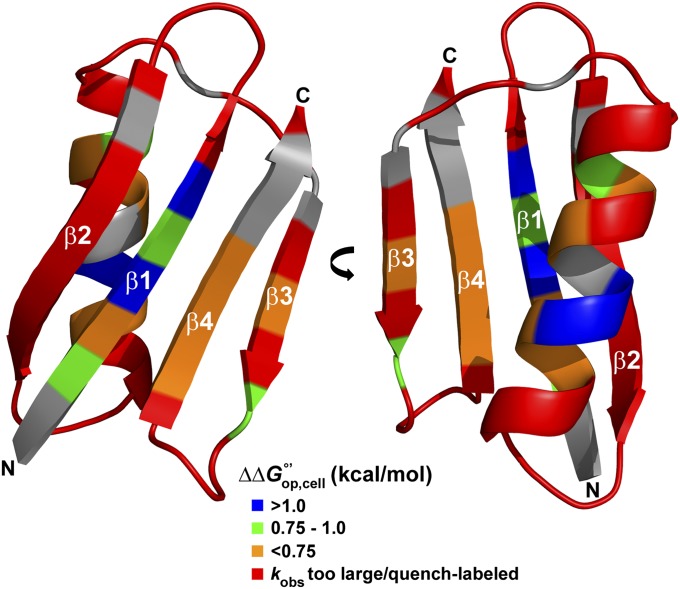
To compare the in-cell rates to those acquired in dilute solution (pHcorr 7.6, 37 °C), we mimicked the discrete sampling method (Fig. 1) using purified GB1 instead of the GB1-containing lysate (SI Materials and Methods). The exchange behavior is similar under both conditions; i.e., the same residues exchange slowly, the same residues exchange too rapidly to quantify, and the same quench labeling is observed. However, quantifying the exchange of T18 was possible because the dead time is <5 min, compared with ∼1 h for the in-cell studies (Fig. 3). Similar to the in-cell data, T18 is the fastest exchanging quantifiable residue. The kobs values are tabulated in Table S1, and the concomitant values were used to calculate the changes in stability (Figs. 4 and 5 and Table S2) caused by crowding in cells .
Fig. 4.
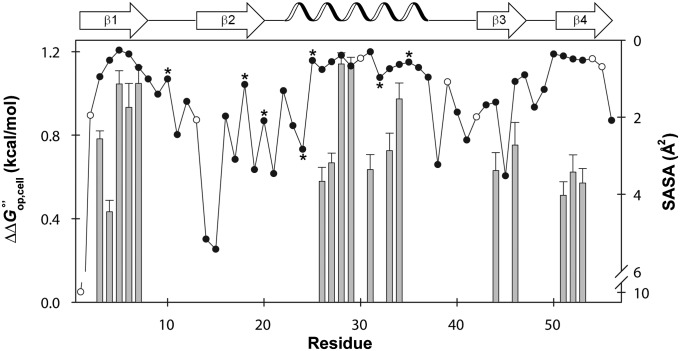
(; left y axis, gray bars) values for WT GB1 residues that give quantifiable decay rates in cells and in buffer (pH 7.6, 37 °C) and (right y axis) the SASA for each backbone amide (scatter plot). Error bars represent the SD of the mean. Quench-labeled residues are indicated by filled circles without values. Residues that decay too rapidly for accurate measurement are labeled with an asterisk. Unassigned residues are shown as open circles. The SASA for each backbone nitrogen atom was computed using the Parameter Optimised Surfaces program (73) and Protein Data Bank ID code 1PGB (32).
Fig. 5.
GB1 (1PGB) is stabilized in cells. Residues are colored by the magnitude of . Gray residues are unassigned.
To validate the discrete dilute solution protocol, conventional H/D exchange experiments (53) involving serially acquired spectra of a single lyophilized sample were performed in buffer (SI Materials and Methods). The values from discrete and serial acquisitions are the same within the uncertainty (Fig. S2 and Table S3). Thus, the serial method was used for subsequent in vitro studies. These data also show that lyophilization of GB1 does not affect our results. In addition, the 24 residues that do not appear to exchange in the discrete, quenched measurements are completely exchanged by the initial time point in the serial measurements, consistent with our conclusion about quench labeling.
In Vitro Crowding.
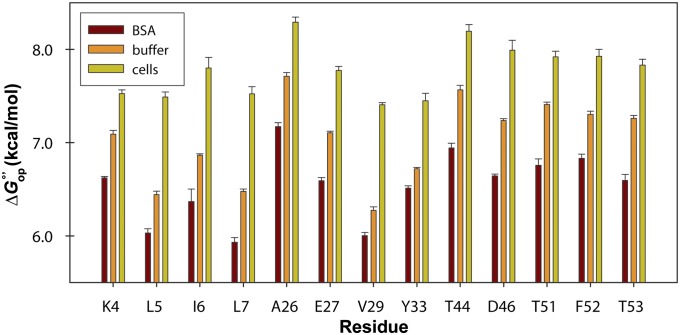
To assess the effect of individual protein crowders (24, 56) on GB1 stability, we acquired exchange data in 100 g/L solutions of either BSA or lysozyme (SI Materials and Methods). Of the 17 common GB1 residues quantified in cells and in buffer, 13 yielded measurable rates in BSA; the others exchanged too quickly (Table S4). The corresponding opening free energies, , were compared with those obtained in buffer and in cells (Fig. 6). BSA destabilizes GB1 compared with dilute solution, whereas the protein is stabilized in cells. In lysozyme, exchange rates are so large that the backbone N–H signals have completely decayed by the first acquisition (∼20 min). We conclude that lysozyme destabilizes GB1 by >1 kcal/mol compared with buffer alone.
Fig. 6.
values for WT GB1 residues in 100 g/L BSA, buffer, and cells. Error bars represent the SD of the mean from three trials.
I6L Variant.
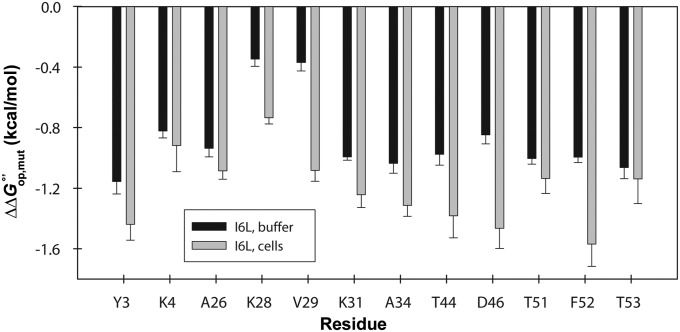
Recently, we used a thermodynamic cycle comprising kobs measurements of residues in chymotrypsin inhibitor 2 and a variant, in buffer and in reconstituted cytosol, to confirm the EX2 mechanism (26). We repeated this strategy with the destabilized GB1 variant, I6L (57). Comparisons of values were possible for 12 residues (Tables S5–S7). We made three comparisons. First, we calculated the change in residue-level stability of the variant in cells compared with buffer . Second, we calculated the change caused by the mutation in cells. Third, we calculated the effect of the mutation in dilute solution (Fig. 7 and Fig. S3). We use these data to assess the thermodynamic cycle in the Discussion.
Fig. 7.
() caused by the I6L mutation in cells and in buffer. Error bars represent the SD of the mean from three trials.
Calorimetry.
We used differential scanning calorimetry to quantify the free energy of denaturation, (SI Materials and Methods). Due to the high thermal stability of the WT protein (Tm = 79.0 °C at pHcorr 7.6), it is difficult to obtain adequate posttransitional baselines for robust fitting while maintaining reversibility (58). To solve this problem, we used the calorimetric enthalpy, , of the destabilized I6L variant and the Tm values of the two proteins to calculate with the equation, (Tm,I6L − Tm,WT)/Tm,I6L (59). The value of (−0.68 ± 0.06 kcal/mol) is consistent with the average (−0.8 ± 0.1 kcal/mol) from dilute solution H/D exchange experiments.
Discussion
We obtained, in triplicate, backbone amide exchange rates in cells and buffer for 18 residues distributed throughout GB1: Y3, K4, L5, I6 and L7 in β1; T18 in β2; A26, E27, K28, V29, K31, Y33 and A34 in the α-helix; T44 and D46 in β3; and T51, F52 and T53 in β4. The set includes 14 (in bold) of the 16 residues suggested to exchange via global unfolding (i.e., ) in dilute solution (33) (the other two, F30 and V54, are unassigned). We obtained kobs values under all four conditions (WT protein and I6L variant in buffer and in cells) for the 12 underlined residues.
To interpret the effect of the intracellular environment, we must first determine the meaning of the opening free energies. If they arise from globally exchanging residues, then we expect constant values of and across the primary structure (Fig. 4 and Fig. S2). Although there is deviation, the range is <1 kcal/mol. For this reason we remain cautious about overinterpreting these deviations because data from 20 proteins (60) show that global unfolders yield values within 1 kcal/mol of obtained from thermal or cosolute denaturation. In addition, if some residues exchange by local unfolding and others by global unfolding we might expect a correlation between and , but this is not the case. In summary, we believe these residues exchange through global unfolding or high-energy fluctuations that are energetically indistinguishable from global unfolding under physiological conditions. With this caveat in mind, we suggest two additional sources of deviation. First, although most evidence points to equilibrium two-state folding of GB1 (36–38), there is evidence of complex kinetic pathways, so we cannot rule out the possibility that intermediates may be populated at equilibrium in cells or in buffer. Second, despite our knowledge that kint values do not change under crowded conditions (61), deviations could arise because intrinsic rates are derived from model peptides, not the specific primary structure of GB1.
Exchange in Buffer.
As stated in the Introduction, to convert kobs values to values, the test protein must be stable (i.e., kcl >> kop) and kint must be rate determining (the EX2 limit). GB1 is highly stable in dilute solution (28, 29), and intrinsic exchange rates in buffer are known (43, 44). Proof that intrinsic exchange is rate determining for GB1 in buffer comes from two sources. First, stopped-flow measurements provide a lower limit of ∼103 s−1 for kcl (30), whereas kint values are <102 s−1. In addition, H/D measurements at two pH values can be used to assess the exchange mechanism, because intrinsic exchange is base catalyzed above pH 4 (62). Specifically, if kint is rate determining, changing the pH by one unit should change kobs by a factor of 10. Consistent with this idea, a plot of log kobs versus log kobs for GB1 residues in buffer at pH 7.6 and 6.7 (Fig. S4) has a slope of 0.9 ± 0.1 and an intercept (−1.1 ± 0.3) equal to the difference in pH. Lastly, because our exchange experiments yield data for residues involved in global unfolding, the values should approximate from calorimetry. This approximation holds for both WT GB1 and the I6L variant (SI Materials and Methods).
Exchange in Cells.
The fact that the 15N–1H HSQC spectrum of GB1 can be overlaid with the spectrum in buffer (13) indicates the protein is stable in cells. Further, kint values do not change significantly in reconstituted cytosol compared with buffer (61). Unfortunately, we cannot test the requirement that kint is rate determining by changing the pH because we cannot accurately manipulate the intracellular pH. For this reason we turned to the thermodynamic cycle (26), mentioned in Results (Fig. S3). Briefly, if kint is rate determining in cells, the change in caused by a mutation () should be the same in buffer and cells (Fig. 7). Of the 12 comparable residues, 3 (K4, T51, and T53) of the values agree within 1 SD of the mean, and another 3 (Y3, A26, and A34) within 2 SDs. The remaining 6 residues (K28, V29, K31, T44, D46, and F52) differ by more than 2 SDs. We were puzzled that not all of the residues satisfied the condition , because, as discussed above, all 12 residues are exposed only on global unfolding and possess similar protection factors. We hypothesize that the exceptions arise because the thermodynamic cycle neglects the possibility that mutations introduce interactions (with respect to WT) between GB1 and the cytoplasm that are absent in buffer. We are currently testing this hypothesis.
To provide further, albeit indirect, evidence that we are measuring free energies, we estimated the effect the intracellular environment would need to impose on GB1 to move exchange to the EX1 limit (kobs ≈ kop). Using a kcl of 103 s−1 (30) and the average value of for the 17 residues quantified in cells, the cytoplasm would have to decrease kop 102 – 103-fold and decrease kcl by an order of magnitude compared with dilute solution to force exchange into the regime where kcl is rate determining. Such drastic effects are unlikely and have never been observed in cells (5, 6, 8, 63). In summary, the data are consistent with the assumption that we are measuring free energies of opening in cells.
GB1 Structure in Cells.
Although the folding kinetics (5, 6, 8, 51, 63) and equilibrium thermodynamic stability (5–9) of globular proteins can be influenced by crowding, their tertiary structures should remain unchanged (51, 54, 64) because the packing densities of globular proteins approximate those for ideal packing of hard spheres (65). As discussed above, the ability to overlay the in-cell spectrum with that from dilute solution is consistent with this expectation.
Furthermore, the exchange data show similar patterns along the primary structure in both cells and buffer, supporting the conclusion that the tertiary structure is unchanged. More specifically, the pattern of solvent-accessible surface area (SASA) along the sequence has an approximate inverse relationship with (Fig. 4). The average SASA for the 17 residues with quantifiable exchange rates (excluding T18), the seven residues that decay too quickly, and the 24 quench-labeled residues are 0.6 ± 0.3 Å2, 1.3 ± 0.9 Å2, and 2 ± 1 Å2, respectively, where the uncertainties are the sample SDs. Hence, the quench-labeled and rapidly exchanging residues are more likely to have greater solvent exposure. These exposed backbone amide nitrogen atoms are found in loops, the outer strands of the four-stranded sheet (β2 and β3), and the ends of the helix. The observations about SASA are consistent with dilute solution studies of GB1 structure (28, 32), dynamics (31), and H/D exchange (33). We conclude that the cellular interior does not change the structure of GB1 compared with buffer.
Cellular Environment and GB1 Stability.
The cytoplasm of E. coli stabilizes GB1 residues by 0.43 ± 0.06 to 1.14 ± 0.05 kcal/mol compared with buffer at the same pH and temperature (Figs. 4 and 5). Recent advances in both the experimental (5–9, 13, 14, 16–19, 24, 26, 56, 63) and theoretical (20–22, 25) aspects of macromolecular crowding allow this stabilization to be rationalized in terms of the properties of GB1 and the E. coli cytoplasm.
The net effect of macromolecular crowding arises from the relative effects of hard-core repulsions, which are always stabilizing, and longer range interactions, which may be stabilizing or destabilizing (19, 23). GB1 has a pI of 4.8, similar to that of the majority of E. coli proteins (66), and a net charge of −4 at pH 7.6. These properties are expected to result in a large number of charge–charge repulsions in cells. Indeed, it has been suggested that these repulsions are what allow GB1 to tumble freely in the cell and yield high quality in-cell 15N–1H HSQC spectra (13, 14, 54, 55, 67, 68). These repulsive interactions enhance the volume excluded by hard interactions in cells, thus favoring the compact native state and resulting in the observed stabilization. Our results, together with those from others (5–7, 9, 69), show that protein stability in cells can be increased, decreased, or unaffected compared with buffer alone, demonstrating that physiologically relevant crowding effects are context dependent, with the type and strength of quinary interactions (12) playing a key role.
Effect of Protein Crowders in Vitro.
Contrary to the stabilization of GB1 in cells, individual protein crowders destabilize the protein compared with buffer alone (Fig. 6). GB1 is destabilized to such an extent in 100 g/L lysozyme that quantification was not possible. This destabilization can be understood by the prevalence of weak, attractive interactions between positively charged lysozyme (pI = 11.3) and anionic GB1. The attractive interactions are destabilizing because the unfolded state possesses more reactive surface than the folded state, lowering the free energy of the denatured state ensemble relative to the native state.
A similar explanation for destabilization by BSA is less straightforward. Based on our rationale for in-cell stabilization, we expected stabilization of GB1 in 100 g/L BSA (pI = 4.7) compared with buffer alone because both GB1 and BSA have anionic surfaces. However, this destabilization is in agreement with our observations (24, 26, 56, 70) for chymotrypsin inhibitor 2 (CI2, pI = 6.0), supporting the hypothesis that nonspecific, attractive backbone interactions can overcome charge–charge effects and hard-core repulsions. Moreover, the fact that cells are not crowded with only one protein complicates such simplistic comparisons. Nevertheless, the effect of BSA and other protein crowders can be rationalized via Zhou’s realization that despite the presence of stabilizing, repulsive soft interactions between a test protein and a crowder, there exists a temperature above which crowding will be stabilizing (71). Given our data, we expect a cross-over above 37 °C for the BSA–GB1 pair, which is reasonable because the cross-over for CI2–BSA is 37 °C (71).
Contributions to Protein Stability in Cells.
Recent work has shown that the effects of macromolecular crowding on globular protein stability depend on the nature of the crowder (21, 25, 26, 70). Synthetic polymers tend to act as inert spheres and are stabilizing. Physiologically relevant crowders (e.g., proteins, cytoplasm) modulate the hard-core effect through longer range interactions: Attractive forces between the crowder and test protein favor destabilization, and repulsive interactions enhance stability. However, this idea may be too simple, as indicated by our observation on the effect of BSA and the temperature dependence of crowding discussed by Zhou (71). Another complication is the role the cell has in modulating stability via compartmentalization, as highlighted by Gruebele and coworkers (5, 9). Although the present study enriches our knowledge of the forces stabilizing proteins under native conditions, more studies are necessary to bring about a comprehensive understanding of the effects of cellular crowding on protein stability.
Materials and Methods
Plasmid information and protocols for protein growth, purification, H/D exchange and calorimetry experiments can be found in SI Materials and Methods, along with tables of exchange rates, opening free energies, and supporting figures. Unless otherwise stated, pH readings are uncorrected for the deuterium isotope effect (72). Intrinsic rate constants from the online Server Program for Hydrogen Exchange Rate Estimation, SPHERE (44), were calculated for exchange at 37 °C and pH 7.2. Experiments were performed in triplicate. Uncertainties are the SD of the mean.
Supplementary Material
Acknowledgments
We thank Leonard Spicer for providing the plasmid encoding T2Q GB1, Peter Crowley and Ciara Kyne for aiding in GB1 chemical shift assignments, Ashutosh Tripathy for assistance with calorimetry, Marc ter Horst for spectrometer maintenance, members of the G.J.P. laboratory for encouragement, and Elizabeth Pielak for comments on the manuscript. The National Science Foundation (MCB-1051819) supported this work.
Footnotes
The authors declare no conflict of interest.
This article is a PNAS Direct Submission.
This article contains supporting information online at www.pnas.org/lookup/suppl/doi:10.1073/pnas.1406845111/-/DCSupplemental.
References
- 1.Ellis RJ. Macromolecular crowding: An important but neglected aspect of the intracellular environment. Curr Opin Struct Biol. 2001;11(1):114–119. doi: 10.1016/s0959-440x(00)00172-x. [DOI] [PubMed] [Google Scholar]
- 2.Zimmerman SB, Trach SO. Estimation of macromolecule concentrations and excluded volume effects for the cytoplasm of Escherichia coli. J Mol Biol. 1991;222(3):599–620. doi: 10.1016/0022-2836(91)90499-v. [DOI] [PubMed] [Google Scholar]
- 3.Zhou HX, Rivas G, Minton AP. Macromolecular crowding and confinement: Biochemical, biophysical, and potential physiological consequences. Annu Rev Biophys. 2008;37:375–397. doi: 10.1146/annurev.biophys.37.032807.125817. [DOI] [PMC free article] [PubMed] [Google Scholar]
- 4.Ellis RJ. Macromolecular crowding: Obvious but underappreciated. Trends Biochem Sci. 2001;26(10):597–604. doi: 10.1016/s0968-0004(01)01938-7. [DOI] [PubMed] [Google Scholar]
- 5.Dhar A, et al. Protein stability and folding kinetics in the nucleus and endoplasmic reticulum of eucaryotic cells. Biophys J. 2011;101(2):421–430. doi: 10.1016/j.bpj.2011.05.071. [DOI] [PMC free article] [PubMed] [Google Scholar]
- 6.Ebbinghaus S, Dhar A, McDonald JD, Gruebele M. Protein folding stability and dynamics imaged in a living cell. Nat Methods. 2010;7(4):319–323. doi: 10.1038/nmeth.1435. [DOI] [PubMed] [Google Scholar]
- 7.Ghaemmaghami S, Oas TG. Quantitative protein stability measurement in vivo. Nat Struct Biol. 2001;8(10):879–882. doi: 10.1038/nsb1001-879. [DOI] [PubMed] [Google Scholar]
- 8.Ignatova Z, et al. From the test tube to the cell: Exploring the folding and aggregation of a β-clam protein. Biopolymers. 2007;88(2):157–163. doi: 10.1002/bip.20665. [DOI] [PMC free article] [PubMed] [Google Scholar]
- 9.Guzman I, Gelman H, Tai J, Gruebele M. The extracellular protein VlsE is destabilized inside cells. J Mol Biol. 2014;426(1):11–20. doi: 10.1016/j.jmb.2013.08.024. [DOI] [PMC free article] [PubMed] [Google Scholar]
- 10.Laurent TC. The interaction between polysaccharides and other macromolecules. 5. The solubility of proteins in the presence of dextran. Biochem J. 1963;89:253–257. doi: 10.1042/bj0890253. [DOI] [PMC free article] [PubMed] [Google Scholar]
- 11.Minton AP. The effect of volume occupancy upon the thermodynamic activity of proteins: Some biochemical consequences. Mol Cell Biochem. 1983;55(2):119–140. doi: 10.1007/BF00673707. [DOI] [PubMed] [Google Scholar]
- 12.McConkey EH. Molecular evolution, intracellular organization, and the quinary structure of proteins. Proc Natl Acad Sci USA. 1982;79(10):3236–3240. doi: 10.1073/pnas.79.10.3236. [DOI] [PMC free article] [PubMed] [Google Scholar]
- 13.Crowley PB, Chow E, Papkovskaia T. Protein interactions in the Escherichia coli cytosol: An impediment to in-cell NMR spectroscopy. ChemBioChem. 2011;12(7):1043–1048. doi: 10.1002/cbic.201100063. [DOI] [PubMed] [Google Scholar]
- 14.Wang Q, Zhuravleva A, Gierasch LM. Exploring weak, transient protein—protein interactions in crowded in vivo environments by in-cell nuclear magnetic resonance spectroscopy. Biochemistry. 2011;50(43):9225–9236. doi: 10.1021/bi201287e. [DOI] [PMC free article] [PubMed] [Google Scholar]
- 15.Srere PA. Macromolecular interactions: Tracing the roots. Trends Biochem Sci. 2000;25(3):150–153. doi: 10.1016/s0968-0004(00)01550-4. [DOI] [PubMed] [Google Scholar]
- 16.Knowles DB, LaCroix AS, Deines NF, Shkel I, Record MT., Jr Separation of preferential interaction and excluded volume effects on DNA duplex and hairpin stability. Proc Natl Acad Sci USA. 2011;108(31):12699–12704. doi: 10.1073/pnas.1103382108. [DOI] [PMC free article] [PubMed] [Google Scholar]
- 17.Latham MP, Kay LE. Probing non-specific interactions of Ca²+-calmodulin in E. coli lysate. J Biomol NMR. 2013;55(3):239–247. doi: 10.1007/s10858-013-9705-2. [DOI] [PubMed] [Google Scholar]
- 18.Minton AP. Quantitative assessment of the relative contributions of steric repulsion and chemical interactions to macromolecular crowding. Biopolymers. 2013;99(4):239–244. doi: 10.1002/bip.22163. [DOI] [PMC free article] [PubMed] [Google Scholar]
- 19.Sarkar M, Li C, Pielak GJ. Soft interactions and crowding. Biophysical Reviews. 2013;5(2):187–194. doi: 10.1007/s12551-013-0104-4. [DOI] [PMC free article] [PubMed] [Google Scholar]
- 20.Feig M, Sugita Y. Variable interactions between protein crowders and biomolecular solutes are important in understanding cellular crowding. J Phys Chem B. 2012;116(1):599–605. doi: 10.1021/jp209302e. [DOI] [PMC free article] [PubMed] [Google Scholar]
- 21.McGuffee SR, Elcock AH. Diffusion, crowding & protein stability in a dynamic molecular model of the bacterial cytoplasm. PLOS Comput Biol. 2010;6(3):e1000694. doi: 10.1371/journal.pcbi.1000694. [DOI] [PMC free article] [PubMed] [Google Scholar]
- 22.Zhou HX. Influence of crowded cellular environments on protein folding, binding, and oligomerization: Biological consequences and potentials of atomistic modeling. FEBS Lett. 2013;587(8):1053–1061. doi: 10.1016/j.febslet.2013.01.064. [DOI] [PMC free article] [PubMed] [Google Scholar]
- 23.Gershenson A. Deciphering protein stability in cells. J Mol Biol. 2014;426(1):4–6. doi: 10.1016/j.jmb.2013.10.004. [DOI] [PMC free article] [PubMed] [Google Scholar]
- 24.Miklos AC, Sarkar M, Wang Y, Pielak GJ. Protein crowding tunes protein stability. J Am Chem Soc. 2011;133(18):7116–7120. doi: 10.1021/ja200067p. [DOI] [PubMed] [Google Scholar]
- 25.Harada R, Tochio N, Kigawa T, Sugita Y, Feig M. Reduced native state stability in crowded cellular environment due to protein-protein interactions. J Am Chem Soc. 2013;135(9):3696–3701. doi: 10.1021/ja3126992. [DOI] [PMC free article] [PubMed] [Google Scholar]
- 26.Sarkar M, Smith AE, Pielak GJ. Impact of reconstituted cytosol on protein stability. Proc Natl Acad Sci USA. 2013;110(48):19342–19347. doi: 10.1073/pnas.1312678110. [DOI] [PMC free article] [PubMed] [Google Scholar]
- 27.Fahnestock SR, Alexander P, Nagle J, Filpula D. Gene for an immunoglobulin-binding protein from a group G streptococcus. J Bacteriol. 1986;167(3):870–880. doi: 10.1128/jb.167.3.870-880.1986. [DOI] [PMC free article] [PubMed] [Google Scholar]
- 28.Gronenborn AM, et al. A novel, highly stable fold of the immunoglobulin binding domain of streptococcal protein G. Science. 1991;253(5020):657–661. doi: 10.1126/science.1871600. [DOI] [PubMed] [Google Scholar]
- 29.Alexander P, Fahnestock S, Lee T, Orban J, Bryan P. Thermodynamic analysis of the folding of the streptococcal protein G IgG-binding domains B1 and B2: Why small proteins tend to have high denaturation temperatures. Biochemistry. 1992;31(14):3597–3603. doi: 10.1021/bi00129a007. [DOI] [PubMed] [Google Scholar]
- 30.Alexander P, Orban J, Bryan P. Kinetic analysis of folding and unfolding the 56 amino acid IgG-binding domain of streptococcal protein G. Biochemistry. 1992;31(32):7243–7248. doi: 10.1021/bi00147a006. [DOI] [PubMed] [Google Scholar]
- 31.Barchi JJ, Jr, Grasberger B, Gronenborn AM, Clore GM. Investigation of the backbone dynamics of the IgG-binding domain of streptococcal protein G by heteronuclear two-dimensional 1H-15N nuclear magnetic resonance spectroscopy. Protein Sci. 1994;3(1):15–21. doi: 10.1002/pro.5560030103. [DOI] [PMC free article] [PubMed] [Google Scholar]
- 32.Gallagher T, Alexander P, Bryan P, Gilliland GL. Two crystal structures of the B1 immunoglobulin-binding domain of streptococcal protein G and comparison with NMR. Biochemistry. 1994;33(15):4721–4729. [PubMed] [Google Scholar]
- 33.Orban J, Alexander P, Bryan P, Khare D. Assessment of stability differences in the protein G B1 and B2 domains from hydrogen-deuterium exchange: Comparison with calorimetric data. Biochemistry. 1995;34(46):15291–15300. doi: 10.1021/bi00046a038. [DOI] [PubMed] [Google Scholar]
- 34.Smith CK, Withka JM, Regan L. A thermodynamic scale for the β-sheet forming tendencies of the amino acids. Biochemistry. 1994;33(18):5510–5517. doi: 10.1021/bi00184a020. [DOI] [PubMed] [Google Scholar]
- 35.Kuszewski J, Clore GM, Gronenborn AM. Fast folding of a prototypic polypeptide: The immunoglobulin binding domain of streptococcal protein G. Protein Sci. 1994;3(11):1945–1952. doi: 10.1002/pro.5560031106. [DOI] [PMC free article] [PubMed] [Google Scholar]
- 36.Park S-H, Shastry MCR, Roder H. Folding dynamics of the B1 domain of protein G explored by ultrarapid mixing. Nat Struct Biol. 1999;6(10):943–947. doi: 10.1038/13311. [DOI] [PubMed] [Google Scholar]
- 37.Krantz BA, Mayne L, Rumbley J, Englander SW, Sosnick TR. Fast and slow intermediate accumulation and the initial barrier mechanism in protein folding. J Mol Biol. 2002;324(2):359–371. doi: 10.1016/s0022-2836(02)01029-x. [DOI] [PubMed] [Google Scholar]
- 38.Morrone A, et al. GB1 is not a two-state folder: Identification and characterization of an on-pathway intermediate. Biophys J. 2011;101(8):2053–2060. doi: 10.1016/j.bpj.2011.09.013. [DOI] [PMC free article] [PubMed] [Google Scholar]
- 39.Pace CN. Measuring and increasing protein stability. Trends Biotechnol. 1990;8(4):93–98. doi: 10.1016/0167-7799(90)90146-o. [DOI] [PubMed] [Google Scholar]
- 40.Linderstrøm-Lang KU. In: Symposium on Protein Structure. Neuberger A, editor. London: Methuen; 1958. pp. 23–34. [Google Scholar]
- 41.Dempsey CE. Hydrogen exchange in peptides and proteins using NMR spectroscopy. Prog Nucl Magn Reson Spectrosc. 2001;39:135–170. [Google Scholar]
- 42.Hvidt A, Nielsen SO. Hydrogen exchange in proteins. Adv Protein Chem. 1966;21:287–386. doi: 10.1016/s0065-3233(08)60129-1. [DOI] [PubMed] [Google Scholar]
- 43.Bai Y, Milne JS, Mayne L, Englander SW. Primary structure effects on peptide group hydrogen exchange. Proteins. 1993;17(1):75–86. doi: 10.1002/prot.340170110. [DOI] [PMC free article] [PubMed] [Google Scholar]
- 44. Zhang Y-Z (1995) Protein and peptide structure and interactions studied by hydrogen exchange and NMR. PhD thesis (Structural Biology and Molecular Biophysics, University of Pennsylvania, Philadelphia). Available at www.fccc.edu/research/labs/roder/sphere/. Accessed July 7, 2014.
- 45.Ferraro DM, Lazo N, Robertson AD. EX1 hydrogen exchange and protein folding. Biochemistry. 2004;43(3):587–594. doi: 10.1021/bi035943y. [DOI] [PubMed] [Google Scholar]
- 46.Englander SW, Mayne L. Protein folding studied using hydrogen-exchange labeling and two-dimensional NMR. Annu Rev Biophys Biomol Struct. 1992;21:243–265. doi: 10.1146/annurev.bb.21.060192.001331. [DOI] [PubMed] [Google Scholar]
- 47.Englander SW, Kallenbach NR. Hydrogen exchange and structural dynamics of proteins and nucleic acids. Q Rev Biophys. 1983;16(4):521–655. doi: 10.1017/s0033583500005217. [DOI] [PubMed] [Google Scholar]
- 48.Raschke TM, Marqusee S. Hydrogen exchange studies of protein structure. Curr Opin Biotechnol. 1998;9(1):80–86. doi: 10.1016/s0958-1669(98)80088-8. [DOI] [PubMed] [Google Scholar]
- 49.Englander SW, Sosnick TR, Englander JJ, Mayne L. Mechanisms and uses of hydrogen exchange. Curr Opin Struct Biol. 1996;6(1):18–23. doi: 10.1016/s0959-440x(96)80090-x. [DOI] [PMC free article] [PubMed] [Google Scholar]
- 50.Bai Y, Sosnick TR, Mayne L, Englander SW. Protein folding intermediates: Native-state hydrogen exchange. Science. 1995;269(5221):192–197. doi: 10.1126/science.7618079. [DOI] [PMC free article] [PubMed] [Google Scholar]
- 51.Inomata K, et al. High-resolution multi-dimensional NMR spectroscopy of proteins in human cells. Nature. 2009;458(7234):106–109. doi: 10.1038/nature07839. [DOI] [PubMed] [Google Scholar]
- 52.Serber Z, et al. High-resolution macromolecular NMR spectroscopy inside living cells. J Am Chem Soc. 2001;123(10):2446–2447. doi: 10.1021/ja0057528. [DOI] [PubMed] [Google Scholar]
- 53.Miklos AC, Li C, Pielak GJ. Using NMR-detected backbone amide 1H exchange to assess macromolecular crowding effects on globular-protein stability. Methods Enzymol. 2009;466:1–18. doi: 10.1016/S0076-6879(09)66001-8. [DOI] [PubMed] [Google Scholar]
- 54.Reardon PN, Spicer LD. Multidimensional NMR spectroscopy for protein characterization and assignment inside cells. J Am Chem Soc. 2005;127(31):10848–10849. doi: 10.1021/ja053145k. [DOI] [PubMed] [Google Scholar]
- 55.Xu G, et al. Strategies for protein NMR in Escherichia coli. Biochemistry. 2014;53(12):1971–1981. doi: 10.1021/bi500079u. [DOI] [PubMed] [Google Scholar]
- 56.Wang Y, Sarkar M, Smith AE, Krois AS, Pielak GJ. Macromolecular crowding and protein stability. J Am Chem Soc. 2012;134(40):16614–16618. doi: 10.1021/ja305300m. [DOI] [PubMed] [Google Scholar]
- 57.Gronenborn AM, Frank MK, Clore GM. Core mutants of the immunoglobulin binding domain of streptococcal protein G: Stability and structural integrity. FEBS Lett. 1996;398(2-3):312–316. doi: 10.1016/s0014-5793(96)01262-8. [DOI] [PubMed] [Google Scholar]
- 58.Lindman S, et al. Salting the charged surface: pH and salt dependence of protein G B1 stability. Biophys J. 2006;90(8):2911–2921. doi: 10.1529/biophysj.105.071050. [DOI] [PMC free article] [PubMed] [Google Scholar]
- 59.Becktel WJ, Schellman JA. Protein stability curves. Biopolymers. 1987;26(11):1859–1877. doi: 10.1002/bip.360261104. [DOI] [PubMed] [Google Scholar]
- 60.Huyghues-Despointes BMP, Scholtz JM, Pace CN. Protein conformational stabilities can be determined from hydrogen exchange rates. Nat Struct Biol. 1999;6(10):910–912. doi: 10.1038/13273. [DOI] [PubMed] [Google Scholar]
- 61.Smith AE, Sarkar M, Young GB, Pielak GJ. Amide proton exchange of a dynamic loop in cell extracts. Protein Sci. 2013;22(10):1313–1319. doi: 10.1002/pro.2318. [DOI] [PMC free article] [PubMed] [Google Scholar]
- 62.Molday RS, Englander SW, Kallen RG. Primary structure effects on peptide group hydrogen exchange. Biochemistry. 1972;11(2):150–158. doi: 10.1021/bi00752a003. [DOI] [PubMed] [Google Scholar]
- 63.Guo M, Xu Y, Gruebele M. Temperature dependence of protein folding kinetics in living cells. Proc Natl Acad Sci USA. 2012;109(44):17863–17867. doi: 10.1073/pnas.1201797109. [DOI] [PMC free article] [PubMed] [Google Scholar]
- 64.Sakakibara D, et al. Protein structure determination in living cells by in-cell NMR spectroscopy. Nature. 2009;458(7234):102–105. doi: 10.1038/nature07814. [DOI] [PubMed] [Google Scholar]
- 65.Richards FM. Areas, volumes, packing and protein structure. Annu Rev Biophys Bioeng. 1977;6:151–176. doi: 10.1146/annurev.bb.06.060177.001055. [DOI] [PubMed] [Google Scholar]
- 66.Spitzer J, Poolman B. The role of biomacromolecular crowding, ionic strength, and physicochemical gradients in the complexities of life’s emergence. Microbiol Mol Biol Rev. 2009;73(2):371–388. doi: 10.1128/MMBR.00010-09. [DOI] [PMC free article] [PubMed] [Google Scholar]
- 67.Selenko P, Serber Z, Gadea B, Ruderman J, Wagner G. Quantitative NMR analysis of the protein G B1 domain in Xenopus laevis egg extracts and intact oocytes. Proc Natl Acad Sci USA. 2006;103(32):11904–11909. doi: 10.1073/pnas.0604667103. [DOI] [PMC free article] [PubMed] [Google Scholar]
- 68.Li C, Liu M. Protein dynamics in living cells studied by in-cell NMR spectroscopy. FEBS Lett. 2013;587(8):1008–1011. doi: 10.1016/j.febslet.2012.12.023. [DOI] [PubMed] [Google Scholar]
- 69.Ignatova Z, Gierasch LM. Monitoring protein stability and aggregation in vivo by real-time fluorescent labeling. Proc Natl Acad Sci USA. 2004;101(2):523–528. doi: 10.1073/pnas.0304533101. [DOI] [PMC free article] [PubMed] [Google Scholar]
- 70.Sarkar M, Lu J, Pielak GJ. Protein crowder charge and protein stability. Biochemistry. 2014;53(10):1601–1606. doi: 10.1021/bi4016346. [DOI] [PubMed] [Google Scholar]
- 71.Zhou HX. Polymer crowders and protein crowders act similarly on protein folding stability. FEBS Lett. 2013;587(5):394–397. doi: 10.1016/j.febslet.2013.01.030. [DOI] [PMC free article] [PubMed] [Google Scholar]
- 72.Glasoe PK, Long FA. Use of glass electrodes to measure acidities in deuterium oxide. J Phys Chem B. 1960;64(1):188–190. [Google Scholar]
- 73.Cavallo L, Kleinjung J, Fraternali F. POPS: A fast algorithm for solvent accessible surface areas at atomic and residue level. Nucleic Acids Research. 2003;31(13):3364–3366. doi: 10.1093/nar/gkg601. [DOI] [PMC free article] [PubMed] [Google Scholar]


