Abstract
Dysregulation of cyclin D2 contributes to the pathogenesis of multiple myeloma, and can occur through translocations that activate MAF/MAFB or MMSET/FGFR3. However, cyclin D2 induction can also be seen in the absence of such translocations, such as in patients with hyperdiploid disease, through unknown mechanisms. In UniGene cluster data-mining and ECgene analysis, we found that zinc-finger with KRAB and SCAN domains 3 (ZKSCAN3), a novel transcription factor, is over-represented in this malignancy, and three consensus ZKSCAN3 binding sites were found in the cyclin D2 promoter. Analysis of a panel of myeloma cell lines, primary patient samples, and datasets from Oncomine and the Multiple Myeloma Genomics Portal (MMGP) revealed expression of ZKSCAN3 mRNA in a majority of samples. Studies of cell lines by Western blotting, and of primary tissue microarrays by immunohistochemistry, showed ZKSCAN3 protein expression in a majority, and in a manner that paralleled messenger levels in cell lines. ZKSCAN3 overexpression was associated with increased gene copy number or genomic DNA gain/amplification in a subset based on analysis of data from the MMGP, and from FISH studies of cell lines and primary samples. Overexpression of ZKSCAN3 induced cyclin D2 promoter activity in a MAF/MAFB-independent manner, and to an extent that was influenced by the number of consensus ZKSCAN3 binding sites. Moreover, ZKSCAN3 protein expression correlated with cyclin D2 levels in cell lines and primary samples, and its overexpression induced cyclin D2. Conversely, ZKSCAN3 suppression using shRNAs reduced cyclin D2 levels, and, importantly, inhibited myeloma cell line proliferation. Finally, ZKSCAN3 was noted to specifically bind to oligonucleotides representing sequences from the cyclin D2 promoter, and to the endogenous promoter itself in myeloma cells. Taken together, the data support the conclusion that ZKSCAN3 induction represents a mechanism by which myeloma cells can induce cyclin D2 dysregulation, and contribute to disease pathogenesi.
Keywords: ZKSCAN3, cyclin D2, multiple myeloma, transcription regulation, pathogenesis
Introduction
Multiple myeloma is a malignant plasma cell disorder and the second most frequently diagnosed hematologic malignancy (Kyle and Rajkumar, 2008). Significant progress has been made in understanding the molecular pathogenesis of myeloma. Many patients have non-hyperdiploid disease, and present with chromosomal translocations involving the immunoglobulin enhancer that dysregulate a cyclin D gene directly or indirectly. Examples of the former include cyclin D1, which is activated by t(11;14)(q13;q32)(Chesi et al., 1996; Gabrea et al., 1999), and cyclin D3, which is activated by t(6;14)(p21;q32)(Shaughnessy et al., 2001). Examples of the latter include cyclin D2, whose overexpression can be induced indirectly by dysregulation of the V-maf musculoaponeurotic fibrosarcoma oncogene homologs MAF and MAFB (Bergsagel et al., 2005). These occur through the t(14;16)(q32;q23) and t(14;20)(q32;q11)(Chesi et al., 1998a; Hurt et al., 2004) translocations, respectively. Overexpression of cyclin D2 is also seen in other settings, such as in patients with t(4;14)(p16.3;q32)(Chesi et al., 1997; Hurt et al., 2004), which dysregulates the Wolf-Hirschhorn syndrome candidate 1 (WHSC1, also known as MMSET), and the receptor tyrosine kinase fibroblast growth factor receptor-3 genes (Chesi et al., 1997; Chesi et al., 1998b). However, the mechanism of cyclin D2 induction in these cases, and in other nonhyperdiploid myelomas that overexpress cyclin D2 protein, is not known.
Up to one-half or more of patients do not harbor these translocations, and instead have a hyperdiploid karyotype (Hideshima et al., 2007). As in non-hyperdiploid cases, cyclin D dysregulation is seen here as well, with patients having disease that overexpresses cyclin D1, D2, or both. This has led to the hypothesis that cyclin D dysregulation is an early unifying event in myelomagenesis (Bergsagel and Kuehl, 2005; Bergsagel et al., 2005). Indeed, the above findings have been used as the basis for the TC classification system, in which myeloma is divided into categories based on the type of translocation and cyclin D dysregulation present (Bergsagel and Kuehl, 2005; Bergsagel et al., 2005). However, while cyclin D1 overexpression is felt to be due to a gene dose effect in hyperdiploid disease, the basis for cyclin D2 induction is not known. Thus, identification of novel mechanisms by which cyclin D isoforms can be dysregulated is important, since these could both contribute to disease pathogenesis and biology, and serve as therapeutic targets.
We previously identified the Zinc-finger protein with KRAB and SCAN domains 3 (ZKSCAN3) as a new “driver” of colon cancer progression (Yang et al., 2008a). Unbiased screening by Cyclic Amplification and Selection of Targets (CAST) identified the DNA recognition motif (Yang et al., 2008b). ECgene analysis indicated ZKSCAN3 was predominantly expressed in malignant bone marrow cells, and sequence analysis showed several binding sites upstream of the cyclin D2 promoter. These findings led us to evaluate the possibility that ZKSCAN3 could play a role in the pathogenesis of myeloma. In these studies, we found that ZKSCAN3 was overexpressed in a substantial proportion of myeloma cell lines and primary patient-derived samples, and in at least some this was associated with increased gene copy number. ZKSCAN3 bound and activated the cyclin D2 promoter and induced cyclin D2 expression, while its suppression reduced cyclin D2 levels, and inhibited myeloma proliferation. Based on these findings, we propose that ZKSCAN3 dysregulation is a novel mechanism used by myelomatous plasma cells to induce cyclin D2 expression.
Materials and Methods
Cell lines and primary samples
Myeloma cell lines were propagated as previously described (Voorhees et al., 2007), while HeLa cells were maintained in similarly supplemented modified Eagle medium. Primary cells were obtained through the Department of Lymphoma/Myeloma Tissue Bank, and collected as marrow aspirates after informed consent was obtained in accordance with the Declaration of Helsinki. Mononuclear cell fractions were prepared by density gradient centrifugation, and malignant cells were isolated by CD138+ selection (Miltenyi Biotec, Inc., Auburn, CA). The current studies on deidentified aliquots were performed according to an Institutional Review Board-approved protocol. Normal human CD19+ B-cell total RNA was from Miltenyi Biotec, Inc., and plasma cell cDNA was from AllCells LLC. (Berkeley, CA).
Constructs
The cyclin D2 promoter reporters (D2-luc) containing wild type or mutant MAF binding sites were kindly provided by Dr. Louis Staudt (Metabolism Branch, Center for Cancer Research, National Cancer Institute). Wild-type D2-luc was subjected to site-directed mutagenesis to mutate ZKSCAN3 binding sites using the QuikChange Site-Directed Mutagenesis Kit (Agilent Technologies, Inc.). pBluescriptR-MAF (Open Biosystems) was used to subclone MAF cDNA to the pLVX vector, while the pLVTHM Lentiviral vector was kindly provided by Didier Trono (Ecole Polytechnique Fe’de’rale de Lausanne, Lausanne, Switzerland).
Nucleofection
Transfection of pIRES2-EGFP-ZKSCAN3 or the vector control was performed using the Amaxa® Cell Line Optimization Kit (Lonza, Basel, Switzerland), and transfected cells were selected in G418.
Cell proliferation and cell cycle analysis
Cellular proliferation was evaluated using the tetrazolium reagent WST-1 (Roche Diagnostics Corp., Indianapolis, IN) as previously described (Kuhn et al., 2007). For cell cycle studies, cells were seeded at the same initial density, fixed after 48 hours, stained with 50 μg/mL of propidium iodide with RNaseA, and incubated at 37°C prior to analysis.
Quantitative real-time polymerase chain reaction (qPCR)
Expression of ZKSCAN3 and cyclin D2 mRNA were determined in triplicate using an ABI PRISM 7900 HT Sequence Detection System (Life Technologies Corporation) by the TaqMan® Gene Expression Assay (Life Technologies Corporation) with βactin or glyceraldehyde phosphate dehydrogenase (GAPDH) as controls. To determine the ZKSCAN3 gene copy number, whole genomic DNA was analyzed by File Builder v3.1 software (Life Technologies Corporation). DNA regions without repeat elements or low complexity DNA were selected to do Basic Local Alignment Search Tool (BLAST) searches for sequence similarity, and a sequence >1000 bp unique to ZKSCAN3 was selected to design qPCR primers with the RNase P1 gene as an internal control. Genomic DNA was made with the QIAamp DNA Blood Mini Kit (Qiagen), with normal human white blood cells as a control. qPCR was performed with 10 ng of genomic DNA using an ABI PRISM 7900 HT Sequence Detection System.
Reverse transcriptase-PCR analysis
Reverse transcriptase-PCR (RT-PCR) used primers for ZKSCAN3 [RT-5: 5′-GGCCCTGACCCTCACCCC-3′; RT-3: 5′-CAGATGTGCCGCCTCCCTCC-3′] and β-actin [RT-5: 5′-ACACTGTGCCCATCTACGAGG-3′; RT-3: 5′-AGGGGCCGGACTCGTCATACT-3′], and 30 amplification cycles.
Immunohistochemistry
Tissue microarray slides were from U.S. Biomax, Inc. (Rockville, MD). Immunohistochemistry (IHC) was performed as previously described (Yang et al., 2008b).
Electrophoretic mobility shift assays (EMSA)
Nuclear extract (10 μg) was mixed with 0.6 μg of poly(dI/dC), 2x10⁴ cpm of γ-32P-labeled oligonucleotide, and, where indicated, anti-ZKSCAN3 (2 and 6 μg) or pre-immune IgG (6 μg). The wild-type cyclin D2 oligonucleotide sequence was 5′-TTCTAAAATCACCCCCTCCCTTAT-3′, and the mutant was 5′-TTCTAAAATCACTATAATTCTTAT-3′ spanning the putative ZKSCAN3 binding motif in the cyclin D2 promoter.
Chromatin immunoprecipitation assays (ChIP)
ChIP was performed using the ChIP-IT™ Kit (Active Motif, Carlsbad, CA). Specific primers targeted the ZKSCAN3 binding motif at −82 to −495 nucleotides upstream from the cyclin D2 promoter (5′ primer: 5′-CTGGTCCCTTTAATCGGGGC-3′; 3′ primer: 5-GATCCTAATCCTCCTGCCCTTG-3′). Non-specific primers targeted a region of the cyclin D2 promoter without ZKSCAN3 binding sites that was >3kb away (5′ primer: 5′-GCAGGGAGGAATATGTCGCG-3′; 3′ primer: 5′- ATCTTCCACCCCCAAGCAGT-3′) (Supplementary Figure 5A). For primer design, the cyclin D2 promoter sequence was analyzed by the File Builder v3.1 software (Applied Biosystems) and BLAST to exclude repeat elements, low complexity DNA, and regions with sequence similarity. The resulting promoter sequences spanning or distant from the ZKSCAN3 binding sites were chosen to design specific and non-specific TaqMan® primers, respectively.
ZKSCAN3 knockdown
ZKSCAN3 shRNAs were generated using the Dharmacon Custom siRNA Design Tool and sub-cloned into pLVTHM with a GFP selection marker. One shRNA that showed effective knockdown targeted the sequence CCACCTGAGAGAAGACATT in the ZKSCAN3 open reading frame. The corresponding Lentivirus was produced by transfecting human embryonic kidney cells (293FT; Invitrogen) with pLVTHM containing the ZKSCAN3-shRNA or non-targeting shRNA sequences, the packaging plasmid (MD2G), and the envelope plasmid (PAX2). To silence ZKSCAN3, myeloma cells plated at 1x10⁶ in 6-well plates were transduced with the virus, and after 16 hours, the virus-containing medium was replaced with normal growth medium. Transduced cells were sorted by analysis for green fluorescent protein expression.
Western-blot analysis
Protein expression in ZKSCAN3 knockdown cells was measured by Western blotting (Yang et al., 2008a; Yang et al., 2008b). Antibody to cyclin D2 was purchased from Cell Signaling Technologies, while anti–β-actin was from Sigma-Aldrich.
Luciferase reporter assays
HeLa cells were transfected with the indicated plasmids, and cell lysates were probed using the Luciferase Assay System (Promega Corporation, Madison, WI). Data were obtained from at least three sets of transfections, and are presented as the mean with the standard deviation.
Fluorescence in situ hybridization (FISH)
FISH studies for ZKSCAN3 were performed according to previously described procedures (Chang et al., 2006). Briefly, Bacterial Artificial Chromosome clones were purchased from the Children’s Hospital Oakland Research Institute, and sequencing verified that clone RP11-245E14 contained full length ZKSCAN3. The DNA was then labeled with SpectrumGreen-dUTP using the Nick Translation Kit (Abbott Molecular, Abbott Park, Illinois), and the probe was validated to confirm the ZKSCAN3 location at 6p22.1 using one positive control (RPMI 8226 cells), and 10 normal samples. Interphase nuclei in marrow aspirates from ten randomly selected myeloma patients were then analyzed by FISH, and a minimum of 200 interphase cells were analyzed for each probe. Only samples that contained three or more FISH signals in >10.3% of cells were considered positive for ZKSCAN3 amplification (Lu et al., 2010).
Results
ZKSCAN3 is expressed in multiple myeloma
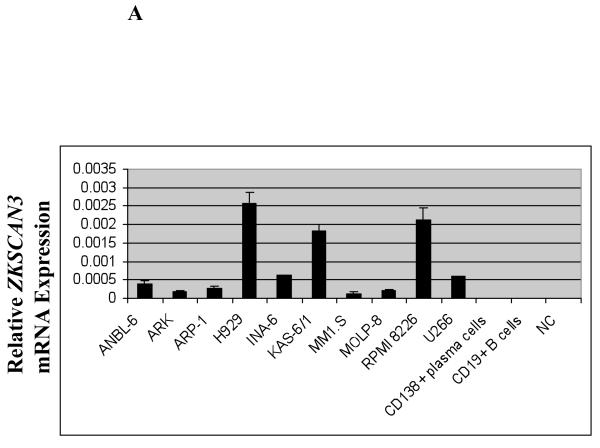
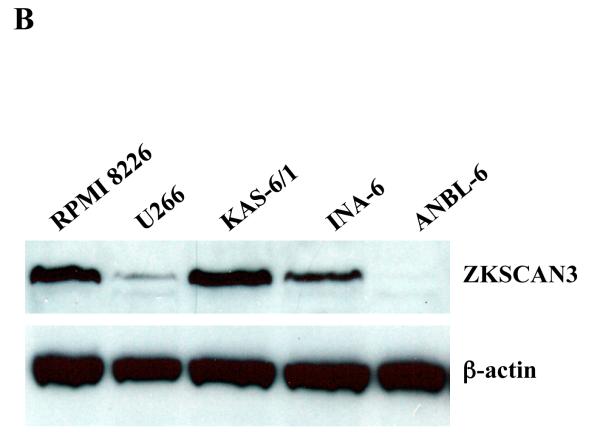
We previously identified ZKSCAN3 as a novel zinc-finger transcription factor expressed in colon carcinoma (Yang et al., 2008a; Yang et al., 2008b). In querying the Unigene Cluster (Build 198, released 2007-01-13) and ECgene EST Expression databases (http://genome.ewha.ac.kr/ECgene/; Supplementary Figure 1), expressed sequence tags corresponding to ZKSCAN3 were found predominantly in myeloma and malignant marrow elements. To directly evaluate the expression of ZKSCAN3, qPCR studies were performed on a panel of ten myeloma cell lines (Figure 1A). ZKSCAN3 was expressed to at least some extent in all of the lines tested, while no ZKSCAN3 expression was detected in either normal CD19+ B-cells, or normal CD138+ plasma cells. Five of these cell lines with different ZKSCAN3 mRNA levels were then selected to evaluate protein expression (Figure 1B). Western blotting indicated a correlation between mRNA and protein levels in that U266 and ANBL-6 showed low ZKSCAN3 protein expression, while RPMI 8226 and KAS-6/1 cells revealed high levels of both.
Figure 1.
ZKSCAN3 is expressed in multiple myeloma plasma cells.
(a) ZKSCAN3 mRNA levels were evaluated in a panel of ten multiple myeloma cell lines, with normal CD19+ B-cells and normal CD138+ plasma cells serving as controls. Quantitation was performed on total RNA samples by qPCR, and expressed as the mean relative mRNA level plus or minus the standard deviation from experiments performed in triplicate after normalization to GAPDH. Please note that NC represents a negative control.
(b) Western blotting was performed to evaluate ZKSCAN3 protein levels in five representative multiple myeloma cell lines used in panel A, with β-actin serving as a loading control.
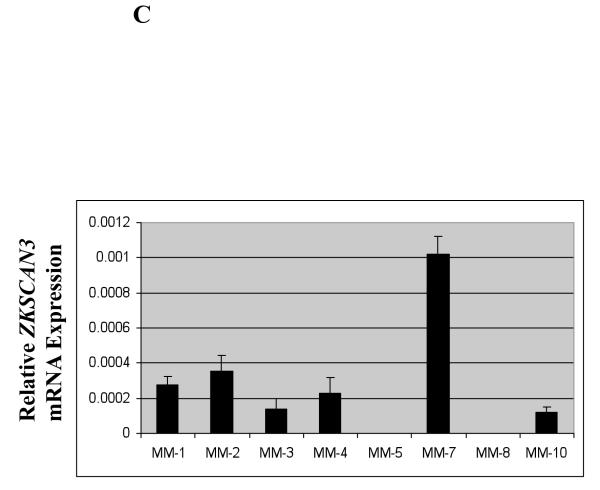
(c) Primary patient samples were evaluated for their expression of ZKSCAN3 mRNA by qPCR, which was standardized and presented as described above.
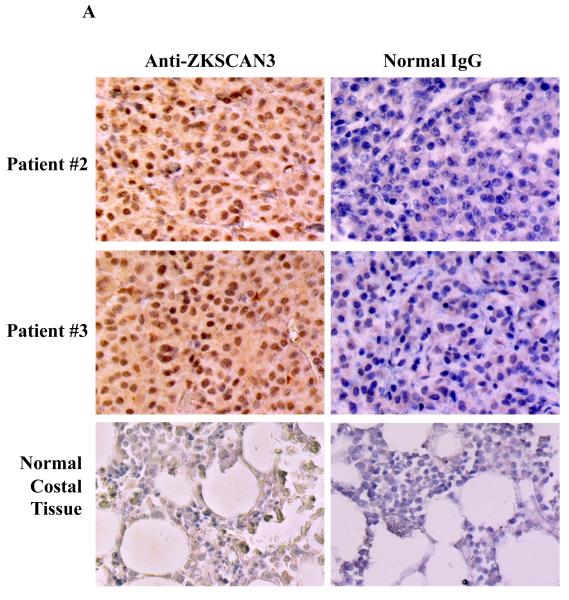
Primary patient samples were then studied by qPCR utilizing banked CD138+ purified plasma cells. Among eight such samples, six showed evidence of ZKSCAN3 mRNA expression (Figure 1C), with one, MM-7, demonstrating especially high levels. To gain additional insights, tissue arrays containing normal and myelomatous sections were examined by IHC with anti-ZKSCAN3 antibodies. Out of ten myeloma patient samples represented on this array, eight showed strong staining (Figure 2A, upper and middle panel, and Supplementary Figure 2A). Normal control sections showed no evidence of significant ZKSCAN3 expression (Figure 2A, lower panel and Supplementary Figure 2A, patient #11 and #12), as was the case for normal hematopoietic elements. Additional tissue array slides were examined in which 4/4 myeloma patient samples showed strong ZKSCAN3 nuclear staining (Supplementary Figure 2B).
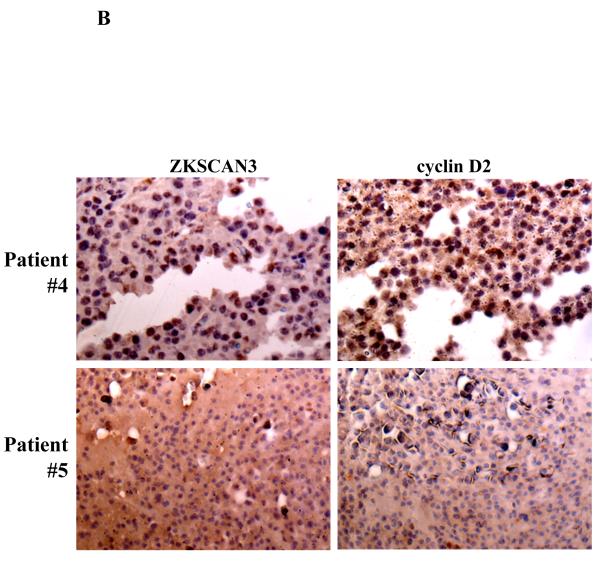
Figure 2.
Expression of ZKSCAN3 and cyclin D2 protein in primary patient tissue samples.
(a) Tissue microarray slides containing samples from patients with multiple myeloma, as well as from control patients, were subjected to immunohistochemistry with anti-ZKSCAN3 antibodies, or with normal IgG as a control.
(b) ZKSCAN3 and cyclin D2 expression were probed by immunohistochemistry in tissue microarray slides, and high power magnifications are shown for two representative samples.
To rule out the possibility that this frequent detection of ZKSCAN3 overexpression was a result of our limited sample size, unbiased analysis using Oncomine datasets was performed. Affymetrix designed 4 probe sets representing the ZKSCAN3 cDNA, but two of them (1562303_at and 1562305_x_at) were located in ZKSCAN3 genomic regions, and were therefore excluded from our analysis. The remaining two probe sets (Probe-1: 211773_s_at) and (Probe-2: 33952_at) mapped to the ZKSCAN3 3’-un-translated region (UTR), and a region covering part of the last coding exon and the 3′-UTR, respectively (Supplementary Figure 3A). Interestingly, further analysis with Probes-1 and 2 showed that ZKSCAN3 was expressed in more than 93% of primary myeloma samples (Supplementary Figure 3B). Since ZKSCAN3 was not expressed in normal CD138+ plasma cells, these findings support a possible role for ZKSCAN3 in myeloma pathobiology.
Gene copy number increases contribute to ZKSCAN3 overexpression
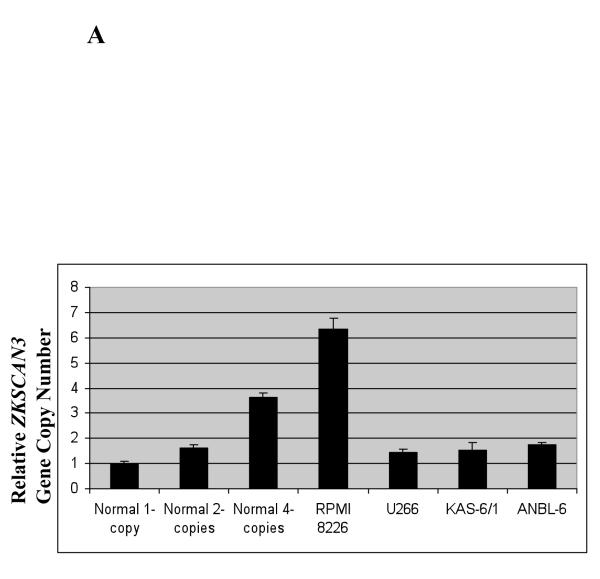
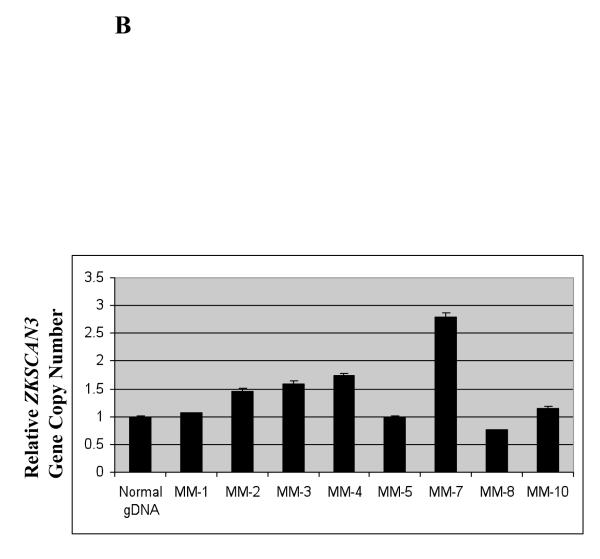
The ZKSCAN3 locus at 6p22.1 has not been reported to be amplified or translocated in myeloma, but it was of interest to examine this possibility, since 6p22 can be amplified or gained in other tumors (Santos et al., 2007). Thus, we applied qPCR using 10, 20, and 40 ng of normal DNA input as a control, which exhibited dosage-dependent signal increases representing one, two, and four gene copies, respectively (Figure 3A). RPMI 8226 cells, which have high endogenous ZKSCAN3 expression, showed six copies of the ZKSCAN3 gene. KAS-6/1 cells, however, which showed comparable ZKSCAN3 expression, did not show obvious gene copy number changes, suggesting that other mechanisms may contribute to overexpression of this transcription factor. We then performed qPCR on the primary myeloma patient samples studied earlier, and found that 4/8 had evidence for ZKSCAN3 gene copy number gains from ~1.5-~2.8 (Figure 3B). Interestingly, the patient sample with the greatest ZKSCAN3 mRNA expression level also had the highest gene copy number.
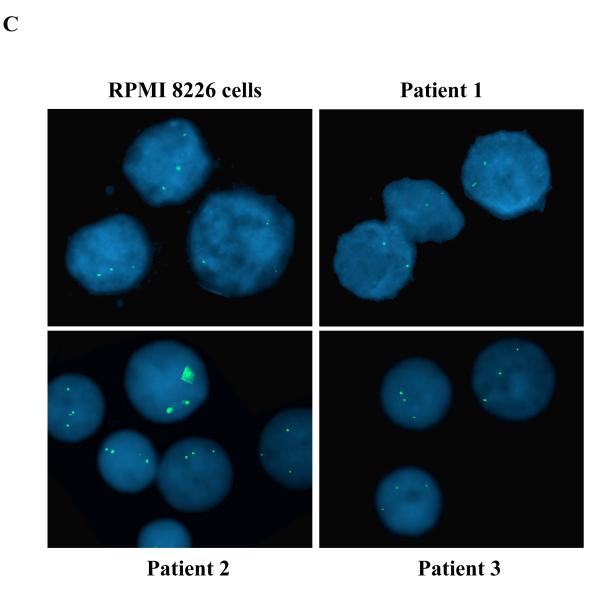
Figure 3.
Gene copy number increases contribute to ZKSCAN3 overexpression.
(a) Multiple myeloma cell lines expressing ZKSCAN3 at the mRNA and protein level were evaluated for gene copy number using qPCR. The mean gene copy number plus or minus the standard deviation from experiments performed in triplicate are shown in comparison to controls.
(b) ZKSCAN3 gene copy number analysis was performed on the same patient samples used in Figure 1C as described above, and the results are expressed in relation to normal genomic DNA (gDNA) as a control.
(c) FISH was performed to analyze ZKSCAN3 gene copy number using RPMI 8226 cells as a positive control (upper left panel), and KAS-6/1 cells as a negative control (data not shown). Out of ten primary patient samples analyzed, eight revealed a normal signal with two copies of the locus of interest, of which one representative sample is shown (upper right panel). Two myeloma samples consisted of a significant proportion of cells with three signals per cell (lower right and left panels).
Since our ZKSCAN3 copy number data were from a limited panel of samples, we then analyzed the possible presence of ZKSCAN3 gene amplification using the array comparative genomic hybridization (aCGH) datasets from the Multiple Myeloma Genomics Portal (MMGP)(http://www.broad.mit.edu/mmgp/pages/portalHome.jsf). We performed a density plot analysis on the Mayo Clinic dataset, which contains 62 myeloma patients, and set up the threshold values using all segments from chromosome 6 to determine the copy number of segments as “increased” and “decreased” (Supplementary Methods). The analysis showed that the main mode of the density plot was at 1.942, very close to two copies, which represented “no change.” Treating this component as a normal distribution, we estimated the mean and standard deviation (SD) for this component alone, and determined that copy numbers less than 1.5262 represented gene loss, while values of more than 2.3584 represented a gain of gene copy number. Using these estimates, among all 62 patients, we observed that 6.5% (4/62) had decreased ZKSCAN3 gene copy number, while 58% (36/62) of patients showed increased ZKSCAN3 gene copy number (Supplementary Figure 4A; Supplementary Table 1).
Another MMGP aCGH dataset we analyzed was of 47 multiple myeloma cell lines from the Mayo Clinic. Interestingly, we found that RPMI 8226 cells had the highest copy number for the ZKSCAN3-containing region (Supplementary Figure 4B; Supplementary Table 2), which is consistent with our qPCR data. We noticed that our studies supported that these cells had 6 ZKSCAN3 gene copies, while the Mayo Clinic dataset suggested 3.6 copies. This difference may be caused by the larger aCGH region in the Mayo dataset, causing the detection signal to be diluted, while our qPCR probe was designed to specifically detect ZKSCAN3.
Finally, to further evaluate the possibility that ZKSCAN3 sequences may be subject to amplification, interphase FISH studies were performed on primary samples using a nick-translated probe. To validate this probe, RPMI 8226 cells were used as a positive control, and did indeed show three signals (Figure 3C, upper left panel), consistent with the above data aCGH data. Ten consecutive unselected bone marrow aspirate samples from patients with myeloma were then analyzed, eight of which showed the expected two signals (Figure 3C, upper right panel). Two of these, however, showed three signals in 77.3% and 25.7% of 200 interphase nuclei analyzed, respectively (Figure 3C, lower right and left panel). These findings support the possibility that, at least in some cases, ZKSCAN3 overexpression may be due to increased gene copy number through gene amplification and/or gain.
ZKSCAN3 induces cyclin D2 expression
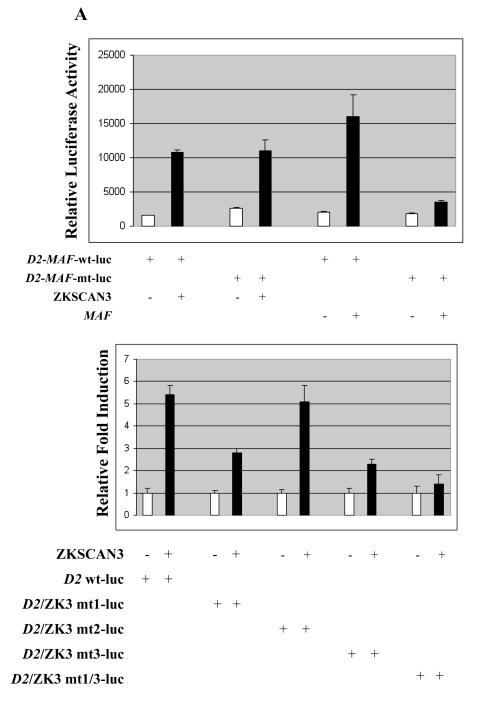
Sequence analysis of the cyclin D2 promoter revealed three putative ZKSCAN3 binding sites named ZK3-RE1, ZK3-RE2, and ZK3-RE3, respectively, conforming to the consensus KRDGGGGNNKDNNT sequence (Supplementary Figure 5A and Figure 5B), suggesting that ZKSCAN3 may regulate cyclin D2 expression. We first examined the impact of ZKSCAN3 expression on the activity of the cyclin D2 promoter. HeLa cells were co-transfected with a vector expressing ZKSCAN3 and a cyclin D2 luciferase reporter construct (D2-luc), in which the promoter had either a wild (wt) type or mutant (mt) MAF binding site. MAF cDNA used as a positive control did induce substantial activity of the D2-MAF-wt-luc construct, while the D2-MAF-mt-luc construct showed minimal induction (Figure 4A upper panel). ZKSCAN3 cDNA activated transcription from the cyclin D2 promoter with a mutant MAF site by approximately 6-fold (Figure 4A upper panel). Notably, a comparable extent of activation was seen in the wild-type construct, suggesting that ZKSCAN3 transactivated the cyclin D2 promoter in a MAF/MAFB-independent manner. Since three putative ZKSCAN3 responsive elements (ZK3-RE1, ZK3-RE2, and ZK3-RE3) were found on the cyclin D2 promoter (Supplementary Figure 5A and 5B), we generated three mutant cyclin D2-luc constructs, in which each ZKSCAN3 binding core GGGG sequence was replaced with ATAT (Supplementary Figure 5B). HeLa cells were co-transfected with ZKSCAN3 cDNA and ZKSCAN3 binding site mutant reporters (D2-mt1-luc, D2-mt2-luc, and D2-mt3-luc, respectively). Interestingly, we observed that addition of ZKSCAN3 activated D2-mt1-luc and D2-mt3-luc to a lesser extent than D2-mt2-luc (Figure 4A, lower panel). Also, a double mutant reporter in which ZK3-RE1 and ZK3-RE3 were simultaneously mutated showed little induction by ZKSCAN3 (Figure 4A, lower panel), suggesting that ZK3-RE1 and ZK3-RE3 are required for cyclin D2 transactivation.
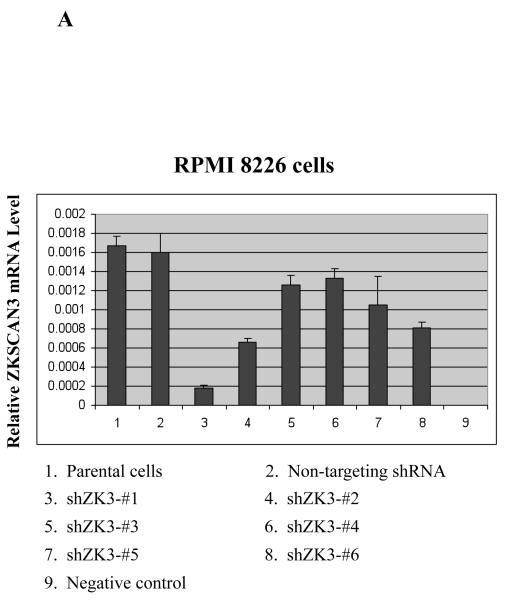
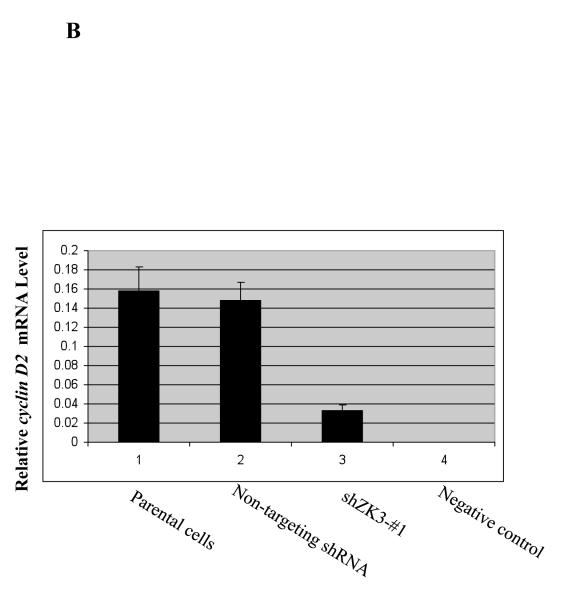
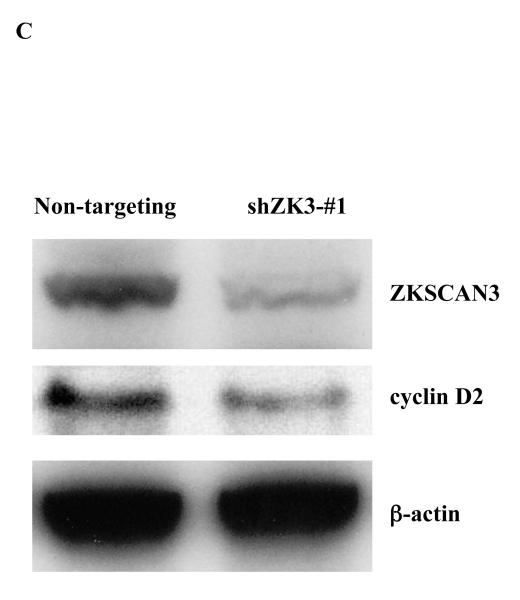
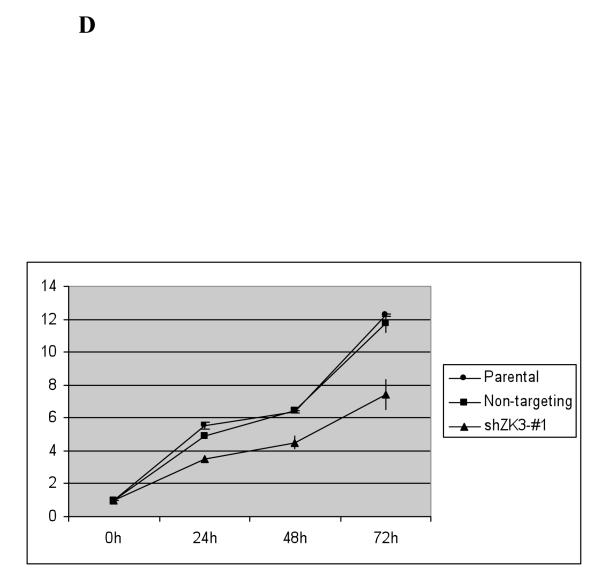
Figure 5.
Suppression of ZKSCAN3 reduces cyclin D2 and myeloma proliferation.
(a) RPMI 8226 cells were infected with Lentiviral particles containing either a control shRNA construct (Non-targeting shRNA), or one of six ZKSCAN3 shRNAs designed using the Dharmacon Custom siRNA Design Tool. Transduced cells were sorted for GFP positivity, and ZKSCAN3 mRNA levels were then determined by qPCR. These are expressed as the mean plus or minus the standard deviation from three experiments, with mock-treated parental RPMI 8226 cells, and GAPDH used as controls.
(b) Expression levels of cyclin D2 mRNA were determined in the above cells by qPCR, and were normalized and expressed as indicated.
(c) cyclin D2 and ZKSCAN3 protein levels were evaluated in RPMI 8226 cells infected as above with either non-targeting Lentiviral particles, or particles inducing expression of shZK3-#1.
(d) Proliferation of RPMI 8226 cells infected with the above Lentiviral particles was evaluated every 24 hours over four time points using the tetrazolium salt WST-1. The mean absorbance at each time point is indicated in comparison with media only controls plus or minus the standard deviation from triplicate experiments.
(e) Cell cycle profiles were obtained in RPMI 8226 cells transduced with either shZK3-#1 or shNon-trageting controls, by staining with propidium iodide followed by FACS analysis. A total of 20,000 events were collected from each of three replicate experiments, and differences in cell cycle distribution determine using FlowJo software (Tree Star, Inc., Ashland, OR) were compared using the student’s t-test.
Figure 4.
ZKSCAN3 regulates cyclin D2 expression.
(a) A luciferase reporter construct (100 ng) containing the cyclin D2 promoter, and either a wild type MAF/MAFB (D2-MAF-wt-luc) or mutated MAF/MAFB binding motif (D2-MAF-mt-luc), were co-transfected into HeLa cells with a vector containing ZKSCAN3, or a control vector, as indicated, in the upper panel. Twenty-four hours later, cells were evaluated for luciferase activity, and relative activity is expressed as the mean plus or minus the standard deviation from three experiments after normalization to a pRL-TK internal control. In the lower panel, assays were performed as above with either wild-type D2-luc, or with reporters in which one or more ZKSCAN3 binding sites were mutated, as indicated.
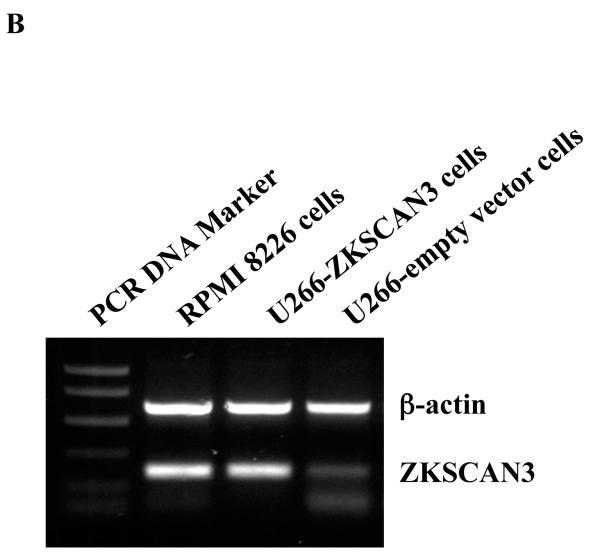
(b) pIRES2-EGFP-ZKSCAN3 was transfected into U266 cells, and ZKSCAN3 expression was evaluated by RT-PCR, with RPMI 8226 cells used as positive controls.
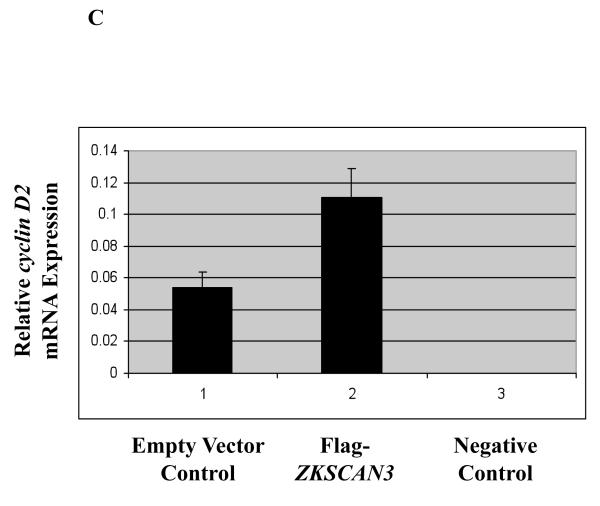
(c) cyclin D2 mRNA expression was determined by qPCR in U266 cells overexpressing ZKSCAN3.
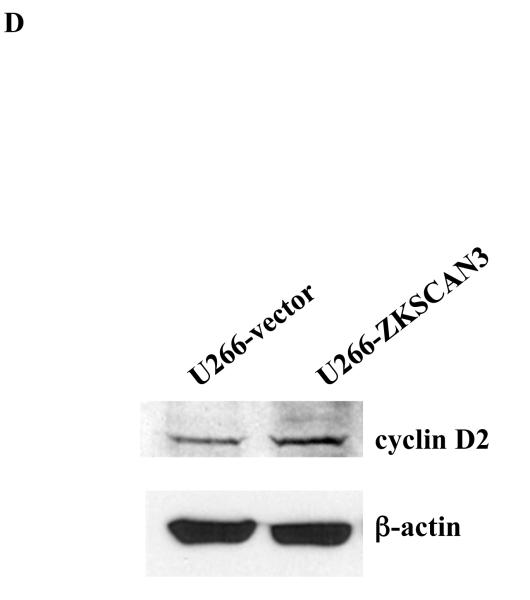
(d) Cyclin D2 protein expression was determined by western-blotting in U266 cells overexpressing ZKSCAN3.
In order to determine if cyclin D2 protein was also induced by ZKSCAN3, we reanalyzed the previously used tissue microarray slides, and a strong concordance was seen in all ten samples studied between cyclin D2 and ZKSCAN3. Patients whose disease strongly expressed ZKSCAN3 also contained high levels of cyclin D2 (Figure 2B, upper panels), while patients who had myeloma that did not express ZKSCAN3 had low immunoreactivity with anti-cyclin D2 antibodies (Figure 2B, lower panel). To more directly demonstrate that ZKSCAN3 induced cyclin D2, U266 cells, which have minimal basal ZKSCAN3 levels (Figure 1A, 1B), were transfected with ZKSCAN3 cDNA (Figure 4B). Overexpression of ZKSCAN3 in U266 cells led to increased cyclin D2 mRNA (Figure 4C) and protein expression (Figure 4D). Further confirmation that ZKSCAN3-induced cyclin D2 expression is dependent on its DNA binding capability was obtained by generating a ZKSCAN3 cDNA mutant construct (ZKSCAN3-del), in which a stop codon was introduced between the KRAB and the first zinc finger motifs, resulting in a truncated ZKSCAN3 protein with a molecular weight of ~32 kDa (Supplementary Figure 6A). Full length and truncated ZKSCAN3 cDNAs were transfected into U266 cell by electroporation, and protein expression was verified by Western blotting (Supplementary Figure 6B). Cyclin D2 mRNA expression was then detected by qPCR and, as expected, ZKSCAN3-del failed to induce cyclin D2 mRNA (Supplementary Figure 6C).
The importance of ZKSCAN3 in cyclin D2 expression was next studied by suppressing ZKSCAN3 through infection of RPMI 8226 and KAS-6/1 cells with Lentiviral shRNA constructs. Among a panel of four different commercially available hairpins, only one shRNA construct gave consistent ZKSCAN3 knockdown by up to 50-55% (Supplementary Figure 7A). Notably, cells transfected with this shRNA also showed suppression of cyclin D2 messenger levels (Supplementary Figure 7B). However, the modest level of ZKSCAN3 knockdown led us to suspect the possibility that this shRNA may have off-target, or non-specific effects. Thus, we designed six new shRNA sequences using the Dharmacon Custom siRNA Design Tool, and generated the corresponding Lentiviral particles. Transduced RPMI 8226 cells were then examined for ZKSCAN3 expression by qPCR and, notably, one shRNA construct (shZK3-#1) showed ~ 90% knockdown efficiency (Figure 5A, lane 3), which was confirmed in KAS-6/1 cells as well (Supplementary Figure 7C). These shZK3-#1 cells were then analyzed for cyclin D2 expression, and we consistently found significantly decreased cyclin D2 mRNA expression in the RPMI 8226 (Figure 5B) and KAS-6/1 (Supplementary Figure 7D) knockdown cells. In contrast, control shRNAs, or parental cells without shRNA transduction that did not reduce ZKSCAN3 expression, left cyclin D2 unaffected. Western blot analysis showed a corresponding decrease in expression of both ZKSCAN3 and cyclin D2 proteins in RPMI 8226 cells (Figure 5C). Together, these findings support a specific role for ZKSCAN3 in regulating cyclin D2 expression.
Proliferation of myeloma cells after infection with ZKSCAN3-targeting shRNAs was then evaluated. RPMI 8226 cells infected with non-targeting controls grew comparably to parental cells (Figure 5D). In contrast, cells infected with shZK3-#1, which reduced ZKSCAN3 (Figure 5A) and cyclin D2 (Figure 5B) expression, reduced proliferation (Figure 5D). Notably, shZK3-#1 also led to growth retardation of KAS-6/1 cells (Supplementary Figure 7E). Since shRNAs can be prone to off-target effects, we transduced ANBL-6 cells with shZK3-#1 to detect if this shRNA had any off-site effects. Compared to RPMI 8226 cells, ANBL-6 transduced with shZK3-#1 did not show growth rate differences compared to non-targeting shRNA-transduced ANBL-6 cells (data not shown). To better understand the mechanism of myeloma cell growth retardation by shZK3-#1, cell cycle analysis was performed in RPMI 8226 cells transduced with shZK3-#1, and shNon-trageting controls, respectively, and stained with propidium iodide. Compared to non-targeting shRNA transduced RPMI 8226 cells, shZK3-#1-transduced RPMI 8226 cells displayed significant increases in the G1 population (Figure 5E), but decreases in the S and G2 phase populations, further supporting the role of shZK3-#1 in inhibiting cell proliferation.
Direct binding of ZKSCAN3 to the cyclin D2 promoter
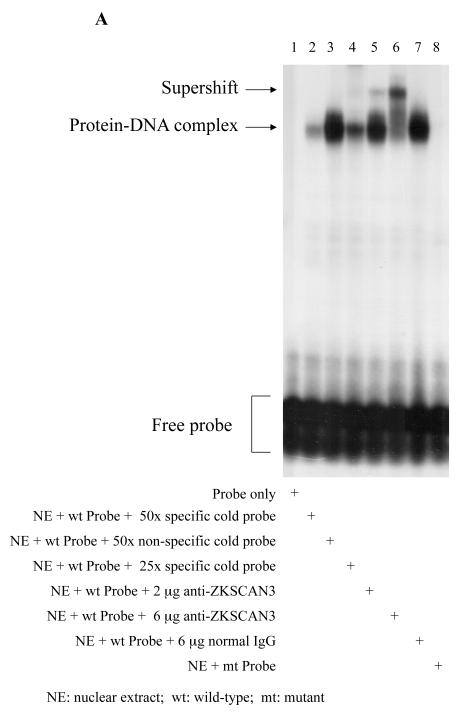
If cyclin D2 is a bona fide direct ZKSCAN3 target, then the cyclin D2 regulatory region bearing the DNA motif identified by CAST-ing should be bound by ZKSCAN3. Nuclear extracts from RPMI 8226 cells were therefore prepared and evaluated for their ability to bind an oligonucleotide spanning the most proximal putative binding site. In an electrophoretic mobility shift assay, a protein-DNA complex was detectable when the ZKSCAN3-specific probe was used (Figure 6A, lane 3 & 7). This was not the case when a mutant oligonucleotide, in which the core ZKSCAN3 binding sequence was changed, was used (Figure 6A, lane 8). Addition of anti-ZKSCAN3 antibodies produced a super-shifted signal (Figure 6A, lane 5 & 6), which was not the case when pre-immune IgG was added (Figure 6A, lane 7). Formation of the ZKSCAN3-DNA complex was reduced by an excess of cold probe competitor (Figure 6A, lane 2 & 4), but not with an unrelated competitor (Figure 6A, lane 3).
Figure 6.
ZKSCAN3 binds directly to the cyclin D2 promoter. (a) Electrophoretic mobility shift assays were performed using the labeled specific oligonucleotide probe (lanes 1-7), or a mutant probe (lane 8), to which were added RPMI 8226 nuclear extracts in binding buffer (lanes 2-8) or binding buffer alone (lane 1). Lanes 2 and 4 contained 50x and 25x unlabeled specific competitor oligonucleotide, respectively, while lane 3 contained a 50x non-specific competitor oligonucleotide. Lane 7 contained 6 μg of pre-immune IgG, while lanes 5 and 6 contained 2 and 6 μg of anti-ZKSCAN3 antibody, respectively.
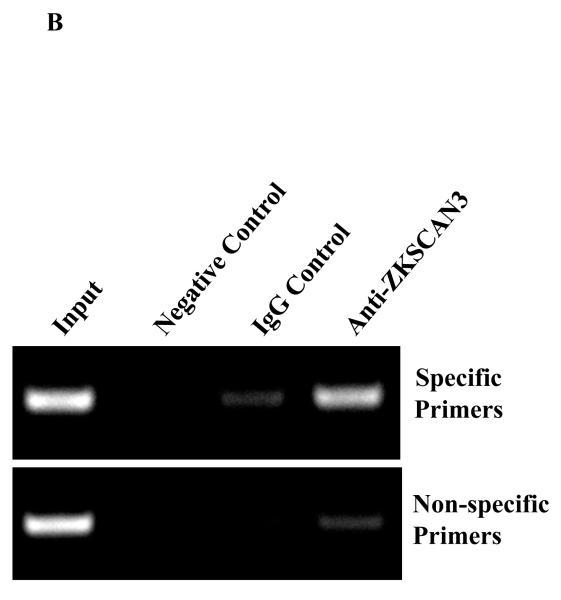
(b) Chromatin immunoprecipitation was performed using chromatin from RPMI 8226 cells and 2.5 μg of either the anti-ZKSCAN3 antibody, or an equivalent amount of pre-immune IgG. The primers used were indicated in the “Methods” section, while their location is diagramed in Supplementary Figure 5A. Each lane was loaded with nucleic acid input representing 10% of the total reaction mixture, while the negative control lacked chromatin input.
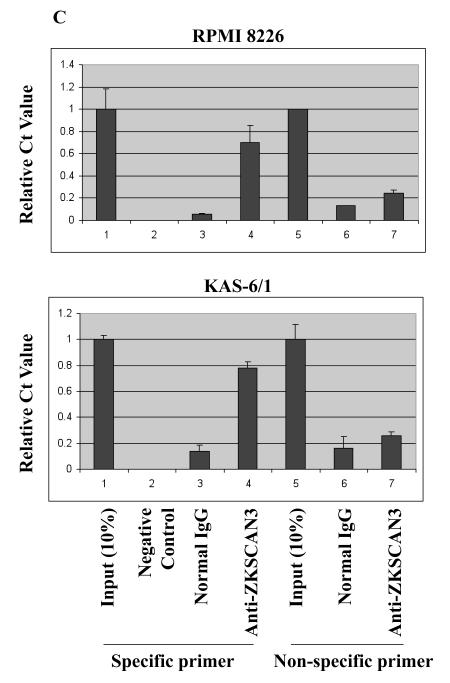
(c) Chromatin immunoprecipitation of RPMI 8226 and KAS-6/1 cells was performed and evaluated using primers either spanning the cyclin D2 ZKSCAN3 binding sites (specific primers), or distant from the motif (nonspecific primers). Ct values are shown relative to that achieved with 10% input for each primer set, with data representing the average plus or minus the range of duplicate experiments. Negative controls lacked chromatin input.
In order to evaluate binding of ZKSCAN3 to the endogenous cyclin D2 promoter, chromatin immunoprecipitation assays were performed with chromatin prepared from KAS-6/1 and RPMI 8226 cells, and both specific and non-specific primers (Supplementary Figure 5A). Anti-ZKSCAN3 antibodies preferentially precipitated RPMI 8226 sequences that were amplified with the specific primers (Figure 6B), in comparison to the non-specific primers. Antibodies to ZKSCAN3 enriched chromatin spanning the DNA-binding motif more than 12 and 5-fold, respectively, over that achieved with normal IgG (Figure 6C, specific primers), whereas the corresponding enrichment with primers distant from the ZKSCAN3 sites was modest (less than 2-fold; Figure 6C, non-specific primers). Together, these studies support the conclusion that the cyclin D2 promoter is indeed a direct ZKSCAN3 target.
Discussion
In this work, we report that the novel zinc-finger transcription factor ZKSCAN3 is overexpressed in a significant proportion of myeloma cell lines and primary patient samples (Figures 1, 2; Supplementary Figures 1, 2), directly binds to and activates the cyclin D2 promoter (Figure 6), and induces cyclin D2 expression (Figure 4). Thus, activation of ZKSCAN3 could represent one previously uncharacterized pathway utilized by myelomatous cells to induce cyclin D2. Indeed, our reporter assay implied that ZKSCAN3 activated cyclin D2 expression in a MAF/MAFB-independent manner (Figure 4). However, further studies will be needed of the impact of MAF/MAFB knockdown in cells overexpressing ZKSCAN3 to allow this conclusion to be made more firmly. Another unresolved question is whether ZKSCAN3-mediated cyclin D2 expression is a common phenomenon in myeloma patients, or if it is found in only a subset of cases. Also, ZKSCAN3 expression was verified in a limited panel of patient samples that did not allow for correlation with specific myeloma cytogenetic subtypes, and such studies will need to be performed in a prospective fashion using a large sample size to further define ZKSCAN3 expression. Nonetheless, taken together, our data allow us to conclude that ZKSCAN3 regulates cyclin D2 expression in at least a subset of myeloma cases.
The mechanism of ZKSCAN3 activation is another area for further investigation, since our initial studies suggested a contribution from gene copy number to the expression levels of this transcription factor in at least some cases. RPMI 8226 cells, for example, harbored six gene copies (Figure 3), which could in part be a dosage effect since this line is known to harbor a trisomy 6, as well as several other complex aberrations involving chromosome 6. Similarly, one of eight primary samples showed an especially large ZKSCAN3 gene copy number (Figure 3), while others showed elevations, though to lower levels. Trisomy of chromosome 6 has been reported in myeloma (Ferti et al., 1984), and by FISH analysis may be present in up to 27% or more of patients (Perez-Simon et al., 1998). Thus, in both cell lines and patient samples, one mechanism for ZKSCAN3 induction may be through trisomy 6 or other mechanisms, such as possibly amplification, to increase gene copy number. Indeed, gene copy number analysis with the Multiple Myeloma Genomics Portal datasets indicated the presence of amplification or gain of the ZKSCAN3 gene in a substantial proportion of patient samples (Supplementary Figure 4A). Notably, other studies of cell lines and primary patient samples by aCGH have also revealed a gain of sequences in the 6p region in general (Carrasco et al., 2006; Gutierrez et al., 2004), and at 6p22.1-25.3 in particular (Largo et al., 2007). These data suggest that trisomy 6 may not be the key factor contributing to ZKSCAN3 gene copy number increases. Meanwhile, we also noticed that ZKSCAN3 expression was seen in KAS-6/1 at levels comparable to those seen in RPMI 8226 cells (Figure 1), but without an increased gene copy number (Figure 3). One mechanism may be through translocation of ZKSCAN3 at its 6p22.1 locus along with cyclin D3 at 6p21.1 near an immunoglobulin enhancer that could dysregulate both, but KAS-6/1 cells do not harbor this translocation, and do not express cyclin D3 (Arora and Jelinek, 1998). Thus, other mechanisms beyond gene copy number increase and/or translocations must be available to myeloma cells to induce ZKSCAN3 expression.
It is conceivable that cyclin D2 is not the only target gene for ZKSCAN3 in myeloma, especially in light of our previous studies showing that vascular endothelial growth factor (VEGF) is a target of ZKSCAN3 in colon cancer (Yang et al., 2008a; Yang et al., 2008b). A variety of studies have shown a critical role for angiogenesis in general, and VEGF in particular, in myeloma. For example, increased bone marrow microvessel density has been correlated clinically with disease progression and poor prognosis, and VEGF also exerts direct effects on myeloma cell migration, proliferation, survival, and drug resistance (Kumar et al., 2003; Le Gouill et al., 2004; Markovic et al., 2008; Podar et al., 2001; Ria et al., 2004; Yang et al., 2008b). Additional studies are underway to evaluate the role of ZKSCAN3 in VEGF induction in myeloma, to verify whether ZKSCAN3-mediated cyclin D2 expression occurs in a MAF/MAFB-dependent/independent manner, and also to fully evaluate the role of this novel gene in myeloma pathogenesis through appropriate animal models.
Supplementary Material
Supplementary Figure 1. ECgene analysis characterizes ZKSCAN3 expressed sequence tag expression.
Supplementary Figure 2. Tissue microarrays document expression of ZKSCAN3.
Tissue microarray slides ((a) BM482 and (b) T291 from US Biomax) containing samples from control patients, as well as from patients with multiple myeloma, were subjected to immunohistochemistry for ZKSCAN3.
Supplementary Figure 3. Unbiased cDNA microarray analysis of ZKSACN3 gene expression in myeloma patient samples.
(a) Schematic of the positions of Affymetrix probe sets directed at the ZKSCAN3 gene.
(b) Oncomine dataset analysis indicated that ZKSCAN3 mRNA was expressed in the majority of myeloma primary samples. Note that the most stringent criteria were applied to determine ZKSCAN3 overexpression, in which only the dataset from the top 1% rank of ZKSCAN3 gene expression and p-value ≤1x10⁻⁸ were selected. The digitals on the Y-axis represented normalized expression units. According to Oncomine’s interpretation, cDNA data are typically collected as background-subtracted ratios between the experimental channel and the common reference channel.
Supplementary Figure 4. aCGH analysis for the 6p22.1-containing region identifies increased ZKSCAN3 copy number.
(a) An analysis was performed of ZKSCAN3 gene copy number using the aCGH dataset of the Multiple Myeloma Research Consortium, which provided copy number profiles of 62 primary samples. Four patients showed decreased ZKSCAN3 gene copy number, and 36 of them had increased ZKSCAN3 gene copy number. Please refer to the Supplementary Methods section for details about how gene copy number increase and decrease were determined using a density plot analysis.
(b) Regions from the aCGH dataset of the Mayo Clinic multiple myeloma cell line panel (N=47) containing 6p22.1 were analyzed to determine the ZKSCAN3 copy number.
Supplementary Figure 5. Schematic of the cyclin D2 proximal promoter.
(a) Three solid spindles indicate putative ZKSCAN3 binding sites. ChIP amplicons were also displayed by Specific and Non-Specific Primers.
(b) Mutagenesis of ZKSCAN3 binding sites on the cyclin D2 promoter was performed by replacing the GGGG/CCCC core sequence with TATA.
Supplementary Figure 6. A ZKSCAN3 deletion mutant without the zinc finger DNA binding motifs cannot transactivate cyclin D2.
(a) Schematic of the ZKSCAN3 gene deletion mutation. The underlined TAA indicates the stop codon which was introduced between the KRAB domain and Zinc finger motifs.
(b) Expression of the zinc finger motif-deleted ZKSCAN3 protein was determined by Western-blotting.
(c) The mutated ZKSCAN3 protein without zinc finger motifs loses its ability to transactivate cyclin D2 mRNA expression, as determined by qPCR.
Supplementary Figure 7. Suppression of ZKSCAN3 reduces cyclin D2 expression and myeloma proliferation.
(a) RPMI 8226 (upper panel) and KAS-6/1 (lower panel) cells were infected with Lentiviral particles containing either a control shRNA construct, or one of four shRNAs that could target ZKSCAN3. After selection for three weeks in puromycin, ZKSCAN3 mRNA levels were determined by qPCR, and are expressed as the mean plus or minus the standard deviation from three experiments with GAPDH used as an internal control. “*” indicates a significant decrease compared to the non-targeting control, with significance being considered a p value of <0.05 for comparisons with the student’s t-test.
(b) Expression levels of cyclin D2 mRNA were determined in the above cells by qPCR, and were normalized and expressed as indicated.
(c) KAS-6/1 cells were infected with Lentiviral particles containing either a control shRNA construct (Non-targeting shRNA), or shZK3-#1. After the transduced cells were sorted for GFP-positive cells, ZKSCAN3 mRNA levels were determined by qPCR, and are expressed as the mean plus or minus the standard deviation from three experiments, with GAPDH used as an internal control. Parental KAS-6/1 cells were used as control cells as well.
(d) Expression levels of cyclin D2 mRNA were determined in the above cells by qPCR, and were normalized and expressed as indicated.
(e) Proliferation of KAS-6/1 cells infected with the above Lentiviral particles was evaluated every 24 hours over four time points using the tetrazolium salt WST-1. The mean absorbance at each time point is indicated in comparison with media only controls plus or minus the standard deviation from triplicate experiments.
Supplementary Table 1. ZKSCAN3 gene copy number data from the Mayo Clinic patient Agilent aCGH dataset.
Supplementary Table 2. Copy number data for the 6p22.1-containing region from the Mayo Clinic multiple myeloma cell line Agilent aCGH dataset.
Acknowledgements
The authors wish to thank Dr. Douglas Boyd for his contributions to the studies of the role of ZKSCAN3 in colon cancer. R.Z.O., a Leukemia & Lymphoma Society Scholar in Clinical Research, would like to acknowledge support from the Leukemia & Lymphoma Society (6096-07), and the National Cancer Institute (R01 CA102278).
Footnotes
Authorship L.Y. designed and performed the research presented herein, and wrote the manuscript. H.W. aided in performing Lentiviral experiments. S.K., D.A.G., J.A.M., M.W., D.M.W., S.K.T., and J.J.S. were involved in patient sample acquisition, including in the consenting of patients, and later purification and storage of their plasma cells. N.Z., L.Z., S.Y.Y., and K.A.B. performed bioinformatics analyses, while G.L., M.Z., and R.M. performed FISH studies. R.Z.O. supervised the design and performance of all of the research contained herein, and contributed to the writing and editing of the manuscript.
Conflicts of Interest None of the authors have any conflicts of interest relevant to the current submission to report.
References
- Arora T, Jelinek DF. Differential myeloma cell responsiveness to interferon-alpha correlates with differential induction of p19(INK4d) and cyclin D2 expression. J Biol Chem. 1998;273:11799–805. doi: 10.1074/jbc.273.19.11799. [DOI] [PubMed] [Google Scholar]
- Bergsagel PL, Kuehl WM. Molecular pathogenesis and a consequent classification of multiple myeloma. J Clin Oncol. 2005;23:6333–8. doi: 10.1200/JCO.2005.05.021. [DOI] [PubMed] [Google Scholar]
- Bergsagel PL, Kuehl WM, Zhan F, Sawyer J, Barlogie B, Shaughnessy J., Jr. Cyclin D dysregulation: an early and unifying pathogenic event in multiple myeloma. Blood. 2005;106:296–303. doi: 10.1182/blood-2005-01-0034. [DOI] [PMC free article] [PubMed] [Google Scholar]
- Carrasco DR, Tonon G, Huang Y, Zhang Y, Sinha R, Feng B, et al. High-resolution genomic profiles define distinct clinico-pathogenetic subgroups of multiple myeloma patients. Cancer Cell. 2006;9:313–25. doi: 10.1016/j.ccr.2006.03.019. [DOI] [PubMed] [Google Scholar]
- Chang H, Qi X, Trieu Y, Xu W, Reader JC, Ning Y, et al. Multiple myeloma patients with CKS1B gene amplification have a shorter progression-free survival post-autologous stem cell transplantation. Br J Haematol. 2006;135:486–91. doi: 10.1111/j.1365-2141.2006.06325.x. [DOI] [PubMed] [Google Scholar]
- Chesi M, Bergsagel PL, Brents LA, Smith CM, Gerhard DS, Kuehl WM. Dysregulation of cyclin D1 by translocation into an IgH gamma switch region in two multiple myeloma cell lines. Blood. 1996;88:674–81. [PubMed] [Google Scholar]
- Chesi M, Bergsagel PL, Shonukan OO, Martelli ML, Brents LA, Chen T, et al. Frequent dysregulation of the c-maf proto-oncogene at 16q23 by translocation to an Ig locus in multiple myeloma. Blood. 1998a;91:4457–63. [PubMed] [Google Scholar]
- Chesi M, Nardini E, Brents LA, Schrock E, Ried T, Kuehl WM, et al. Frequent translocation t(4;14)(p16.3;q32.3) in multiple myeloma is associated with increased expression and activating mutations of fibroblast growth factor receptor 3. Nat Genet. 1997;16:260–4. doi: 10.1038/ng0797-260. [DOI] [PMC free article] [PubMed] [Google Scholar]
- Chesi M, Nardini E, Lim RS, Smith KD, Kuehl WM, Bergsagel PL. The t(4;14) translocation in myeloma dysregulates both FGFR3 and a novel gene, MMSET, resulting in IgH/MMSET hybrid transcripts. Blood. 1998b;92:3025–34. [PubMed] [Google Scholar]
- Ferti A, Panani A, Arapakis G, Raptis S. Cytogenetic study in multiple myeloma. Cancer Genet Cytogenet. 1984;12:247–53. doi: 10.1016/0165-4608(84)90036-0. [DOI] [PubMed] [Google Scholar]
- Gabrea A, Bergsagel PL, Chesi M, Shou Y, Kuehl WM. Insertion of excised IgH switch sequences causes overexpression of cyclin D1 in a myeloma tumor cell. Mol Cell. 1999;3:119–23. doi: 10.1016/s1097-2765(00)80180-x. [DOI] [PubMed] [Google Scholar]
- Gutierrez NC, Garcia JL, Hernandez JM, Lumbreras E, Castellanos M, Rasillo A, et al. Prognostic and biologic significance of chromosomal imbalances assessed by comparative genomic hybridization in multiple myeloma. Blood. 2004;104:2661–6. doi: 10.1182/blood-2004-04-1319. [DOI] [PubMed] [Google Scholar]
- Hideshima T, Mitsiades C, Tonon G, Richardson PG, Anderson KC. Understanding multiple myeloma pathogenesis in the bone marrow to identify new therapeutic targets. Nat Rev Cancer. 2007;7:585–98. doi: 10.1038/nrc2189. [DOI] [PubMed] [Google Scholar]
- Hurt EM, Wiestner A, Rosenwald A, Shaffer AL, Campo E, Grogan T, et al. Overexpression of c-maf is a frequent oncogenic event in multiple myeloma that promotes proliferation and pathological interactions with bone marrow stroma. Cancer Cell. 2004;5:191–9. doi: 10.1016/s1535-6108(04)00019-4. [DOI] [PubMed] [Google Scholar]
- Kuhn DJ, Chen Q, Voorhees PM, Strader JS, Shenk KD, Sun CM, et al. Potent activity of carfilzomib, a novel, irreversible inhibitor of the ubiquitin-proteasome pathway, against preclinical models of multiple myeloma. Blood. 2007;110:3281–90. doi: 10.1182/blood-2007-01-065888. [DOI] [PMC free article] [PubMed] [Google Scholar]
- Kumar S, Witzig TE, Timm M, Haug J, Wellik L, Fonseca R, et al. Expression of VEGF and its receptors by myeloma cells. Leukemia. 2003;17:2025–31. doi: 10.1038/sj.leu.2403084. [DOI] [PubMed] [Google Scholar]
- Kyle RA, Rajkumar SV. Multiple myeloma. Blood. 2008;111:2962–72. doi: 10.1182/blood-2007-10-078022. [DOI] [PMC free article] [PubMed] [Google Scholar]
- Largo C, Saez B, Alvarez S, Suela J, Ferreira B, Blesa D, et al. Multiple myeloma primary cells show a highly rearranged unbalanced genome with amplifications and homozygous deletions irrespective of the presence of immunoglobulin-related chromosome translocations. Haematologica. 2007;92:795–802. doi: 10.3324/haematol.11052. [DOI] [PubMed] [Google Scholar]
- Le Gouill S, Podar K, Amiot M, Hideshima T, Chauhan D, Ishitsuka K, et al. VEGF induces Mcl-1 up-regulation and protects multiple myeloma cells against apoptosis. Blood. 2004;104:2886–92. doi: 10.1182/blood-2004-05-1760. [DOI] [PubMed] [Google Scholar]
- Lu G, Kong Y, Yue C. Genetic and immunophenotypic profile of IGH@ rearrangement detected by fluorescence in situ hybridization in 149 cases of B-cell chronic lymphocytic leukemia. Cancer Genet Cytogenet. 2010;196:56–63. doi: 10.1016/j.cancergencyto.2009.08.021. [DOI] [PubMed] [Google Scholar]
- Markovic O, Marisavljevic D, Cemerikic V, Vidovic A, Perunicic M, Todorovic M, et al. Expression of VEGF and microvessel density in patients with multiple myeloma: clinical and prognostic significance. Med Oncol. 2008;25:451–7. doi: 10.1007/s12032-008-9066-y. [DOI] [PubMed] [Google Scholar]
- Perez-Simon JA, Garcia-Sanz R, Tabernero MD, Almeida J, Gonzalez M, Fernandez-Calvo J, et al. Prognostic value of numerical chromosome aberrations in multiple myeloma: A FISH analysis of 15 different chromosomes. Blood. 1998;91:3366–71. [PubMed] [Google Scholar]
- Podar K, Tai YT, Davies FE, Lentzsch S, Sattler M, Hideshima T, et al. Vascular endothelial growth factor triggers signaling cascades mediating multiple myeloma cell growth and migration. Blood. 2001;98:428–35. doi: 10.1182/blood.v98.2.428. [DOI] [PubMed] [Google Scholar]
- Ria R, Vacca A, Russo F, Cirulli T, Massaia M, Tosi P, et al. A VEGF-dependent autocrine loop mediates proliferation and capillarogenesis in bone marrow endothelial cells of patients with multiple myeloma. Thromb Haemost. 2004;92:1438–45. doi: 10.1160/TH04-06-0334. [DOI] [PubMed] [Google Scholar]
- Santos GC, Zielenska M, Prasad M, Squire JA. Chromosome 6p amplification and cancer progression. J Clin Pathol. 2007;60:1–7. doi: 10.1136/jcp.2005.034389. [DOI] [PMC free article] [PubMed] [Google Scholar]
- Shaughnessy J, Jr., Gabrea A, Qi Y, Brents L, Zhan F, Tian E, et al. Cyclin D3 at 6p21 is dysregulated by recurrent chromosomal translocations to immunoglobulin loci in multiple myeloma. Blood. 2001;98:217–23. doi: 10.1182/blood.v98.1.217. [DOI] [PubMed] [Google Scholar]
- Voorhees PM, Chen Q, Kuhn DJ, Small GW, Hunsucker SA, Strader JS, et al. Inhibition of interleukin-6 signaling with CNTO 328 enhances the activity of bortezomib in preclinical models of multiple myeloma. Clin Cancer Res. 2007;13:6469–78. doi: 10.1158/1078-0432.CCR-07-1293. [DOI] [PubMed] [Google Scholar]
- Yang L, Hamilton SR, Sood A, Kuwai T, Ellis L, Sanguino A, et al. The previously undescribed ZKSCAN3 (ZNF306) is a novel “driver” of colorectal cancer progression. Cancer Res. 2008a;68:4321–30. doi: 10.1158/0008-5472.CAN-08-0407. [DOI] [PubMed] [Google Scholar]
- Yang L, Zhang L, Wu Q, Boyd DD. Unbiased Screening for Transcriptional Targets of ZKSCAN3 Identifies Integrin {beta}4 and Vascular Endothelial Growth Factor as Downstream Targets. J Biol Chem. 2008b;283:35295–304. doi: 10.1074/jbc.M806965200. [DOI] [PMC free article] [PubMed] [Google Scholar]
Associated Data
This section collects any data citations, data availability statements, or supplementary materials included in this article.
Supplementary Materials
Supplementary Figure 1. ECgene analysis characterizes ZKSCAN3 expressed sequence tag expression.
Supplementary Figure 2. Tissue microarrays document expression of ZKSCAN3.
Tissue microarray slides ((a) BM482 and (b) T291 from US Biomax) containing samples from control patients, as well as from patients with multiple myeloma, were subjected to immunohistochemistry for ZKSCAN3.
Supplementary Figure 3. Unbiased cDNA microarray analysis of ZKSACN3 gene expression in myeloma patient samples.
(a) Schematic of the positions of Affymetrix probe sets directed at the ZKSCAN3 gene.
(b) Oncomine dataset analysis indicated that ZKSCAN3 mRNA was expressed in the majority of myeloma primary samples. Note that the most stringent criteria were applied to determine ZKSCAN3 overexpression, in which only the dataset from the top 1% rank of ZKSCAN3 gene expression and p-value ≤1x10⁻⁸ were selected. The digitals on the Y-axis represented normalized expression units. According to Oncomine’s interpretation, cDNA data are typically collected as background-subtracted ratios between the experimental channel and the common reference channel.
Supplementary Figure 4. aCGH analysis for the 6p22.1-containing region identifies increased ZKSCAN3 copy number.
(a) An analysis was performed of ZKSCAN3 gene copy number using the aCGH dataset of the Multiple Myeloma Research Consortium, which provided copy number profiles of 62 primary samples. Four patients showed decreased ZKSCAN3 gene copy number, and 36 of them had increased ZKSCAN3 gene copy number. Please refer to the Supplementary Methods section for details about how gene copy number increase and decrease were determined using a density plot analysis.
(b) Regions from the aCGH dataset of the Mayo Clinic multiple myeloma cell line panel (N=47) containing 6p22.1 were analyzed to determine the ZKSCAN3 copy number.
Supplementary Figure 5. Schematic of the cyclin D2 proximal promoter.
(a) Three solid spindles indicate putative ZKSCAN3 binding sites. ChIP amplicons were also displayed by Specific and Non-Specific Primers.
(b) Mutagenesis of ZKSCAN3 binding sites on the cyclin D2 promoter was performed by replacing the GGGG/CCCC core sequence with TATA.
Supplementary Figure 6. A ZKSCAN3 deletion mutant without the zinc finger DNA binding motifs cannot transactivate cyclin D2.
(a) Schematic of the ZKSCAN3 gene deletion mutation. The underlined TAA indicates the stop codon which was introduced between the KRAB domain and Zinc finger motifs.
(b) Expression of the zinc finger motif-deleted ZKSCAN3 protein was determined by Western-blotting.
(c) The mutated ZKSCAN3 protein without zinc finger motifs loses its ability to transactivate cyclin D2 mRNA expression, as determined by qPCR.
Supplementary Figure 7. Suppression of ZKSCAN3 reduces cyclin D2 expression and myeloma proliferation.
(a) RPMI 8226 (upper panel) and KAS-6/1 (lower panel) cells were infected with Lentiviral particles containing either a control shRNA construct, or one of four shRNAs that could target ZKSCAN3. After selection for three weeks in puromycin, ZKSCAN3 mRNA levels were determined by qPCR, and are expressed as the mean plus or minus the standard deviation from three experiments with GAPDH used as an internal control. “*” indicates a significant decrease compared to the non-targeting control, with significance being considered a p value of <0.05 for comparisons with the student’s t-test.
(b) Expression levels of cyclin D2 mRNA were determined in the above cells by qPCR, and were normalized and expressed as indicated.
(c) KAS-6/1 cells were infected with Lentiviral particles containing either a control shRNA construct (Non-targeting shRNA), or shZK3-#1. After the transduced cells were sorted for GFP-positive cells, ZKSCAN3 mRNA levels were determined by qPCR, and are expressed as the mean plus or minus the standard deviation from three experiments, with GAPDH used as an internal control. Parental KAS-6/1 cells were used as control cells as well.
(d) Expression levels of cyclin D2 mRNA were determined in the above cells by qPCR, and were normalized and expressed as indicated.
(e) Proliferation of KAS-6/1 cells infected with the above Lentiviral particles was evaluated every 24 hours over four time points using the tetrazolium salt WST-1. The mean absorbance at each time point is indicated in comparison with media only controls plus or minus the standard deviation from triplicate experiments.
Supplementary Table 1. ZKSCAN3 gene copy number data from the Mayo Clinic patient Agilent aCGH dataset.
Supplementary Table 2. Copy number data for the 6p22.1-containing region from the Mayo Clinic multiple myeloma cell line Agilent aCGH dataset.


