There is increasing interest in the development of cost-effective, practical, portable, and disposable diagnostic devices suited to on-site detection and analysis applications, which hold great promise for global health care,[1,2] environmental monitoring,[3] water and food safety,[4] as well as medical and threat reductions.[5] Lab-on-a-chip (LOC) devices, which scale single or multiple lab processes down to chip format (millimeters to a few square centimeters in size), facilitated by micro- and nanoscale technologies have attracted significant attention because of their small sample volume requirements and excellent portability.[6] Various LOC devices have been designed and fabricated in the past two decades, most of which involve a lithography-based patterning process on a solid or elastomeric substrate, such as glass or plastic, for a variety of functionalities that include sample preparation,[7] microfluidic mixing,[8] biochemical reactions,[9] and analysis.[10]
Paper has recently re-emerged as a highly promising candidate for LOC substrate material.[11,12] Inexpensive and abundant paper-based biosensors could be more accessible to average users, particularly those in developing countries, where cost and ease of use are among the top priorities.[13] Additionally, as an environmentally friendly material, paper is largely sustainable and disposable, enabling it to stand out amongst its peers as a path to “green” sensors. Paper-based bioanalysis, which started in early 20th century and culminated with the Nobel Prize winning invention of a paper chromatography technique in 1952, has been widely used in our daily lives in devices such as pH paper[14] and pregnancy test strips.[15] These paper-based strip tests are advantageous in cases where only qualitative analysis is needed and simplicity (and low cost) matters most. However, such devices are not sufficiently sensitive to certain biomarkers where a quantitative analysis is desired, as is the case for glucose and protein sensing. Progress on quantitative analysis using paper-based devices has been promising in the past five years due to the new developments in micro- and nanotechnologies. For example, Whitesides and colleagues have successfully developed microfluidics devices with millimeter-sized fluidic channels patterned on a paper.[16,17] By incorporating an imaging component into the system and monitoring the color intensity change induced by the analyte, these devices were able to detect glucose quantitatively.[18] Recently, foldable circuits have been printed on paper substrates with the resolution down to ≈50 µm.[19] Nonetheless, when compared with LOCs fabricated on conventional substrates, paper-based biosensors still need to improve in sensitivity and accuracy, in part due to the difficulty in obtaining high-resolution, small feature sizes (e.g., micrometers or less with sharp edges) on paper substrates where conventional photolithography techniques are difficult to apply.
In this paper, we introduce a paper-based metamaterial (MM) device, which can be potentially utilized for quantitative analysis in biochemical sensing applications. Planar metallic resonators with minimum features of less than 5 µm have been fabricated on paper, using a photoresist-free shadow mask deposition technique. The fabricated paper MM devices show unique electromagnetic (EM) resonant responses at predefined frequencies, which depend on the resonator size (i.e., terahertz frequencies in the current case, where 1 THz = 1012 Hz) and could be utilized as a signature for biochemical sensing applications. Proof-of-concept demonstrations were accomplished by monitoring the resonance shift induced by placing different concentrations of glucose solution on the paper MMs.
EM MMs are subwavelength composites that gain their properties from structure rather than composition. The EM response originates from oscillating electrons in highly conducting metals such as gold or copper supported by a dielectric substrate, which allows for a designed, programmable resonant response.[20] While most paper-based biosensors use colorimetric readout and detect the color or intensity change in the visible range, MMs offer a broader operating range, covering from radiofrequency to optical wavelengths.[21] Split ring resonators (SRRs) are the most commonly used elements to build MM structures and devices. The resonant response of SRRs can be easily understood using a LC circuit model and a SRR can be equivalently regarded as an LC resonator with a resonance frequency of , where the inductance (L) results from the current path of the SRR and the capacitance (C) is determined by the split gap and the dielectric properties of the substrate along with the matter that fills the gap. In this case, paper acts as the dielectric substrate providing both support and a material to sample and embed analytes. Patterning MMs on paper substrates would then offer a platform where the resonance shifts, mainly due to alterations in the SRR capacitance induced by the added analyte,[22] can be utilized for quantitative biochemical sensing applications.
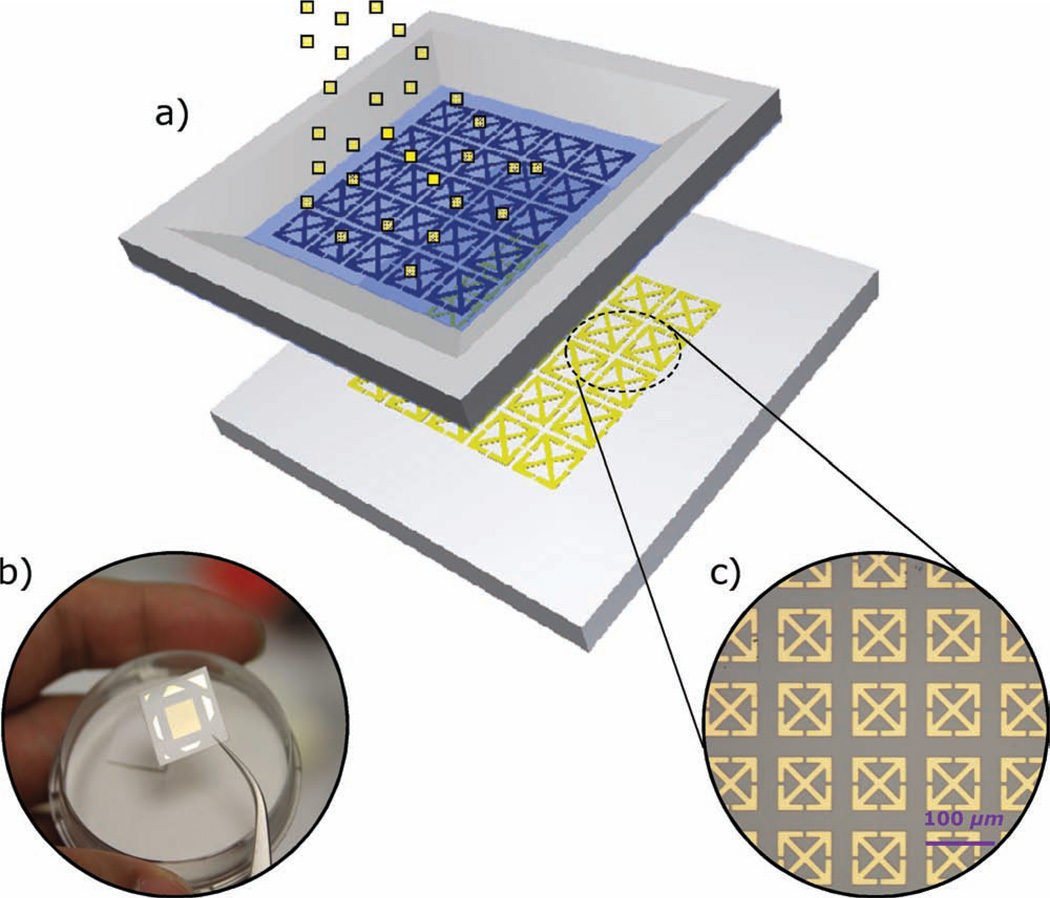
While conventional tests use a strip of paper doped with an antibody specific to an antigen of interest, patterned papers offer more opportunities for multiplexed and quantitative analysis.[23] However, while porosity is a key feature in making paper a favorable material for diagnostic applications, it also makes achieving well-defined patterns with high resolution (e.g., few micrometers) challenging. This is mainly due to the inability to use conventional photolithography-based microfabrication techniques where chemical solutions are generally used. Paper can be easily distorted and degraded during the solvent rinses used in these processes and alternative fabrication techniques are required. A shadow mask patterning fabrication process was therefore used in this work. Patterning is based on selective deposition of a target material (gold in the present case) through a 500-nm-thick silicon nitride (SiNx) film microstencil-based shadow mask. As shown in Figure 1, the micrometer-sized metamaterial structures were deposited directly on the 280-µm-thick paper substrates with predefined microstencils.
Figure 1.
a) Schematic of the micrometer-sized metamaterial resonators sprayed on paper substrates with a predefined microstencil. b) Photograph of a paper-based terahertz metamaterial sample. c) Optical microscopy image of one portion of an as-fabricated paper metamaterial sample.
The microstencils were fabricated using surface micromachining technology. The process consists of three main steps: a) deposition of a SiNx thin film, b) patterning of the SiNx for the SRRs, and c) release of the SiNx thin film from the backside by KOH etching. Details are included in the Supporting Information. After fabrication of the stencils, the entire patterning and deposition process on paper was conducted in a dry, chemical-free environment preventing any possible contamination that might result from residues of the other photolithography-based metal patterning steps (such as lift-off processes and wet etching). The stencils are a few square centimeters in the current case and could be even larger, depending on the quality of the predeposited silicon nitride film. While numerous samples were fabricated, we focus on three of samples with minimum feature sizes of less than 10 µm, including two purely electric resonators (#1, polarization sensitive electric resonator and #2, polarization non-sensitive electric resonator, both with a unit cell size of 100 µm × 100 µm) and the canonical split ring resonators (#3, single SRR with a unit cell size of 50 µm × 50 µm). A 1-mm-wide silicon frame was kept on the edges as the supporting structure for later handling. The microstencils were carefully attached to the paper substrates in contact mode. A thin layer of 150-nm-thick gold was then sprayed on the paper substrates uniformly at a rate of ≈2 Å s−1 using electron beam evaporation. The surface roughness of the paper substrate affects the pattern quality including both the minimum transferable linewidth and sharpness. In this work, photopaper (Epson glossy photopaper, Epson America, Inc.) with a surface roughness (Rq) less than 18 nm was used.
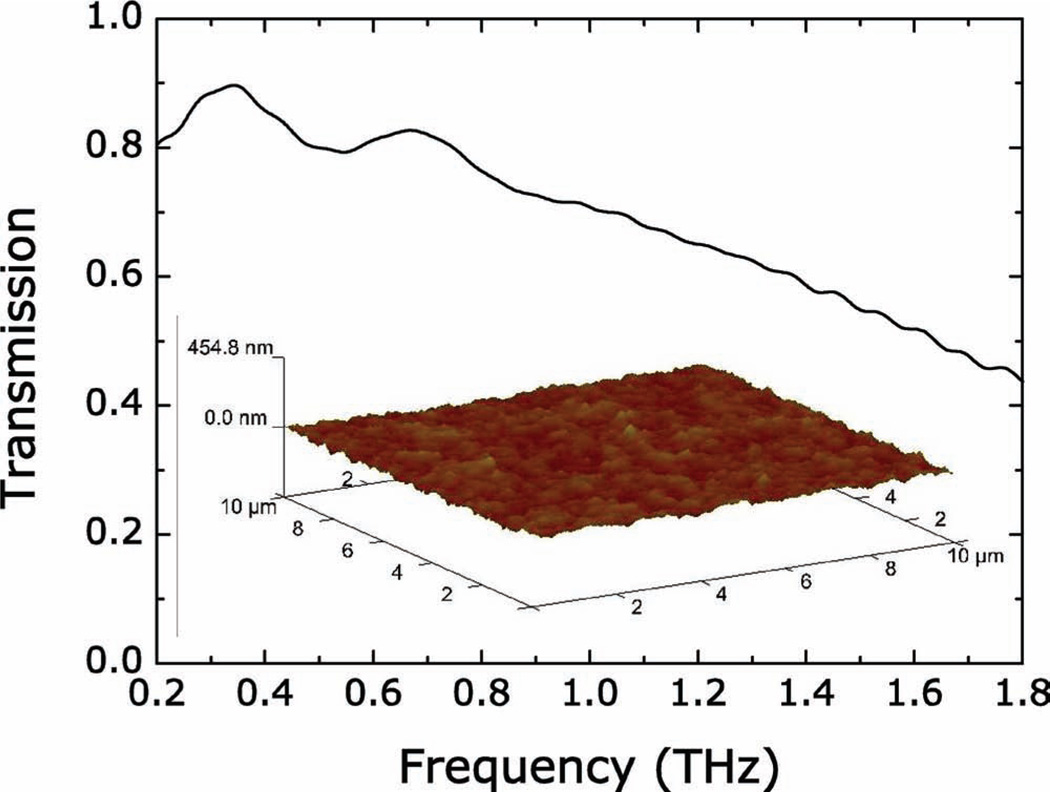
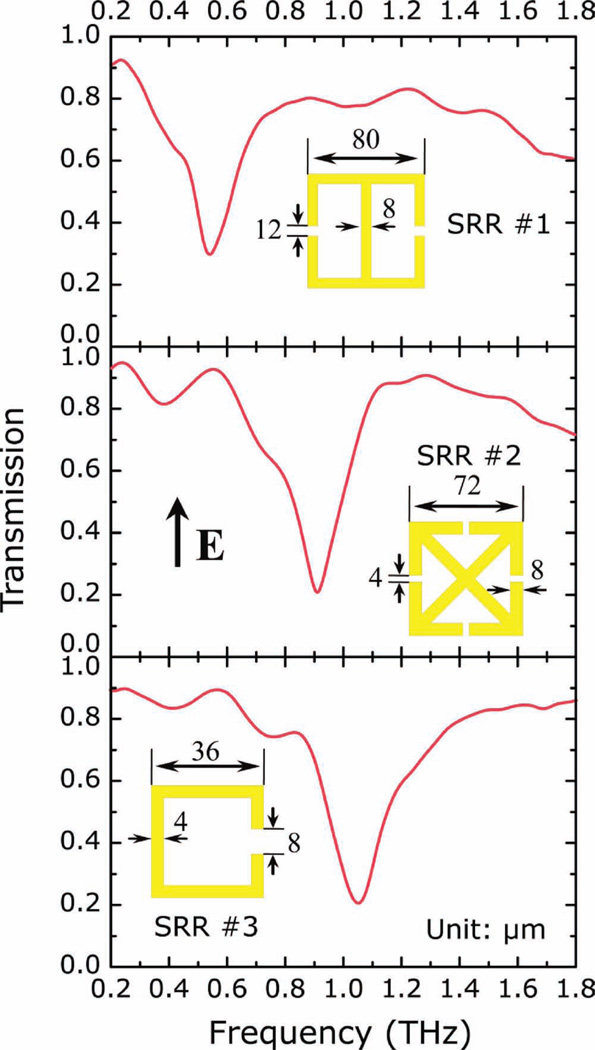
The samples were cut into 1 cm × 1 cm squares and a terahertz time-domain spectroscopy (THz-TDS) was used to characterize the electromagnetic responses. The measurements were performed at room temperature in a dry (<0.1% humidity) air atmosphere. The transmission of the THz electric field was measured for the sample and a reference. The electric field, including both spectral amplitude and phase information, were then calculated through Fourier transformation of the time-domain pulses. The TDS measurements were first carried out on a series of unpatterned paper substrates, and the spectral transmission was obtained by dividing the sample by the reference, which in the present case was simply air. The paper substrates show high field transmission (larger than 45%) of terahertz radiation from 0.2 THz to 1.8 THz, as shown in Figure 2. The samples were then mounted at normal incidence to the THz beam with the electric field perpendicular to the SRR gap and a bare paper substrate was use as the reference. As shown in Figure 3, all three samples display strong resonances, which are comparable to those measured on semiconducting[24] and polymer substrates,[25] at ≈0.55 THz, 0.91 THz, and 1.05 THz, for samples 1, 2, and 3, respectively. These resonances are associated with the LC resonant response that arises from circulating currents driven by the electric field aligned perpendicular to the SRR gap. The resonant response is therefore sensitive to the dielectric property modulation at the metal/dielectric interface where the EM field is largest.
Figure 2.
THz-TDS characterized field transmission of 280-µm-thick pure paper substrates as a function of frequency from 0.2 THz to 1.8 THz. Inset: Atomic force microscopy (AFM) characterized surface roughness of the paper substrate.
Figure 3.
Experimentally measured transmission spectra of the paper metamaterial samples as a function of frequency from 0.2 THz to 1.8 THz. The electric field (E) is aligned perpendicular to the SRR gap. Insets: Designs and dimensions of the SRR elements.
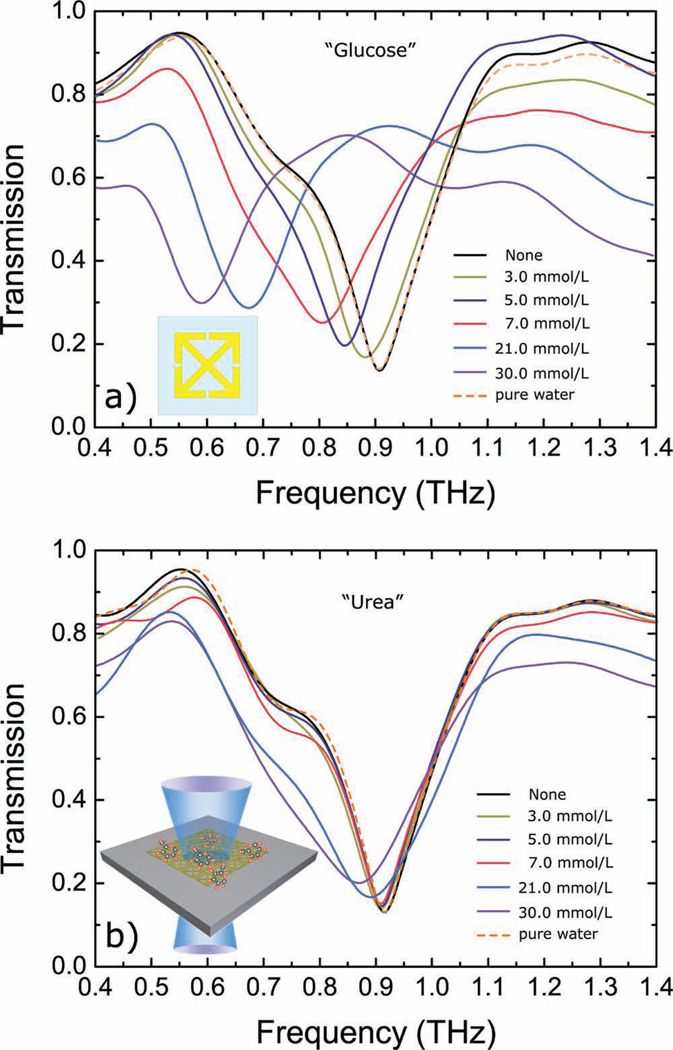
Proof-of-concept demonstrations of the use of paper MM as sensors were performed by coating the paper MMs with glucose solutions with concentrations varying from 3 mmol L−1 (54 mg dL−1, considered to be a low blood glucose level (hypoglycemia)) to 30 mmol L−1 (540 mg dL−1, considered to be severe hyperglycemia). The glucose solutions were prepared by mixing the glucose crystals into distilled water. MM samples with SRR design #2 were used for the sensing experiments. All samples were treated with the silanizing agent tridecafluoro-1,1,2,2-tetrahydrooctyl trichlorosilane (FOTS) prior to measurement to prevent possible perfusion of a small amount of water into the paper substrates during the drying, which could change the dielectric properties and/or the shape of the paper slightly. Glucose solution with a volume of ≈100 µL was deposited on the resonators and allowed to dry in air. The transmission spectra were then measured by THz-TDS as a function of frequency. With higher glucose concentration, the analyte-induced resonance should shift more since the shift is mainly due to alterations in the SRR capacitance and can be calculated by the equation . This was verified by the experimental results, as shown in Figure 4a. A resonance at 908 GHz was observed for the paper MM sample without coating and this value shifted continuously to lower frequencies as the concentration of the glucose solution increased. A maximum shift of ≈300 GHz was observed on the 30 mmol L−1 glucose solution coated sample. A 100 µL solution of pure water was also cast on one paper MM sample and the transmission spectra were measured and compared before and after the coating. No shift was observed, which indicated that the observed shifts on previous samples (from 3 mmol L−1 up to 30 mmol L−1) can be attributed to glucose.
Figure 4.
Experimentally measured transmission spectra of the paper MM samples coated with a series of glucose (a) and urea (b) solutions with varying concentrations as function of frequency from 0.4 THz to 1.4 THz. Insets: Schematics of the as-used SRR element and an illustration of the transmission measurement setup.
For small changes in capacitance dC, the resonance shift dω can be approximated as a linear response that decreases as the amount of analyte increases. In this case, the paper MM has a sensitivity of , defined as the resonance shift (Δf) as a function of glucose concentration variation (Δg). This value is obtained by using the equation for glucose levels up to 7 mmol L−1, and the sensitivity dropped to for glucose levels up to 30 mmol L−1. Given that the minimum possible measurable frequency change for the current experimental configuration is ≈5 GHz, this yields ≈0.35 mmol L−1 of the minimum detectable glucose level (i.e., 6.3% with a base glucose level of 5.5 mmol L−1). Accuracy and sensitivity are paramount at low glucose concentration, where medical effects are more severe. Commercial glucose meters typically require an accuracy of ±1 mmol L−1 for glucose levels under 5.5 mmol L−1 and ±20% for higher glucose values.[26] Additional improvements in the sensitivity of the MM are possible by adopting a variety of strategies employing different SRR geometries, which could be particularly relevant for applications of this technique.
Further, the sensing modality of paper-based MMs reported in this work is based on changes in the capacitance of the SRRs which are mainly determined by the dielectric properties and the thickness and volume of the analyte embedded in the paper structure. Although the sensitivity is appreciable in this single-analyte case, practical applications will be subject to the presence of additional analytes causing interference and a different device response. This effect can be mitigated by training the device and assessing the dielectric response of the SRR to each analyte to aid in signal extraction by signal processing. As a comparison, a series of urea solutions with varying molarities (similar to the glucose concentrations used previously) were prepared and cast on paper metamaterial samples with the same design. As shown in Figure 4b, the transmission spectra were measured by THz-TDS as a function of frequency, showing that the resonance was shifted continuously to lower frequencies as the concentration of the urea solution increased, similar to what was observed in glucose measurements. A maximum shift of ≈40 GHz was observed for a urea solution of 30 mmol L−1. This shift is significantly smaller than its counterpart of glucose solution, (i.e., ≈300 GHz). It is further noted that the physiological concentrations of blood glucose and urea are similar, i.e., ≈3.8 to 5.8 mmol L−1 and ≈3.5 to 6.5 mmol L−1, respectively[27]. The resonant structure presented responds well to the dielectric modulation induced by glucose, whereas it barely identifies different urea solutions, indicating a promising path towards discrimination based on dielectric properties and antenna design. More utility can be added by including a reagent in the substrate (for example glucose oxidase, which is widely used on commercial devices for blood glucose sensing), which favors a chemical reaction more specific to the target analyte. The ensuing chemical reaction will alter the dielectric properties of the material and be transduced by the paper-based MM structure described here. Furthermore, since it is found that coupled resonances can significantly change the overall response to small perturbations to the system, it is possible to design the SRRs to match the resonant frequency of the desired sensing target to further improve sensitivity and selectivity.[28]
Inexpensive paper-based sensing kits already play an important role in ready-to-use diagnostics. The inclusion of easily patterned resonant electromagnetic structures adds versatility to the platform in support of an increasing number of applications. Though paper-based MMs reported in this work were designed to be functional at THz frequencies where many materials such as volatile chemicals and DNA exhibit unique EM fingerprints,[29] they can be readily extended to other regions of the EM spectrum by simply scaling the SRR sizes and utilizing appropriately matched readout systems. In conclusion, we successfully patterned micrometer-sized MM resonators on paper substrates using shadow mask deposition techniques, showing controlled EM responses at THz frequencies. Preliminary results of glucose sensing using paper-based MMs showed sensitivity of with a characterization system associated ability to measure glucose level of ≈0.35 mmol L−1, which can be further improved by optimizing the SRR geometries and the characterization system.
Supplementary Material
Acknowledgements
The authors acknowledge partial support from AFOSR under contract FA9550-09-1-0513, DOD/Army Research Laboratory under Contract No. W911NF-06-2-0040, NSF under Contract No. ECCS 0802036, and DARPA under Contract No. HR0011-08-1-0044 (H.T., L.C., M.L., A.C.S., K.F., X.Z., and R.D.A.). This material is based upon work supported in part by the U.S. Army Research Laboratory and the U.S. Army Research Office under contract number W911 NF-07-1-0618 and by the DARPA-DSO (H.T., M.A.B., S.M.S., D.L.K., and F.G.O.).
Footnotes
Supporting Information
Supporting Information is available from the Wiley Online Library or from the author.
Contributor Information
Hu Tao, Department of Biomedical Engineering Tufts University 4 Colby St, Medford, MA 02155, USA.
Logan R. Chieffo, Department of Physics, Boston University, 590 Commonwealth Ave, Boston, MA 02215, USA
Mark A. Brenckle, Department of Biomedical Engineering Tufts University 4 Colby St, Medford, MA 02155, USA
Sean M. Siebert, Department of Biomedical Engineering Tufts University 4 Colby St, Medford, MA 02155, USA
Mengkun Liu, Department of Physics, Boston University, 590 Commonwealth Ave, Boston, MA 02215, USA.
Andrew C. Strikwerda, Department of Physics, Boston University, 590 Commonwealth Ave, Boston, MA 02215, USA
Kebin Fan, Department of Mechanical Engineering, Boston University, 110 Cummington St., Boston, MA 02215, USA.
David L. Kaplan, Department of Biomedical Engineering Tufts University 4 Colby St, Medford, MA 02155, USA
Xin Zhang, Department of Mechanical Engineering, Boston University, 110 Cummington St., Boston, MA 02215, USA.
Richard D. Averitt, Department of Physics, Boston University, 590 Commonwealth Ave, Boston, MA 02215, USA
Fiorenzo G. Omenetto, Email: fiorenzo.omenetto@tufts.edu, Department of Biomedical Engineering Tufts University 4 Colby St, Medford, MA 02155, USA.
References
- 1.Chin CD, Linder V, Sia SK. Lab Chip. 2007;7:41. doi: 10.1039/b611455e. [DOI] [PubMed] [Google Scholar]
- 2.Yager P, Edwards T, Fu E, Helton K, Nelson K, Tam MR, Weigl BH. Nature. 2006;442:412. doi: 10.1038/nature05064. [DOI] [PubMed] [Google Scholar]
- 3.Gardeniers JGE, Van Den Berg A. Anal. Bioanal. Chem. 2004;378:1700. doi: 10.1007/s00216-003-2435-7. [DOI] [PubMed] [Google Scholar]
- 4.Escarpa A, Gonzalez MC, Crevillen AG, Blasco AJ. Electrophoresis. 2007;28:6. doi: 10.1002/elps.200600412. [DOI] [PubMed] [Google Scholar]
- 5.Lim DV, Simpson JM, Kearns EA, Kramer MF. Clin. Microbiol. 2005;18:583. doi: 10.1128/CMR.18.4.583-607.2005. [DOI] [PMC free article] [PubMed] [Google Scholar]
- 6.Oosterbroek E, Van Den Berg A, editors. Lab-on-a-Chip: Miniaturized Systems for (Bio)chemical Analysis and Synthesis. Amsterdam: Elsevier Science; 2003. [Google Scholar]
- 7.Moon H, Wheeler AR, Garrell RL, Loo JA, Kim CJ. Lab Chip. 2006;6:9. doi: 10.1039/b601954d. [DOI] [PubMed] [Google Scholar]
- 8.Whitesides GM. Nature. 2006;442:7101. doi: 10.1038/nature05058. [DOI] [PubMed] [Google Scholar]
- 9.Chow AW. AIChE J. 2002;48:8. [Google Scholar]
- 10.Figeys D, Pinto D. Anal. Chem. 2000;72:9. doi: 10.1021/ac002800y. [DOI] [PubMed] [Google Scholar]
- 11.Dungchai W, Chailapakul O, Henry CS. Anal. Chem. 2009;81:14. doi: 10.1021/ac9007573. [DOI] [PubMed] [Google Scholar]
- 12.Zhao W, Van Den Berg A. Lab Chip. 2008;8:12. doi: 10.1039/b814043j. [DOI] [PubMed] [Google Scholar]
- 13.Mabey D, Peeling RW, Ustianowski A, Perkins MD. Nat. Rev. 2004;2:231. doi: 10.1038/nrmicro841. [DOI] [PubMed] [Google Scholar]
- 14.Yue F, Ngin TS, Hailin G. Sens. Actuators, B. 1996;32:1. [Google Scholar]
- 15.Macgillivray I, Tovey JE. BJOG. 1957;64:3. doi: 10.1111/j.1471-0528.1957.tb02653.x. [DOI] [PubMed] [Google Scholar]
- 16.Martinez AW, Phillips ST, Butte MJ, Whitesides GM. Angew. Chem. Int. Ed. 2007;46:1318. doi: 10.1002/anie.200603817. [DOI] [PMC free article] [PubMed] [Google Scholar]
- 17.Bruzewicz DA, Reches M, Whitesides GM. Anal. Chem. 2008;80:3387. doi: 10.1021/ac702605a. [DOI] [PMC free article] [PubMed] [Google Scholar]
- 18.Martinez AW, Phillips ST, Carrilho E, Thomas SW, III, Sindi H, Whitesides GM. Anal. Chem. 2008;80:3699. doi: 10.1021/ac800112r. [DOI] [PMC free article] [PubMed] [Google Scholar]
- 19.Siegel AC, Phillips ST, Dickey MD, Lu N, Suo Z, Whitesides GM. Adv. Funct. Mater. 2010;20:28. [Google Scholar]
- 20.Smith DR, Padilla WJ, Vier DC, Nemat-Nasser SC, Schultz S. Phys. Rev. Lett. 2000;84:4184. doi: 10.1103/PhysRevLett.84.4184. [DOI] [PubMed] [Google Scholar]
- 21.Padilla WJ, Basov DN, Smith DR. Mater. Today. 2006;9:28. [Google Scholar]
- 22.O’Hara JF, Singh R, Brener I, Smirnova E, Han J, Taylor AJ, Zhang W. Opt. Express. 2008;16:3. doi: 10.1364/oe.16.001786. [DOI] [PubMed] [Google Scholar]
- 23.Abe K, Suzuki K, Citterio D. Anal. Chem. 2008;80:18. doi: 10.1021/ac800604v. [DOI] [PubMed] [Google Scholar]
- 24.Padilla WJ, Aronsson MT, Highstrete C, Lee M, Taylor AJ, Averitt RD. Phys. Rev. B. 2007;75:041102R. doi: 10.1103/PhysRevLett.96.107401. [DOI] [PubMed] [Google Scholar]
- 25.Tao H, Strikwerda AC, Fan K, Bingham CM, Padilla WJ, Zhang X, Averitt RD. J. Phys. D: Appl. Phys. 2008;41:232004. [Google Scholar]
- 26.Hones J, Muller P, Surridge N. Diabetes Technol. Ther. 2008;10(Supplement 1) [Google Scholar]
- 27.MacKay EM, MacKay LL. J. Clin. Invest. 1927;4:295. doi: 10.1172/JCI100124. [DOI] [PMC free article] [PubMed] [Google Scholar]
- 28.Bingham CM, Tao H, Liu X, Averitt RD, Zhang X, Padilla WJ. Opt. Express. 2008;16:23. doi: 10.1364/oe.16.018565. [DOI] [PubMed] [Google Scholar]
- 29.Barber J, Hooks DE, Funk DJ, Averitt RD, Taylor AJ, Babikov D. J. Phys. Chem. A. 2005;109:3501. doi: 10.1021/jp044384h. [DOI] [PubMed] [Google Scholar]
Associated Data
This section collects any data citations, data availability statements, or supplementary materials included in this article.


