

Abstract
Molecular identification of protein molecules surrounding nanoparticles (NPs) may provide useful information that influences NP clearance, biodistribution, and toxicity. Hence, nanoproteomics provides specific information about the environment that NPs interact with and can therefore report on the changes in protein distribution that occurs during tumorigenesis. Therefore, we hypothesized that characterization and identification of protein molecules that interact with 20 nm AuNPs from cancer and noncancer cells may provide mechanistic insights into the biology of tumor growth and metastasis and identify new therapeutic targets in ovarian cancer. Hence, in the present study, we systematically examined the interaction of the protein molecules with 20 nm AuNPs from cancer and noncancerous cell lysates. Time-resolved proteomic profiles of NP-protein complexes demonstrated electrostatic interaction to be the governing factor in the initial time-points which are dominated by further stabilization interaction at longer time-points as determined by ultraviolet–visible spectroscopy (UV–vis), dynamic light scattering (DLS), ζ-potential measurements, transmission electron microscopy (TEM), and tandem mass spectrometry (MS/MS). Reduction in size, charge, and number of bound proteins were observed as the protein-NP complex stabilized over time. Interestingly, proteins related to mRNA processing were overwhelmingly represented on the NP-protein complex at all times. More importantly, comparative proteomic analyses revealed enrichment of a number of cancer-specific proteins on the AuNP surface. Network analyses of these proteins highlighted important hub nodes that could potentially be targeted for maximal therapeutic advantage in the treatment of ovarian cancer. The importance of this methodology and the biological significance of the network proteins were validated by a functional study of three hubs that exhibited variable connectivity, namely, PPA1, SMNDC1, and PI15. Western blot analysis revealed overexpression of these proteins in ovarian cancer cells when compared to normal cells. Silencing of PPA1, SMNDC1, and PI15 by the siRNA approach significantly inhibited proliferation of ovarian cancer cells and the effect correlated with the connectivity pattern obtained from our network analyses.
Introduction
An inevitable consideration regarding the use of nanoparticles (NPs) for biomedical applications is the formation of a biological complex around the NPs when exposed to biological fluids, cells, and tissues. Nanoparticles, due to the nature of their surface, rapidly adsorb surrounding proteins to form a protein complex, which is composed of two classes of proteins based on their affinity toward the NP surface: a class of high affinity proteins which binds tightly to NPs and a low affinity class whose adsorption is dynamic, and these proteins freely exchange over time.1,2 The recognition of protein complex formation around NPs has led to an emerging concern for the need to distinguish and understand the synthetic vs biological identity of NPs. The acquired biological identity of NPs due to complex formation with biological entities is what cells “see”.3 It is this identity which dictates the long-term NP interactions, alters the physiological response, and determines the fate of NPs including clearance, biodistribution, and toxicity.
Molecular identification of the biological interactome of NPs has been shown to provide critical information about the encounter of NPs with various biological entities during the in vivo journey.4,5 The composition of the interactome is specific to the environment NPs interact with and can therefore report on protein distribution changes that occur during tumorigenesis. In addition, proteomic signatures of the biological interactome can be altered by modifying physicochemical properties of the NPs such as size, surface functionalization, and charge, and also the composition of the core NPs (e.g., inorganic NPs such as gold (Au), silver (Ag), and platinum). The tailoring of the biological interactome by NPs may provide molecular insight into the development of tumor growth and metastasis.6
The formation and characterization of protein corona around various NPs such as gold,7,8 polystryrene,9 silica,10,11 copolymer,12,13 and various other compositions14 has been investigated mainly to understand its role in NP clearance, biodistribution, and toxicity. However, we hypothesize that the sequestration of proteins around the NP surface provides an excellent opportunity to probe these very proteins that are present in the biological milieu and responsible for tumorigenesis. A wide variety of proteomic approaches can be employed to identify the components of the protein corona.15 Hence, we believe that NP surfaces provide a unique platform to sequester, enrich, and identify new therapeutic targets for diseases, an idea that has been evolving recently.16
AuNPs have attracted wide attention in numerous biomedical applications such as imaging, detection, diagnosis, and therapy because of its biocompatibility and ease of synthesis, surface modification, and characterization.17 AuNPs could therefore be used as a model system to understand protein–NP interactions. We had previously conducted a proof-of-concept study to show how modulation of the protein-NP complex by engineered AuNPs (positively and negatively charged AuNPs) could be utilized to identify new therapeutic targets in ovarian cancer.16 We analyzed the protein corona from positively charged AuNP (+AuNP) and negatively charged AuNP (−AuNP) by mass spectroscopy from lysates of normal and ovarian cancer cells at a single time-point of 1 h. Among the proteins identified between cancer and normal ovarian cells, HDGF was identified as one of the unique proteins to +AuNP particles in the corona from ovarian cancer cells. Subsequently, we showed that silencing HDGF by siRNA in ovarian cancer cells affects growth and proliferation. Although differential proteomics was employed in our study to identify cancer specific biomarkers, the true dynamic nature of protein–NP interaction was unexplored and a stringent bioinformatics based network analysis was lacking. Furthermore, since gold has a high affinity to bind to −NH2 and −SH containing functionalities, proteins captured by unmodified AuNP as opposed to surface engineered AuNP might be different in structure as well as in biological function.
Citrate-coated gold nanoparticles have attracted considerable attention recently due to its ability to bind heparin binding growth factors like VEGF and act as anti-angiogenic agents.18 In this context, Tsai and co-workers have reported anti-angiogenic properties of 13 nm AuNPs in a rat model of collagen-induced arthritis.19 Additionally, we recently reported that 20 nm AuNPs possesses unique properties;20 they significantly reduce tumor growth and metastasis by abrogating mitogen-activated protein kinase (MAPK) signaling and reverse epithelial-mesenchymal transition (EMT). AuNPs have also been tested for their toxicity in animal models. It has been observed that smaller nanoparticles of Au (<10 nm) can cause systemic toxicity to distant organs and the toxicity decreases with increase in size of AuNPs.21 Therefore, it is conceivable that molecular understanding of protein–AuNP interaction may provide useful information regarding the biological functions of the nanoparticle including clearance, biodistribution, toxicity, and self-therapeutic property. We hypothesized that those proteins specifically enriched on AuNPs may play critical roles in the development of ovarian tumor growth and metastasis. Hence, identification and characterization of proteins from cancer and noncancer cells around 20 nm AuNPs and understanding their interaction with AuNP may lead to the identification of new therapeutic targets in ovarian cancer, and provide useful information to understand the biology of ovarian tumor growth and metastasis. In this present paper, we investigated in detail the dynamic parameters guiding interactions of 20 nm unmodified AuNPs with protein lysates from cancer and noncancer ovarian cells. We approached the task by first investigating the dynamic and competitive nature of the NP-protein complex formation by UV–visible spectroscopy (UV–vis), dynamic light scattering (DLS), ζ-potential measurements, and transmission electron microscopy (TEM). We then identified the proteins on the NP surface by tandem mass spectroscopy (MS/MS) and probed the properties of the NP attached proteins. Finally, we assessed the enrichment of protein on AuNP surface and used graph-theory based algorithms to identify cancer-specific hub nodes in the biological networks. These hub proteins could serve as possible therapeutic targets for future investigation.
Our methodology overcomes the shortcomings of conventional MS/MS based analysis that are insensitive to identification of low abundance peptides in samples with high dynamic range.22 It is important to mention that detection of specific proteins with Western blot (WB) or immunoprecipitation assay (IP) only requires a few hundred molecules, while detection of proteins at the low femtomole range by MS requires about 1 billion molecules. Thus, a protein readily detected by WB/IP may not be in sufficient quantities to be identified by MS.23 WB/IP assays are useful to preferentially enrich and detect known proteins. The current approach reported in this paper is suitable for enrichment and detection of unknown proteins because the preferential enrichment and detection is governed by the surface properties of the NPs as opposed to abundance sensitive detection in MS and the targeted antigen–antibody interaction in the case of WB/IP. Furthermore, precise control over nanoparticle size and surface properties provides greater flexibility and tunability to this approach to preferentially enrich unknown proteins relative to the WB or IP approach. Moreover, it is well-known that the expression of genes does not always correlate with the proteins that they translate.24 Therefore, our approach could be used to compliment microarray-based analysis such as those performed in the “The Cancer Genomic Atlas” (TCGA) network.25
Results and Discussion
Strategy
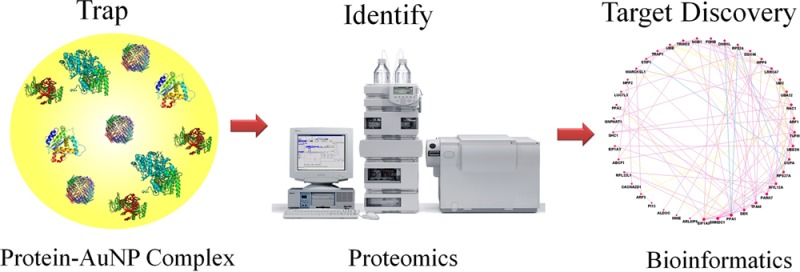
The general strategy for our study is outlined in Scheme 1. We first studied the evolution of protein complex formation around 20 nm AuNPs and then identified the proteins that constitute the NP-protein complex from noncancer human ovarian surface epithelial (OSE) and human ovarian carcinoma (A2780) cell lines. We then used this information to detect differentially expressed cancer cell-specific proteins that might play critical roles in ovarian cancer development, growth, and metastasis.
Scheme 1. Work Flow Outlining the Study to Investigate Formation of Protein–Gold Nanoparticle (AuNPs) Complex and Use This Phenomenon to Enrich Low Abundance Proteins from Cancer Cells.

Analyses conducted are aimed to explore the interaction of proteins on the AuNP surface and to identify proteins that could potentially function as novel therapeutic targets.
Time-Dependent Study of Protein–Nanoparticle Interaction
We first determined the saturation concentration of proteins from A2780 cancer cell lysate for 20 nm AuNP as a first step to understand the dynamics of protein–nanoparticle interaction. Dynamics of protein–nanoparticle interaction cannot be evaluated if the protein concentration used is below the saturation limit to interact with AuNPs, as most of the proteins will bind to the available AuNP surface under such a condition and competition of the proteins toward the AuNP surface will be minimized. Thus, we incubated varying protein amounts (0–400 μg) from A2780 cell lysates with 1 mL (7.0 × 10¹¹ particles) of 20 nm AuNPs for 6 h followed by aggregation testing against 1% sodium chloride (NaCl) solution to determine the saturation concentration. We monitored protein–AuNP interactions by UV–vis spectroscopy and dynamic light scattering (DLS) measurements. The characteristic surface plasmon resonance (SPR) band of AuNPs gradually red-shifted with the addition of increasing amounts of proteins with a concomitant increase in absorbance before being stabilized around 25–50 μg of proteins (Supporting Information, Figure S1a). These results suggest that the saturation concentration of proteins from A2780 cell lysates lies between 25 and 50 μg of proteins/mL of AuNPs. These results were further supported by addition of NaCl, where a maximum absorbance and minimum shift in the absorption maxima of SPR band was observed for 25–50 μg of proteins (Supporting Information, Figure S1b). These results were corroborated by DLS measurement of the complexes at high salt concentration (Supporting Information, Figure S1c) where a minimum perturbation of the hydrodynamic (HD) radius was observed within 25–50 μg of protein. All these results taken together suggest that the saturation concentration of A2780 cell lysate proteins on 20 nm AuNP is ∼50 μg/mL. All of our subsequent experiments were therefore carried out at 200 μg of protein/mL, well above the saturation concentration of the lysate proteins.
To understand the evolution of protein–NP interaction over time we incubated 20 nm AuNPs with 200 μg of protein lysates from OSE (noncancerous cells) or A2780 (ovarian cancer cells) lysates for 5 min, 15 min, 1 h, 6 h, and 24 h. The formation of a protein complex around AuNPs at all the time points was evident from the red shifts observed by UV–vis spectroscopic analysis (Supporting Information, Figure S2a). The SPR of bare gold NPs was relatively sharp and peaked at ∼520 nm, whereas interaction of NPs with proteins lead to a broadening of the SPR band which was accompanied by a red shift of the maxima (λmax). It has been previously described that corona formation involves a time evolution of a layer of loosely attached proteins to an irreversible corona.26 In this context, Casals et al. have reported the hardening of the protein corona around metal and metal oxide NPs when the corona was allowed to evolve for 48 h.27 Although the SPR bands of the NP-protein complex from all time points in our study were virtually indistinguishable when unperturbed, the time evolution of the protein-NP complex could be clearly observed when the protein-NP complex was centrifuged to remove unbound proteins (Supporting Information, Figure S2b). NPs incubated with the protein lysates for longer time points (6 and 24 h) displayed narrower SPR bands which reflected the stability of the protein layer around the NPs over time (Supporting Information Figure S2b).28 Moreover, a gradual increase in absorbance and decrease in the shift of λmax value provided further evidence of the formation and stabilization of the protein-NP complex.28
The time evolution of protein-NP complex was also investigated by measuring the hydrodynamic diameter (z-average) and charge with dynamic light scattering (DLS) and ζ-potential measurements, respectively (Figures 1, 2). These measurements were carried out after pelleting the NPs and resuspending the pellet in water. The DLS measurements showed that bare NPs possessed a hydrodynamic diameter of 30 nm, but when incubated with the protein lysates for 5 min, the NPs displayed a broad size distribution with z-average of 283.5 nm. Over time, significant reduction of NP size was observed; after 1 h incubation, the NPs were 72.31 nm, and by 24 h, the NPs were only 59.2 nm in size (Figure 1). In terms of charge, bare NPs had a ζ-potential of −43.3 mV. After 5 and 15 min, the ζ-potential of the NPs decreased to −29.2 and −32.1 mV, respectively, and a further lowering to −8.40 mV was noted after 24 h (Figure 2). On the other hand, when we looked at the size and ζ-potential of the unperturbed protein-NP complex, there was no difference in size distribution between the time points (Supporting Information, Figure S3). In fact the overlapping size distribution of the NP-protein complex at all time-points had a z-average diameter of 42.90 nm, which compared to the 22.81 nm z-average of NPs suggested that 20 nm may be the optimal size of the bound protein layer around 20 nm AuNPs. These observations point to the fact that, at shorter time points, 5 min (DLS PDI = 0.508) and 15 min (DLS PDI: 0.478), a “sticky” complex was formed around the AuNPs which made the NPs come together after centrifugation. However, at later time points of 6 h (DLS PDI: 0.301) and 24 h (DLS PDI: 0.278), the complex resisted interaction with each other during centrifugation and was comparable in size to the unpelleted NP-protein complex. This is indicative of the stability of the complex around the NPs due to their interaction with stabilizing proteins at these later time points. Of note is the size of the bare NPs which stayed close to 30 nm even after pelleting (Figure 1). These results suggested that the aggregation of the NP-complex after centrifugation at shorter time points was therefore not due to detachment of proteins from the NP surface, as bare NPs showed no signs of aggregation upon centrifugation. Moreover, our data suggested that the protein-NP complex is multilayered in nature, as proteins are relatively small in size, and hence a single protein layer would not account for the increase in the observed NP size. The known radii of a few standard proteins are 3.55 nm (albumin, beef serum), 5.2 nm (catalase, beef liver), and 10.7 nm (fibrinogen, human).29
Figure 1.
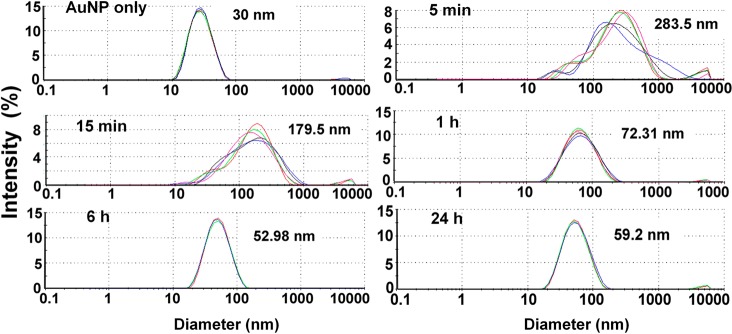
Characterization of AuNPs before and after incubation with A2780 (human ovarian carcinoma cell line) lysates for different time points using dynamic light scattering. Measurements were done after centrifugation to remove unattached proteins. Different colors in the graph represent unique sample runs. The distribution of particle diameters is represented by intensity % along with peak diameters.
Figure 2.
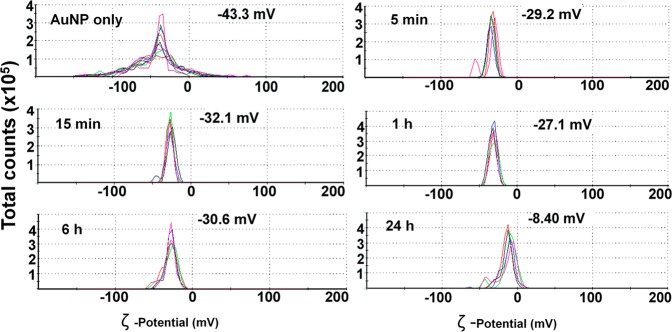
Characterization of protein-NP complex revealed that adsorption of A2780 proteins on the AuNP surface decreases ζ-potential of the NPs over time. Measurements were done after centrifugation to remove unattached proteins. Charge distribution is presented along with peak values. Different colors represent unique sample runs.
To gain more insight into the protein-NP complex formation, we visualized the biological layer around NPs after incubating with A2780 protein lysate for 24 h by TEM (Figure 3). The NP bound proteins around NPs was negatively stained with phosphotungstic acid which revealed that the protein-NP complex could be asymmetrical instead of being a uniformly distributed spherical layer around the spherical NPs. Some insoluble precipitates of phosphotungstic acid were also present in the TEM grid which is typical of negative staining.30 Additionally, the TEM image suggested that NPs could come together to form doublets and act like a singular unit for protein-NP complex formation. These results showcased the heterogeneity of the protein complex formation around NPs, the cause of which is currently under investigation.
Figure 3.

Visualization of protein layer around AuNPs with transmission electron microscopy after 24 h of incubation with A2780 lysates and negative staining with phosphotungstic acid. Measurements were done with NPs that were pelleted and washed once with water.
Molecular Identification of Proteomic Signature around NPs Using Tandem MS
We next sought to identify the components of the hard bound proteins at different time points using MS/MS. Again, since the DLS measurements demonstrated that the NP-protein complex stabilized at longer time points and did not undergo significant aggregation after centrifugation, the NP-protein complexes were purified by centrifugation followed by a single wash with water before analyzing them with mass spectrometry. To assess the reproducibility of the identification process, the NP bound protein was reduced and trypsin digested and injected into the mass spectrometer in triplicate for independent identifications. Venn diagrams to depict the detected proteins demonstrated a robust reproducibility with an average of 78% of proteins being repeatedly identified in all three replicates (Supporting Information, Figures S4, S5). Only proteins identified in all three replicates were included for further analysis. Using this identical workflow we identified the proteins from both OSE and A2780 lysates. A total of 285 proteins were reproducibly detected from OSE cell lysate and 219 proteins were detected from A2780 lysate. These protein groups were most likely abundant proteins and served as a detectable lysate pool to compare the differential property of the attached proteins and to assess the enrichment of proteins on the NP surface (proteins undetected after mass spectrometry analysis of lysates). With the protein complex components being identified, we compared the composition at different time points (Figure 4a). Only 213 (35.4%) OSE proteins and 129 (15.1%) A2780 proteins were common to all time points. These proteins perhaps form a subset of the hard NP-protein complex as they are not displaced from the NP surface once initially bound. On the other hand, proteins detected preferentially at 5 and 15 min were possibly the soft bound proteins, as at these time points, there were more total and unique proteins compared to the complex at 1, 6, and 24 h. For example, at 5 and 15 min, the number of reproducible proteins derived from A2780 lysates was 518 and 507, respectively, while at 24 h only 298 proteins were reproducibly detected (Supporting Information, Figure S4). Also, at 5 and 15 min the number of unique proteins in the protein-NP complex from A2780 were 135 and 158 compared to only 26 unique proteins that were detected at 24 and 6 h (Figure 4a). When we compared the proteins detected at different times, we observed that there was dynamic association and dissociation of proteins that occurred on the NP surface over time (Figure 4b). A block of proteins was present at all the time points while other proteins were associated at a few time points and dissociated from the surface at later time points. Some proteins rapidly associated and dissociated repeatedly in the monitored 24 h time period. The evidence for multiple association and dissociation events on the AuNP surface was intriguing, and our global examination of the adsorption of the protein over time demonstrated the truly dynamic nature of protein–NP interaction and complex formation. At later time points, however, there was less exchange of proteins on the surface, perhaps because a stable protein layer had resulted around the AuNPs at these time points. This pointed out the importance of studying the evolution of the NP-protein complex formation and emphasized its temporal context. Also included in Figure 4b are the lysate pools (Lys), and the comparison illustrated that not all proteins present in the complex could be detected from the lysate pool. These proteins were most likely detected because of their enrichment on the NP surface which signifies the importance of this approach to identify new molecular targets which would otherwise not have been detected due to low abundance.
Figure 4.

Dynamic time dependent changes in composition of protein-NP complex derived from OSE and A2780 lysates. (a) Venn diagram comparing proteins identified in the protein-NP complex at different time points. (b) Detection maps show the presence (black) or absence (white) of proteins and hence provide a global illustration of dynamic protein exchanges occurring on the surface of AuNPs over time. Protein IDs on the Y-axis are arbitrary assignments. Proteins detected from the respective lysate pools are included for comparison.
Effect of Molecular Weights, Isoelectric Points, and Shared Domains of Proteins on NP–protein Interaction
To understand the interaction of proteins and AuNPs, we examined various characteristics of the detected proteins that were attached to the AuNPs. Proteins that are bound to NPs at multiple time points had a significantly higher mean theoretical isoelectric points (pI) (7.5, 7.5, 7.7, 7.7, and 7.7 for OSE; 7.5, 7.8, 7.0, and 7.5 for A2780) compared to the lysate pools (6.5 for OSE; 6.3 for A2780) (Figure 5a,d). The proteins that were present in the NP-protein complex at all the time points also had a similar correlation with pI, where attached proteins had significantly higher pIs (Figure 5c,f). The mean pI of attached OSE and A2780 proteins was 7.7 and 7.6, respectively, whereas pI of OSE and A2780 pooled lysates was 6.5 and 6.3. Interestingly, proteins that were bound exclusively at 5 and 15 min had higher pIs. In the case of OSE proteins, those attached at 5 and 15 min had an average pI of 8.3 and 8.1, and for A2780 proteins, the pI at those time points was 7.4 and 7.6 (Figure 5b,e). This observation suggested that electrostatic interaction played an important role in NP–protein interaction at initial time points. The charge of the protein as one of the contributing factors influencing adsorption of proteins to AuNPs was in agreement with a previous study that reported that BSA must interact with citrate-coated AuNPs via salt-bridges possibly between citrate and lysine residues on the protein surface.31 We also examined the molecular weights (MWs) of proteins that attached to AuNPs and found no difference in the average MW of proteins that are attached vs the lysate pool (Supporting Information, Figure S6).
Figure 5.

Comparison of theoretical isoelectric points (pIs) of proteins detected in the protein-NP complex derived from OSE or A2780 lysates. Proteins that are attached at any time point (a,d) have higher average pI compared to respective lysate pools. Similarly, proteins that adsorb to AuNPs exclusively at shorter time points also have higher pIs (b,e) along with core proteins that are always present in the protein-NP complex (c,f). Red line represents the average pI. (Tukey’s multiple comparison test, unpaired t test *P ≤ 0.05, ** P ≤ 0.01, ***P < 0.001).
We next asked whether the proteins that were attached to the NPs shared conserved domains32 which could shed light on why some proteins adsorb onto the NP surface while others do not. Of the many domains that were enriched, from the proteins bound to the NP surface RRM_1, a RNA recognition motif, was enriched in proteins from all time point complexes (Figure 6a). The RRM_1 a motif is approximately 90 amino acids and encodes a central sequence of 8 aromatic and positively charged residues.33 This association of AuNPs with RNA or RNA related protein machinery emerged again when we examined enrichment of biological pathways (Figure 6b) and gene ontology (GO) based functional enrichment (Supporting Information, Figure S7). Pathways involving ribosome, spliceosome, and gene expression were some of the most enriched pathways along with GO terms such as RNA binding and structural constituent of ribosome. The positive charge of RRM_1 and the “plastic” nature of the domain may explain the enrichment of the domain in the NP-protein complex. Similar structural flexibility capabilities that allow RNA related machinery to interact with RNA might be at play for interaction with AuNPs, and hence, we see ribosome and spliceosome as one of the most enriched pathways that the protein-NP complex proteins belong to. This association of AuNPs with the RNA proteins might also explain why 20 nm AuNPs inhibited proliferation of cancer cells and reversed EMT by down-regulating transcription and secretion of multiple proteins.20,34 Also enriched on the NP surface were proteins involved in protein folding and cytoskeleton-related processes and functions.
Figure 6.
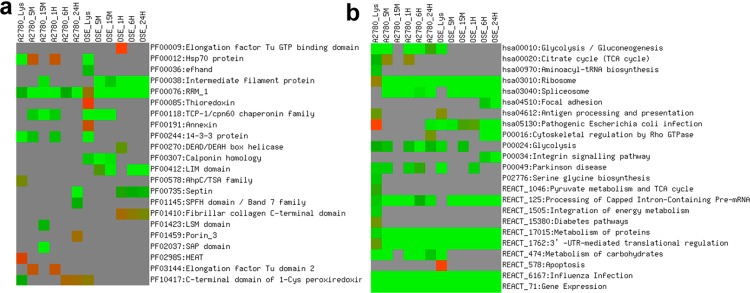
Analysis of evolutionarily conserved functional domains (a) and biological pathways (b) enriched in proteins detected at different time points revealed that AuNPs have a high affinity to mRNA related protein machinery. Protein domains from Pfam database and pathways from databases KEGG (hsa*), Panther (P0*), and Reactome (REACT_*) that are significantly enriched among one or more lists are shown. Color of matrices indicates Bonferroni corrected P-values (P ≤ 0.05). Green indicates higher enrichment, red indicates lower enrichment, and gray color indicates that a given term did not reach statistical significance among the proteins in the list. Pathway enrichment analyses were performed using DAVID v 6.1 using default settings. Human proteome was defined as the background. (M = min, H = hours).
Role of Macromolecular Protein Complexes on NP-Protein Complex Formation
We next investigated whether the adsorbed proteins were present in the NP-protein complex as a part of a macromolecular complex and also identified complexes that were enriched on the NP surface due to protein complex formation as an indication of biological mechanisms including protein aggregation,35 three-dimensional domain swapping,36 or macromolecular crowding.37 Figure 7 shows that higher complex fractions could be detected on the NP surface from both OSE and A2780 lysates. For example, human ribosomes have 80 proteins that form the functional complex with rRNA. Of those, only 24% and 11% were detected in the cell lysates. Interestingly, at shorter time points 70–81% of the components are present in the complex, but at later time points such as at 24 h, only 66% and 54% of the components were present. Temporal analyses of the fraction of protein complexes present at the NP-protein complex at each time point suggested that initially when the NP-protein complex was formed, the NP associated with protein complexes because of specific proteins that have high affinity for the NP surface, but over time, the complex was selectively modified such that secondary associations to the NPs were excluded. This was an important observation and could guide the use of AuNPs in vivo.
Figure 7.

Detection maps showing fraction of proteins from a complex that was detected at each time point. Only complexes that show at least twice the detection (in terms of members) compared to lysate pool and in at least four of the time points are listed. The total number of proteins in each complex is also listed on the right.
Bioinformatics Analysis to Create Functional Protein Network as a Therapeutic Target Discovery Approach
We sought to utilize the proteomic signature in the NP-protein complex to investigate the potential use of AuNPs as a therapeutic target discovery tool. We decided to examine the NP-protein complex at 6 and 24 h because protein characterization and proteomic analyses demonstrated that the NP-protein complexes were stabilized at these time points. When comparing proteins from the NP-protein complex at these time points and proteins detected from the pooled lysate, we identified 41 and 65 A2780-specific proteins that were enriched on the NP surface at 6 and 24 h, respectively (Figure 8). Due to their differential expression in the A2780 cell line, all of these proteins could be important for tumorigenicity. In addition, these proteins were not detected by doing mass spectrometry of the lysates perhaps because of their low abundance. The proteins’ affinity to the AuNPs concentrated them on the surface for detection. Since probing individual proteins from the group is cumbersome and fraught with subjective interpretive problems, we utilized graph-theory based network analyses algorithms to determine the connectivity of the proteins to each other and to identify key protein interaction nodes.38 Disabling one protein (node in the network) that interacts with many others (high connectivity) may maximize the therapeutic potential as it is already recognized that disrupting the function of a single protein is not sufficient to inhibit tumor growth and metastasis.39,40 Figure 8 shows functional protein networks derived from cancer-specific proteins and the proteins were ranked according to the number of connections based on coexpression, colocalization, physical interactions, and shared protein domains. ELF1AX, an essential eukaryotic translation initiation factor, showed the highest degree of connectivity among proteins enriched at 6 h. Other proteins identified with the highest nodal connections were PPA1, a member of inorganic pyrophosphatase family, SMNDC1, a survival motor neuron protein and PARK7, a member of peptidase C56 family of proteins. In case of proteins enriched at 24 h, the protein with the most connectivity was RPL12A, a ribosomal 60s subunit protein. This finding was not surprising considering the enrichment of mRNA related protein on the NP surface. Others included DEK, a DNA binding oncogene, DDX46, a probable ATP-dependent RNA helicase, and GNA13, a G-protein subunit. As evidenced by other analyses, mRNA related proteins were highly enriched on the NP surface. While proteins such as ELF1AX and RPL10A, both related to protein translation, may be too broad to target and nonspecific for cancer cells (in spite of differential expression), others such as DEK, which displays oncogenic properties and regulate DNA damage response signaling,41 might be important to study in the context of ovarian cancer.
Figure 8.

Enrichment of proteins on AuNP surface and network properties of proteins adsorbed to AuNPs at 6 and 24 h (a,b). Nodes are proteins unique to A2780 protein-NP complex at the each time point, which were not detected in the OSE or A2780 lysate pool. The size of network nodes indicates centrality measure derived from the functional network at the given time points. Edge colors indicate the type of interactions: coexpression (violet), physical interaction (green), predicted interaction (blue), shared protein domains (yellow), or biological pathways (orange). Interactions were derived from GeneMania; network properties were computed using Cytoscape plugin Network Analyzer.
To validate our bioinformatics-based network analyses and to demonstrate the biological significance of hub proteins, we studied the protein expression of three nodal proteins that have variable connectivity, namely, PPA1 [Pyrophosphatase (Inorganic) 1], SMNDC1 (Survival Motor Neuron Domain Containing 1), and PI15 (Peptidase Inhibitor 15). SMNDC1 was one of the top nodes detected at both 6 and 24 h. PPA1 and PI15, on the other hand, were only detected at 6 h with the former displaying multiple protein connections while the latter was limited to one. Despite their connectivity status all three proteins were detected with the help of NPs from A2780 cell lysates only. Furthermore, the biological function of these selected hub proteins in ovarian cancer is currently unknown. Functionally, PPA1 catalyzes the hydrolysis of pyrophosphate to inorganic phosphate, which is important for the phosphate metabolism of cells. There is only a single report indicating a role of PPA1 in pathogenesis of gastric cancer.42 SMNDC1 is a nuclear protein that has been identified as a constituent of the spliceosome complex and has been reported to possess anti-apoptotic function together with Bcl-2. Loss of its paralog, SMN, in spinal muscular atrophy has thus been suggested to be involved in the pathogenesis of the disease.43 However, any role of SMNDC1 in cancer has not been defined so far. PI15 belongs to the family of trypsin inhibitors and the role of this class of proteases in gynecological cancers have been reported, but detailed mechanistic studies and therapeutic strategies to inhibit their function are currently lacking.44 Lastly, PI15 has been detected abundantly in human neuroblastoma and glioblastoma cell lines.45 We examined expression of all three proteins in a panel of ovarian cancer cell lines and compared the levels with normal OSE cell line. Western blot analysis showed relative overexpression in most ovarian cancer cells in comparison to normal OSE cells (Figure 9a) which explains their enrichment from A2780 lysates.
Figure 9.

(a) Expression of PPA1, SMNDC1, and PI15 in various ovarian cancer cell lines and normal OSE cells as determined through immunoblotting analysis with actin as loading control. (b) Effect of siRNA mediated silencing on the proliferation of A2780 cells determined by 3H-thymidine incorporation assay. (c) Immunoblot analysis to confirm efficient knockdown of the targets. Actin is used as the loading control.
Finally, the biological significance of these proteins in ovarian cancer has been validated by silencing their corresponding genes using siRNA technology and investigating the effect on cellular proliferation using [3H]thymidine incorporation assay (Figure 9b). The results showed that silencing PPA1 and SMNDC1 dramatically reduced the proliferation of A2780 cells (∼80%), whereas silencing PI15, which had a lower connectivity, had a lesser effect (∼40%). The extent of knockdown was probed by immunoblotting which confirmed almost complete knockdown with siRNA (Figure 9c). These results support our hypothesis that disrupting key nodes with high connectivity could be a better approach for therapeutic intervention. The proteins, PPA1 and SMNDC1, which are thus functionally validated, have the potential to serve as novel therapeutic targets for ovarian cancer treatment. Understanding molecular mechanisms through which these proteins promote ovarian cancer growth will also help to understand the biology of ovarian cancer progression and metastasis.
Conclusions
The present study strongly highlights the dynamic and selective nature of nanoparticle–protein interaction and complex formation on AuNP surface. Through a suitably designed workflow, we have developed a unique strategy to identify cancer specific low abundance proteins and their functional networks. Current strategies for identifying therapeutic targets rests on proteomics, protein, and DNA microarray based-approach which are limited to identifying high abundance proteins and dissection of specific-signaling pathways only.46,47 In contrast, our strategy overcomes the limitations therein and uses nanoproteomics as a tool to identify low-abundance proteins which are invisible to the standard detection techniques. Moreover, the relevance of the constitutive pattern of proteins in the complex lies in the potential identification of such proteins as biomarkers and therapeutic targets for disease states, as demonstrated here in the context of ovarian cancer. The functional diversity and hub properties of proteins adsorbed in the complex opens further possibilities of utilizing this platform as a discovery tool to find novel drug targets from in vivo and in vitro models.
Experimental Procedures
Nanoparticles and Cell Culture
Twenty nanometer citrate-coated gold nanoparticles (AuNPs) at a concentration of 7.0 × 10¹¹ particles/mL were obtained from Ted Pella (15705–20). A2780 cells, human ovarian carcinoma cell line, were grown in RPMI media supplemented with 10% FBS and 1% antibiotic. Noncancer ovarian surface epithelium cell line, OSE, was grown in 1:1 Medium 199 and MCDB 202 (Sigma) with 15% fetal bovine serum (FBS) and 1% antibiotic. Each cell line was grown to 80% confluence in culture dishes. The dishes were washed with PBS buffer to remove FBS in the media and lysed using RIPA (Radio-Immunoprecipitation Assay, Boston BioProducts Inc.) or Cell Lysis buffer (Cell Signaling) containing protease inhibitor cocktail. Protein concentrations were measured with the Biocinchoninic Acid (BCA) assay or DC Protein Assay (Bio-Rad).
Determination of Saturating Protein Amount for Protein-NP Complexation
NP-protein complexes were made by mixing various amounts (5, 10, 25, 50, 100, 200, and 400 μg) of A2780 protein lysates for 6 h with end-to-end mixing. UV–vis and DLS measurements were then conducted on the complexes. After this 10% NaCl solution was added to the complexes to give a final concentration of 1% NaCl and allowed to mix for 15 min. UV–vis spectra and DLS measurements were again conducted on the same NP-protein complexes. Change in absorbance, shift in λmax, and change in Z-average were then calculated.
Time-Dependent Study of Protein-NP Complex Formation
200 μg of OSE or A2780 lysates were mixed with NPs to make a 1 mL reaction volume. The mixture was incubated at room temperature while rotating for 5 min, 15 min, 1 h, 6 h, and 24 h for protein-NP complex formation. The protein-bound NPs were separated from unbound proteins by centrifugation. After the intended incubation period, the NP protein mixture was centrifuged at 16 500 rpm for 10 min and resuspended in ddH2O.
Characterization: UV–visible Spectrophotometry
Samples were loaded onto 96 well plates and absorbance was recorded in the spectral range of 400–700 nm. Measurements were conducted either directly after incubation, or after centrifugation. The procedure followed for each experiment is listed in the figure legends.
Characterization: Dynamic Light Scattering and ζ-Potential
Measurement of NP size and charge was made using Malvern Zetasizer Nano ZS at 25 °C either directly after incubation, or after centrifugation. Samples were loaded onto a prerinsed disposable folded capillary cell for both DLS and ζ-potential measurements. The principle employed by the Zetasizer Nano ZS instrument was ELS (Smoluchowski methodology for aqueous media).
Characterization: TEM
NP protein complex from the 24 h incubation time point was pelleted, washed, and resuspended in ddH2O and drop-coated onto copper grids. The NP-protein complex was negatively stained using phosphotungstic acid. Images were acquired at 80 kV.
Identification of NP-Bound Proteins: Mass Spectrometry
To identify the proteins bound to NPs, the NPs after incubation with the lysates were pelleted and washed once with ddH2O. The resulting pellet was used for identification of bound proteins by nanoLC-MS/MS with hybrid orbitrap/linear ion trap mass spectrometry. Specific methods have been previously described.16 Tandem mass spectra were extracted by BioWorks version 3.2. All MS/MS samples were analyzed using Mascot (Matrix Science, London, UK; version 2.2.04), Sequest (ThermoFinnigan, San Jose, CA; version 27, rev. 12), and X! Tandem (www.thegpm.org; version 2006.09.15.3). X! Tandem was set up to search the Swissprot database (699052 entries) assuming the digestion enzyme semiTrypsin. Sequest and Mascot were set up to search the Swissprot database (699052 entries) also assuming the digestion by trypsin. The tolerance of the searches and the criteria for protein identification has been described before.48
Determination of MW and Theoretical pI
The molecular weight and theoretical pI of proteins were obtained using the compute MW/pI search tool from ExPASy, a SIB Bioinformatics Resource Portal, http://www.expasy.org/.49 Attributes from the longest peptide chain were amassed for analysis.
Biological Enrichment Analysis of Proteins from MS/MS
GO term, protein-domain, and pathway enrichment analyses were performed using DAVID v 6.150,51 using default settings. The entire human proteome was defined as the background.
Analysis of Complexes Present in the NP-Protein Complexes
MS analysis returns a set of detected UniProt IDs. Detection maps (two color heat map) indicating the presence or absence of each protein at each time point are generated. A protein is considered to be present if at least one fragment is detected by MS that can be uniquely assigned to it. This list of detected proteins is mapped to complexes using the human-specific subset of the CORUM database.52 A complex is considered to have been detected if at least one of its components is detected in the NP-protein complex.
Functional Network Analysis
A list of protein at each time point was used to query GeneMania53 to generate a functional network. This network was loaded to Cytoscape54 for network prioritization analyses. Nodes were ranked in the network based on centrality/radiality measures using Network Analyzer55 and a colored gradient network figure was generated based on the rankings.
Immunoblotting Analysis
Immunoblotting analysis was carried out as reported earlier.56 20 μg of total cell lysates from various ovarian cell lines were separated on 10% SDS-PAGE, transferred to PVDF membrane, and detected with antibodies for PPA1 (Dilution 1:1000; MAB6557, R&D Systems), SMNDC1 (Dilution 1:1000; NBP1–47302, Novus Biologicals), PI15 (Dilution 1:1000; Clone 3B5, Sigma), and Mouse Beta-Actin antibody (Dilution 1:10000; A2228 Sigma). HRP-conjugated secondary antibodies (Goat Anti-mouse, sc-2031 and Goat Anti-rabbit, sc-2030; Santa Cruz Biotechnology) were used at a dilution of 1:10000. The blots were finally visualized by chemiluminescence detection using BioRad Clarity ECL kit.
siRNA Knockdown
A2780 cells were plated in 60 mm dishes with 3 mL RPMI-1640 cell culture medium. Cells were transfected with 20 μL of 20 μM siRNA (SMNDC1: SASI_Hs0100210370_AS, PI15: SASI_Hs0100197977_AS, and PPA1: SASI_Hs0100021831, Sigma-Aldrich) along with 20 μL of HiPerfect (Qiagen) and 500 μL of Opti-MEM (Invitrogen). Control siRNA (Qiagen) was used as a control. After 48 h, cells were collected to detect siRNA knockdown efficiency using Western blotting.
[3H]Thymidine Incorporation Assay for Cellular Proliferation
Post 48 h siRNA transfection, cells were seeded (2 × 10⁴) in 24-well plates in 1 mL of media and cultured overnight under standard conditions. One μCi per mL of [3H]thymidine was added and 4 h later, the cells were washed with chilled PBS, fixed with 100% cold methanol, and collected for measurement of TCA-precipitable radioactivity as reported earlier.56 Experiments were repeated at least three separate times, with each repeat performed in triplicate.
Acknowledgments
This work is supported by NIH grants CA135011 and CA136494 to P.M.
Supporting Information Available
Effect of variation of protein amount on complexation (Figure S1), time-evolution of protein-NP complex by UV–visible spectra of evolution (Figure S2), time-evolution of protein-NP complex by DLS measurement (Figure S3), reproducibility studies to detect protein-NP complex formation from OSE and A2780 lysates at different time points (Figure S4,S5), Molecular weight distribution of various detected proteins in the protein-NP complex (Figure S6), and GO terms at different detected proteins at various time points (Figure S7). This material is available free of charge via the Internet at http://pubs.acs.org.
The authors declare no competing financial interest.
Funding Statement
National Institutes of Health, United States
Supplementary Material
References
- Monopoli M. P.; Walczyk D.; Campbell A.; Elia G.; Lynch I.; Baldelli Bombelli F.; Dawson K. A. (2011) Physical-chemical aspects of protein corona: relevance to in vitro and in vivo biological impacts of nanoparticles. J. Am. Chem. Soc. 133, 2525–2534. [DOI] [PubMed] [Google Scholar]
- Milani S.; Baldelli Bombelli F.; Pitek A. S.; Dawson K. A.; Rädler J. (2012) Reversible versus irreversible binding of transferrin to polystyrene nanoparticles: Soft and hard corona. ACS Nano 6, 2532–2541. [DOI] [PubMed] [Google Scholar]
- Walczyk D.; Bombelli F. B.; Monopoli M. P.; Lynch I.; Dawson K. A. (2010) What the cell “sees” in bionanoscience. J. Am. Chem. Soc. 132, 5761–5768. [DOI] [PubMed] [Google Scholar]
- Tenzer S.; Docter D.; Kuharev J.; Musyanovych A.; et al. (2013) Rapid formation of plasma protein corona critically affects nanoparticle pathophysiology. Nat. Nanotechnol. 8, 772–781. [DOI] [PubMed] [Google Scholar]
- Monopoli M. P.; Åberg C.; Salvati A.; Dawson K. A. (2012) Biomolecular coronas provide the biological identity of nanosized materials. Nat. Nanotechnol. 7, 779–786. [DOI] [PubMed] [Google Scholar]
- Rotello V. (2009) Sniffing out cancer using ″chemical nose″ sensors. Cell Cycle 8, 3615–3616. [DOI] [PubMed] [Google Scholar]
- Lacerda S. H. D. P.; Park J. J.; Meuse C.; Pristinski D.; Becker M. L.; Karim A.; Douglas J. F. (2009) Interaction of gold nanoparticles with common human blood proteins. ACS Nano 4, 365–379. [DOI] [PubMed] [Google Scholar]
- Dobrovolskaia M. A.; Patri A. K.; Zheng J.; Clogston J. D.; Ayub N.; Aggarwal P.; Neun B. W.; Hall J. B.; McNeil S. E. (2009) Interaction of colloidal gold nanoparticles with human blood: effects on particle size and analysis of plasma protein binding profiles. Nanomedicine 5, 106–117. [DOI] [PMC free article] [PubMed] [Google Scholar]
- Gessner A.; Waicz R.; Lieske A.; Paulke B. R.; Mäder K.; Müller R. H. (2000) Nanoparticles with decreasing surface hydrophobicities: influence on plasma protein adsorption. Int. J. Pharm. 196, 245–249. [DOI] [PubMed] [Google Scholar]
- Monopoli M. P.; Walczyk D.; Campbell A.; Elia G.; Lynch I.; Bombelli F. B.; Dawson K. A. (2011) Physical-chemical aspects of protein corona: relevance to in vitro and in vivo biological impacts of nanoparticles. J. Am. Chem. Soc. 133, 2525–2534. [DOI] [PubMed] [Google Scholar]
- Tenzer S.; Docter D.; Rosfa S.; Wlodarski A.; Kuharev J.; Rekik A.; Knauer S. K.; Bantz C.; Nawroth T.; Bier C.; Sirirattanapan J.; Mann W.; Treuel L.; Zellner R.; Maskos M.; Schild H.; Stauber R. H. (2011) Nanoparticle size is a critical physicochemical determinant of the human blood plasma corona: a comprehensive quantitative proteomic analysis. ACS Nano 5, 7155–7167. [DOI] [PubMed] [Google Scholar]
- Cedervall T.; Lynch I.; Lindman S.; Berggard T.; Thulin E.; Nilsson H.; Dawson K. A.; Linse S. (2007) Understanding the nanoparticle-protein corona using methods to quantify exchange rates and affinities of proteins for nanoparticles. Proc. Natl. Acad. Sci. U. S. A. 104, 2050–2055. [DOI] [PMC free article] [PubMed] [Google Scholar]
- Cedervall T.; Lynch I.; Foy M.; Berggård T.; Donnelly S. C.; Cagney G.; Linse S.; Dawson K. A. (2007) Detailed identification of plasma proteins adsorbed on copolymer nanoparticles. Angew. Chem., Int. Ed. Engl. 46, 5754–5756. [DOI] [PubMed] [Google Scholar]
- Rocker C.; Potzl M.; Zhang F.; Parak W. J.; Nienhaus G. U. (2009) A quantitative fluorescence study of protein monolayer formation on colloidal nanoparticles. Nat. Nanotechnol. 4, 577–580. [DOI] [PubMed] [Google Scholar]
- Lai Z. W.; Yan Y.; Caruso F.; Nice E. C. (2012) Emerging techniques in proteomics for probing nano–bio interactions. ACS Nano 6, 10438–10448. [DOI] [PubMed] [Google Scholar]
- Arvizo R. R.; Giri K.; Moyano D.; Miranda O. R.; Madden B.; McCormick D. J.; Bhattacharya R.; Rotello V. M.; Kocher J.-P.; Mukherjee P. (2012) Identifying New therapeutic targets via modulation of protein corona formation by engineered nanoparticles. PLoS One 7, e33650. [DOI] [PMC free article] [PubMed] [Google Scholar]
- Dykman L.; Khlebtsov N. (2012) Gold nanoparticles in biomedical applications: recent advances and perspectives. Chem. Soc. Rev. 41, 2256–2282. [DOI] [PubMed] [Google Scholar]
- Mukherjee P.; Bhattacharya R.; Wang P.; Wang L.; Basu S.; Nagy J. A.; Atala A.; Mukhopadhyay D.; Soker S. (2005) Antiangiogenic properties of gold nanoparticles. Clin. Cancer Res. 11, 3530–3534. [DOI] [PubMed] [Google Scholar]
- Tsai C. Y.; Shiau A. L.; Chen S. Y.; Chen Y. H.; et al. (2007) Amelioration of collagen-induced arthritis in rats by nanogold. Arthritis Rheum. 56, 544–554. [DOI] [PubMed] [Google Scholar]
- Arvizo R. R.; Saha S.; Wang E.; Robertson J. D.; Bhattacharya R.; Mukherjee P. (2013) Inhibition of tumor growth and metastasis by a self-therapeutic nanoparticle. Proc. Natl. Acad. Sci. U.S.A. 110, 6700–5. [DOI] [PMC free article] [PubMed] [Google Scholar]
- Zhang Y.; Bai Y.; Jia J.; Gao N.; Li Y.; Zhang R.; Jiang G.; Yan B. (2014) Perturbation of physiological systems by nanoparticles. Chem. Soc. Rev. 43, 3762–809. [DOI] [PubMed] [Google Scholar]
- Chandramouli K.; Qian P.-Y. (2009) Proteomics: challenges, techniques and possibilities to overcome biological sample complexity. Hum. Genomics. Proteomics. 2009, 239204. [DOI] [PMC free article] [PubMed] [Google Scholar]
- Gygi S. P.; Corthals G. L.; Zhang Y.; Rochon Y.; Aebersold R. (2000) Evaluation of two-dimensional gel electrophoresis-based proteome analysis technology. Proc. Natl. Acad. Sci. U.S.A. 97, 9390–9395. [DOI] [PMC free article] [PubMed] [Google Scholar]
- Russo G.; Zegar C.; Giordano A. (2003) Advantages and limitations of microarray technology in human cancer. Oncogene 22, 6497–6507. [DOI] [PubMed] [Google Scholar]
- Spellman P. T.; et al. (2011) Integrated genomic analyses of ovarian carcinoma. Nature 474, 609–615. [DOI] [PMC free article] [PubMed] [Google Scholar]
- Casals E.; Pfaller T.; Duschl A.; Oostingh G. J.; Puntes V. (2010) Time evolution of the nanoparticle protein corona. ACS Nano 4, 3623–3632. [DOI] [PubMed] [Google Scholar]
- Casals E.; Pfaller T.; Duschl A.; Oostingh G. J.; Puntes V. F. (2011) Hardening of the nanoparticle–protein corona in metal (Au, Ag) and oxide (Fe3O4, CoO, and CeO2) nanoparticles. Small 7, 3479–3486. [DOI] [PubMed] [Google Scholar]
- Link S.; El-Sayed M. A. (2000) Shape and size dependence of radiative, non-radiative and photothermal properties of gold nanocrystals. Int. Rev. Phys. Chem. 19, 409–453. [Google Scholar]
- Erickson H. P. (2009) Size and shape of protein molecules at the nanometer level determined by sedimentation, gel filtration, and electron microscopy. Biol. Proced. Online 11, 32–51. [DOI] [PMC free article] [PubMed] [Google Scholar]
- Gao H., Hu G., Zhang Q., Zhang S., Jiang X., He Q. (2014) Pretreatment with chemotherapeutics for enhanced nanoparticles accumulation in tumor: the potential role of G2 cycle retention effect, Sci. Rep. 4. [DOI] [PMC free article] [PubMed] [Google Scholar]
- Brewer S. H.; Glomm W. R.; Johnson M. C.; Knag M. K.; Franzen S. (2005) Probing BSA binding to citrate-coated gold nanoparticles and surfaces. Langmuir 21, 9303–9307. [DOI] [PubMed] [Google Scholar]
- Ponting C. P.; Russell R. R. (2002) The natural history of protein domains. Annu. Rev. Biophys. Biomol. Struct. 31, 45–71. [DOI] [PubMed] [Google Scholar]
- Maris C.; Dominguez C.; Allain F. H. T. (2005) The RNA recognition motif, a plastic RNA-binding platform to regulate post-transcriptional gene expression. FEBS J. 272, 2118–2131. [DOI] [PubMed] [Google Scholar]
- Arvizo R. R.; Bhattacharyya S.; Kudgus R. A.; Giri K.; Bhattacharya R.; Mukherjee P. (2012) Intrinsic therapeutic applications of noble metal nanoparticles: past, present and future. Chem. Soc. Rev. 41, 2943–2970. [DOI] [PMC free article] [PubMed] [Google Scholar]
- Morris A. M.; Watzky M. A.; Finke R. G. (2009) Protein aggregation kinetics, mechanism, and curve-fitting: A review of the literature. Biochim. Biophys. Acta 1794, 375–397. [DOI] [PubMed] [Google Scholar]
- Shameer K., Shingate P. N., Manjunath S. C. P., Karthika M., Pugalenthi G., Sowdhamini R. (2011) 3DSwap: curated knowledgebase of proteins involved in 3D domain swapping. Database 2011. [DOI] [PMC free article] [PubMed] [Google Scholar]
- Ellis R. J. (2001) Macromolecular crowding: obvious but underappreciated. Trends Biochem. Sci. 26, 597–604. [DOI] [PubMed] [Google Scholar]
- Saito R.; Smoot M. E.; Ono K.; Ruscheinski J.; Wang P.-L.; Lotia S.; Pico A. R.; Bader G. D.; Ideker T. (2012) A travel guide to Cytoscape plugins. Nat. Meth. 9, 1069–1076. [DOI] [PMC free article] [PubMed] [Google Scholar]
- Jeong H.; Mason S. P.; Barabasi A. L.; Oltvai Z. N. (2001) Lethality and centrality in protein networks. Nature 411, 41–42. [DOI] [PubMed] [Google Scholar]
- Deutscher D.; Meilijson I.; Kupiec M.; Ruppin E. (2006) Multiple knockout analysis of genetic robustness in the yeast metabolic network. Nat. Genet. 38, 993–998. [DOI] [PubMed] [Google Scholar]
- Kavanaugh G. M.; Wise-Draper T. M.; Morreale R. J.; Morrison M. A.; Gole B.; Schwemberger S.; Tichy E. D.; Lu L.; Babcock G. F.; Wells J. M.; Drissi R.; Bissler J. J.; Stambrook P. J.; Andreassen P. R.; Wiesmüller L.; Wells S. I. (2011) The human DEK oncogene regulates DNA damage response signaling and repair. Nucleic Acids Res. 39, 7465–7476. [DOI] [PMC free article] [PubMed] [Google Scholar]
- Jeong S. H.; Ko G. H.; Cho Y. H.; Lee Y. J.; Cho B. I.; Ha W. S.; Choi S. K.; Kim J. W.; Lee C. W.; Heo Y. S.; Shin S. H.; Yoo J.; Hong S. C. (2012) Pyrophosphatase overexpression is associated with cell migration, invasion, and poor prognosis in gastric cancer. Tumour Biol. 33, 1889–1898. [DOI] [PubMed] [Google Scholar]
- Iwahashi H.; Eguchi Y.; Yasuhara N.; Hanafusa T.; Matsuzawa Y.; Tsujimoto Y. (1997) Synergistic anti-apoptotic activity between Bcl-2 and SMN implicated in spinal muscular atrophy. Nature 390, 413–417. [DOI] [PubMed] [Google Scholar]
- Dorn J.; Beaufort N.; Schmitt M.; Diamandis E. P.; Goettig P.; Magdolen V. (2014) Function and clinical relevance of kallikrein-related peptidases and other serine proteases in gynecological cancers. Crit. Rev. Clin. Lab. Sci. 51, 63–84. [DOI] [PubMed] [Google Scholar]
- Koshikawa N.; Nakamura T.; Tsuchiya N.; Isaji M.; Yasumitsu H.; Umeda M.; Miyazaki K. (1996) Purification and identification of a novel and four known serine proteinase inhibitors secreted by human glioblastoma cells. J. Biochem. 119, 334–9. [DOI] [PubMed] [Google Scholar]
- Andersen J. N.; Sathyanarayanan S.; Di Bacco A.; Chi A.; Zhang T.; Chen A. H.; Dolinski B.; Kraus M.; Roberts B.; Arthur W.; Klinghoffer R. A.; Gargano D.; Li L.; Feldman I.; Lynch B.; Rush J.; Hendrickson R. C.; Blume-Jensen P.; Paweletz C. P. (2010) Pathway-based identification of biomarkers for targeted therapeutics: personalized oncology with PI3K pathway inhibitors. Sci. Transl. Med. 2, 43ra55–43ra55. [DOI] [PubMed] [Google Scholar]
- Kulasingam V.; Diamandis E. P. (2008) Strategies for discovering novel cancer biomarkers through utilization of emerging technologies. Nat. Clin. Pract. Oncol. 5, 588–99. [DOI] [PubMed] [Google Scholar]
- Ramirez-Alvarado M.; Ward C. J.; Huang B. Q.; Gong X.; Hogan M. C.; Madden B. J.; Charlesworth M. C.; Leung N. (2012) Differences in immunoglobulin light chain species found in urinary exosomes in light chain amyloidosis (AL). PLoS One 7, e38061. [DOI] [PMC free article] [PubMed] [Google Scholar]
- Gasteiger E., Hoogland C., Gattiker A., Duvaud S. e., Wilkins M. R., Appel R. D., and Bairoch A. (2005) Protein Identification and Analysis Tools on the ExPASy Server, pp 571–607. [DOI] [PubMed] [Google Scholar]
- Huang D. W.; Sherman B. T.; Lempicki R. A. (2009) Bioinformatics enrichment tools: paths toward the comprehensive functional analysis of large gene lists. Nucleic Acids Res. 37, 1–13. [DOI] [PMC free article] [PubMed] [Google Scholar]
- Huang D. W.; Sherman B. T.; Lempicki R. A. (2008) Systematic and integrative analysis of large gene lists using DAVID bioinformatics resources. Nat. Protoc. 4, 44–57. [DOI] [PubMed] [Google Scholar]
- Ruepp A.; Brauner B.; Dunger-Kaltenbach I.; Frishman G.; Montrone C.; Stransky M.; Waegele B.; Schmidt T.; Doudieu O. N.; Stümpflen V.; Mewes H. W. (2008) CORUM: the comprehensive resource of mammalian protein complexes. Nucleic Acids Res. 36, D646–D650. [DOI] [PMC free article] [PubMed] [Google Scholar]
- Hughes T.; Roth F. (2008) A race though the maze of genomic evidence. Genome Biol. 9, S1. [DOI] [PMC free article] [PubMed] [Google Scholar]
- Shannon P.; Markiel A.; Ozier O.; Baliga N. S.; Wang J. T.; Ramage D.; Amin N.; Schwikowski B.; Ideker T. (2003) Cytoscape: a software environment for integrated models of biomolecular interaction networks. Genome Res. 13, 2498–2504. [DOI] [PMC free article] [PubMed] [Google Scholar]
- Doncheva N. T.; Assenov Y.; Domingues F. S.; Albrecht M. (2012) Topological analysis and interactive visualization of biological networks and protein structures. Nat. Protoc. 7, 670–685. [DOI] [PubMed] [Google Scholar]
- Bhattacharyya S.; Saha S.; Giri K.; Lanza I. R.; Nair K. S.; et al. (2013) Cystathionine beta-synthase (CBS) contributes to advanced ovarian cancer progression and drug resistance. PLoS One 8, e79167. [DOI] [PMC free article] [PubMed] [Google Scholar]
Associated Data
This section collects any data citations, data availability statements, or supplementary materials included in this article.