Introduction
Despite continued controversy over how often and when mammographic screening should occur, the modality remains the mainstay of the early detection of breast cancer. In 2009, the US Preventative Service Task Force on Screening (USPSTFS) published new and controversial guidelines recommending that screening begin at the age of 50 rather than 40 years and that the interval of screening change to every other year rather than yearly. In addition, for the first time, the new guidelines recommended an age at which screening should stop (75 years), when previously no age had been defined.1
These controversial guidelines persist in 2013 despite that digital mammography has shown an improved performance over older, analog imaging and that newer, population-based screening trials have shown more than a 30% reduction in breast cancer deaths in patients screened.2,3 At the heart of the USPSTFS guideline changes are concerns over the risk-benefit ratio of mammography (too many false-positive with few significant cancers detected), the potential for overdiagnosis (finding cancers that probably are not harmful yet are treated aggressively), and that mammography is fraught with false-negatives or misses of clinically significant cancers.
Why digital breast tomosynthesis?
Early data on digital breast tomosynthesis (DBT) has shown that the novel technique may address some of the limitations of conventional mammography by improving the accuracy of screening and diagnostic breast imaging.4–7 With conventional two-dimensional digital mammographic (DM) imaging, many of the concerning false-positives and -negatives are caused by the same issue: the breast is a three-dimensional structure viewed as a two-dimensional image. In the case of false-positives, normal overlapping tissues of various textures and densities may create a complex appearance that too often mimics suspicious asymmetries or areas of architectural distortion, thus prompting additional imaging and occasionally biopsy (Fig. 1). In the case of false-negatives, overlying normal breast tissue may obscure or mask malignant lesions, preventing detection (Fig. 2).
Fig. 1.
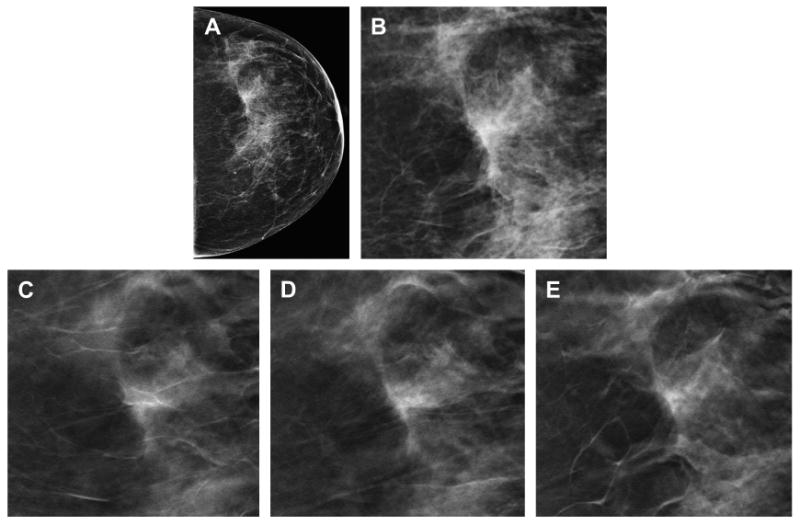
Reduction in false-positive callbacks with DBT. The DM CC view (A) demonstrates focal asymmetry with a suggestion of architectural distortion in the slightly lateral breast. A cropped, enlarged view of the DM focal asymmetry (B) better demonstrates the area of possible distortion. Multiple in-plane 1-mm reconstructed slices (C–E) from the DBT clearly show that the focal asymmetry seen on the two-dimensional DM study is caused by tissue superimposition rather than a clinically significant finding.
Fig. 2.
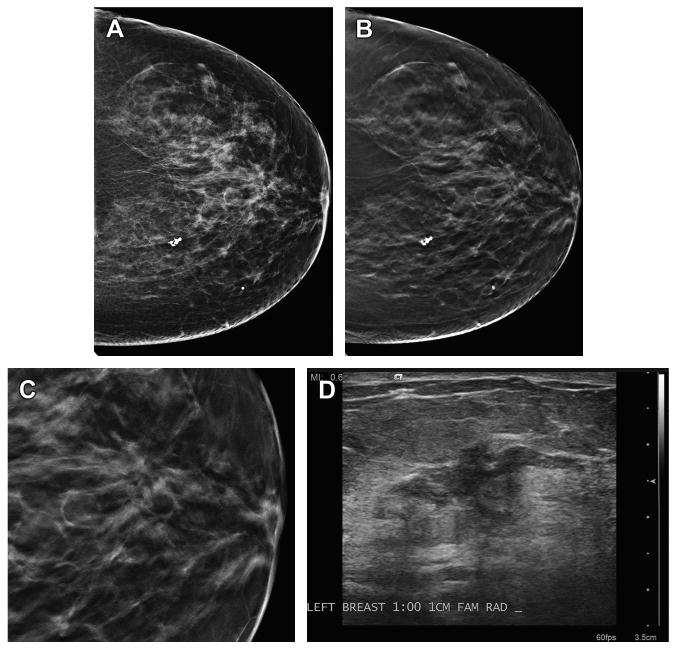
Malignancy detected on DBT only. (A) This patient has scattered fibroglandular densities and no abnormality was detected on the DM imaging. (B) The CC DBT view shows an area of architectural distortion in the retroareolar plane. (C) An enlarged, cropped view of the DBT in-plane slice of the area of distortion demonstrates the greater conspicuity of the area on tomosynthesis imaging. (D) An ultrasound image clearly shows an irregular mass with ductal extension. On biopsy, this was an invasive ductal carcinoma.
The technique of DBT allows the breast to be viewed in a three-dimensional format so that infocus planes, or slices of the breast, can be visualized thus reducing the impact of confounding or superimposed breast tissue. The multiple, in-plane DBT slices are reconstructed from a series of low-dose exposures acquired as the mammographic x-ray source moves in an arc above the compressed breast.8–10 The DBT image sets may be acquired from any angle that the x-ray tube moves and may be obtained during the same compression as the two-dimensional mammographic views. This combination of obtaining a two-dimensional image and a tomosynthesis image set together is often called a “combo-mode” acquisition.11 This combination imaging technique is fast, usually obtained in 3 to 4 seconds (Hologic, Inc. Bedford, MA), and is very well tolerated by patients. In addition, because the two-dimensional and tomosynthesis images are acquired in a single compression, the images are coregistered allowing the reader to toggle back and forth between the image sets to problem solve (see Fig. 1). This combination of 2D digital mammography (DM) and DBT imaging was approved by the Food and Drug Administration (FDA) in 2011.12 Box 1 summarizes some of the clinical benefits seen with DBT imaging.
Box 1. Early evidence on clinical advantages of DBT.
Lesion conspicuity
With DBT, there is subjective improvement in lesion conspicuity for benign lesions (skin lesions, lymph nodes) and for malignant lesions, such as masses and distortion. This ability leads to improved accuracy with DBT.
Three-dimensional localization of lesions
With the reconstructed slices in a DBT image set, an approximate three-dimensional localization of lesions within the breast is possible. This may allow a decrease in additional diagnostic imaging (ie, ML view for localization or tangential views for skin localization) when DBT is incorporated compared with DM alone.
Slice-by-slice evaluation of the breast
Ability to work through areas of superimposition by scrolling through the DBT stack contributes to a decrease in false-positive callbacks (because of tissue superimposition) and a potential improvement in cancer detection (because of unmasking of obscured cancers), particularly invasive cancers.
Performance improvement with DBT for all breast densities
Studies have shown that improvements in sensitivity and specificity are seen across all breast densities, not only in heterogeneous or extremely dense breasts.
Data from reader studies comparing two-dimensional DM with combined DBT and DM show an improvement in sensitivity and specificity5,13–17 coupled with excellent patient acceptance. Now that DBT has been approved by the FDA and has been implemented in many clinics across the world, prospective clinical data are beginning to emerge. Results from a few of these prospective and observational studies are reviewed here (Tables 1 and 2 ).
Table 1. Summary of DBT Screening studies.
| Author | Study Format | Number of Patients | Callback Rate Reduction | Cancer Detection Rate | Comments |
|---|---|---|---|---|---|
| Skaane et al,6 2013 | Interim analysis of prospective reader, modality balanced | 12,631 (expect 18,000) | 15% decrease (P<.001) | 27% increase | 40% increase in invasive cancer detection (P<.001) |
| Rose et al,18 2013 | Prospective clinical practice comparing DBT with years prior of DM | 9256 DBT screens compared with the prior 2 y of DM | DBT recall 5.3% compared with DM-only recall 8.7% (−39.5%; P<.001) | DBT cancer detection rate 5.83/1000 compared with DM rate of 3.6/1000 (P = .003) | Additional cancers mostly invasive |
| Haas et al,19 2013 | Prospective clinical practice, indirect comparison of patient from one practice with DBT with another practice without DBT | Practice of 1602 DBT screens vs practice of 4178 DM | DBT recall 7% compared with DM-only recall 10.9% (P<.01) | DBT cancer detection rate 5.6/1000 vs DM rate of 3.4/1000 (−35.8%; P = .24) | Reduction in recall with DBT largest in patients younger than 50 and/or dense breasts |
| Conant et al,20 2013 RSNA | Clinical practice, prospective comparing DBT with prior year of DM, stable readers | 15,633 DBT screens compared with prior year of 10,753 DM | 15% reduction in recall (P<.001; odds ratio = .80) | Trend of increased cancer detection from 4.4 pre-DBT to 5.48 with DBT (P = .26) | There was a statistical significant increase in cancer detected with DBT in women <50 years |
Table 2. DBT Diagnostic studies.
| Author | Study Format | Patient Mix | Diagnostic Outcomes |
|---|---|---|---|
| Rafferty et al,5 2013 | Two enriched reader studies. | 312 | Reduction in callback from 6% to 67% (P<.03). |
| Mitchell et al,7 2012 | Prospective study, patients recalled from film-screen screening. DM and DBT and callback. | 738 patients including 204 breast cancers | Improved accuracy (AUC) when DBT added to film or film with FFDM for masses (not calcifications). Improved cancer detection for fatty and dense breasts. |
| Skaane et al,4 2012 | Reader study, mix of symptomatic and patients recalled from screening. Patients had two-view DBT. | 129 patients with 27 breast cancer | DBT concordant with no statistical increase in callback; however, two additional cancers detected by DBT alone (8% increase in cancer detection). |
| Bernardi et al,17 2012 | Prospective integrating DBT to assess recalled patient from DM screening (7 readers). | 158 consecutive patients with 21 cancers | DBT recalled all cancer cases and DBT reduced FP callback by 74%. Similar cancer detection rates. |
| Nozroozian et al,16 2012 | Enriched reader study (4 readers) comparing spot compression DM vs DBT in assessment of masses. | 67 patients with breast masses (30 cancer, 37 benign) | No statistical difference in accuracy but mass visibility rating slightly better with DBT. |
| Svahn et al,13 2010 | Reader study (5 readers) evaluating subtle screen detected or diagnostic lesions. | Comparing two-view DM vs one-view DM/DBT vs one-view DBT only | Highest accuracy with DM plus DBT (P<.05). |
| Poplack et al,21 2007 | Prospective evaluation of the impact of DBT on consecutive recalls from screening. | 98 recalls including 5 breast cancers | 40% reduction in FP recall with DBT. No missed cancers. Subjective assessment of lesion conspicuity: DBT equivalent or superior in 89%. However, in calcification-only lesions, DBT inferior. |
| Tagliaficio et al,22 2012 | Prospective study, patients recalled from screening (2 readers) compared spot compression vs DBT. | 52 consecutive recalls with 9 cancers, accuracy and conspicuity assessed | No statistical difference in DM spot compression vs DBT; however, lesion conspicuity considered significantly better with DBT (P<.001). |
| Gennaro et al,23 2010 | Reader study (6 readers) evaluating lesions seen on DM to evaluation with one-view, MLO DBT. | 200 patients with 63 cancers | Overall performance of one-view DBT was similar to conventional DM. |
Summary of DBT Data
DBT in Screening
The early data on the impact of DBT on screening outcomes, although mostly from enriched reader trials, showed up to a 40% reduction in false-positive callbacks24 with a stable or slightly increased cancer detection rate. Because clinical implementation of DBT began only in the last 2 years, there is little published data from larger, prospective, population-based screening trials to further substantiate these performance outcomes. However, the recently published interval analysis from the prospective Oslo Tomosynthesis Screening Trial provides additional evidence that integration of the combo-mode DBT is associated with improvement in sensitivity and specificity.6 In this reader- and modality-balanced prospective trial, the participants undergo combined two-view DM plus two-view DBT (Dimensions, Hologic). Thus far, the results from an initial 12,631 women have shown a statistically significant, 27% decrease in false-positive callbacks and an approximately 30% increase in cancer detection. Most importantly, the improvement in the cancer detection rate is caused by a 40% increase in the detection of invasive breast cancer across all breast densities and there was no increase in the detection of ductal carcinoma in situ.6 Early results from prospective trials in the United States have shown similar reductions in callbacks and improvements in cancer detection.18–20
The increase in the detection of invasive cancers and the improvements in specificity gained with the use of DBT begin to address the major concerns regarding screening mammography: the overdiagnosis of clinically insignificant cancers rather than significant, invasive carcinomas, and the high false-positive rates found with routine screening mammography. By shifting the detected cancers with DBT to otherwise occult invasive cancers, there is a greater likelihood that with DBT screening breast cancer mortality and morbidity rates will be improved. By decreasing false-positive callbacks, women are spared unnecessary anxiety, cost, and potentially unnecessary and traumatic biopsies.
Screening DBT: One View Versus Two Views
One might think that because there is three-dimensional information in the reconstructed image stack from a single tomosynthesis projection, a single tomosynthesis acquisition therefore might suffice for screening. However, just as an improvement in cancer detection was seen when the cranial caudal (CC) view was added to two-dimensional screening many years ago,25 evidence is mounting that the best outcomes in terms of cancer detection and specificity are found when two-view DBT is combined with two-view DM (Boxes 2 and 3). Both Rafferty and coworkers26 and Baker and Lo8 found that approximately 8% to 9% of lesions were visible only on the DBT CC view (Fig. 3). Similarly, studies evaluating one-view, mediolateral (MLO) only DBT do not seem to have improved accuracy than standard two-view DM.13,23,27
Box 2. Early evidence: which combinations of DM and/or DBT should be used?
The “combo-mode” (DM plus DBT)
Two-view DM combined with two-view DBT is associated with an improved accuracy in screening compared with DM alone mostly caused by improvements in specificity (reduction of false-positive callbacks) combined with an equal or slightly improved sensitivity (improved cancer detection rate). The cancers detected by DBT alone are mostly invasive cancers.
What about one-view DBT alone?
Using only a single DBT projection (usually MLO) alone for screening does not seem to have any improvement in accuracy over conventional two-view DM.
What about two-view DBT alone?
Using just two-view DBT without any two-dimensional DM has at least an equal accuracy to two-view DM, possibly slightly better.
Box 3. Early evidence: issues to consider with DBT.
Dose considerations with combination DM/DBT
The dose of the combination of two-view DM with two-view DBT is approximately twice that of conventional DM. Research is ongoing to create high-quality, clinically usable, reconstructed or synthetic two-dimensional images from the tomosynthesis acquisition. The FDA has just recently approved one industry's approach to provide reconstructed, “synthetic” 2-D images (see section of dose).
Reading time for DBT
Reader training necessary and required
Learning curve should be expected
Need specific workstations for efficient DBT viewing
Reading DBT image sets takes approximately twice as long as reading a conventional DM study
Storage of DBT images
Large data files (up to 1 GB) for DBT images
May use lossless compression to decrease storage size
Which image sets should be kept? How long?
Reimbursement
At present time, no approved CPT code for DBT
Some sites add unlisted code 76,499 to normal DM codes
Some sites charge patients out-of-pocket
Fig. 3.
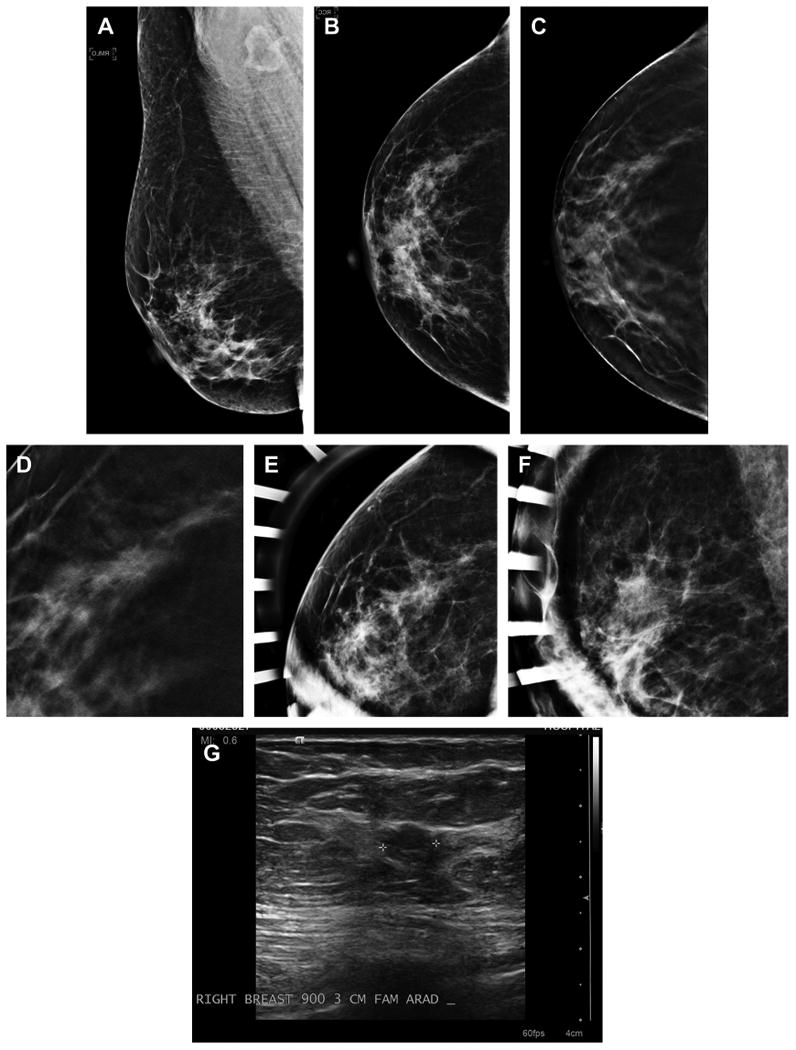
Cancer seen on only one view of DBT. A 54-year-old woman with normal MLO (A) and CC (B) two-dimensional mammography has very subtle spiculated mass seen in the lateral breast on the DBT CC view only (C). An enlarged, cropped view of the in-plane DBT slice where the subtle speculated mass was detected is shown (D). The patient was brought back from screening and additional spot magnification views were performed in the CC (E) and MLO views (F). There was no definite mass or distortion seen on the diagnostic two-dimensional imaging but on ultrasound (G) an irregular mass was visible in the area detected on the CC DBT view. An invasive ductal carcinoma was found on biopsy.
Reader studies using only two-view DBT (without DM) have similar accuracy to standard two-view DM.4,14,15 Gur and colleagues14 compared two-view DM alone versus two-view DBT alone versus the combination of the two in an enriched population of 125 cases with 35 cancers. There was a nonsignificant improvement in sensitivity with two-view DBT alone compared with DM alone. As expected, the greatest improvement in specificity was seen with the combination of DM and DBT compared with either DBT alone or DM alone (0.72 vs 0.64 vs 0.60); there was a 30% reduction in false-positive callbacks with the combination DBT mode. However, in this study the combination mode was not associated with an improvement in sensitivity as has been seen in other, larger, prospective studies. Hologic, in their FDA submission reader study, included an arm of adding one-view DBT (MLO) to two-dimensional DM to keep the dose down compared with the complete combination mode of DBT.12 Although the modified combination mode had a better performance than two-dimensional alone, the sensitivity and specificity were less that that seen with the full combination set of two-view DBT with two-view DM.
There is definitely a trade-off between increased dose, image quality, and the resultant improvement in screening accuracy when DBT is combined with DM. However, it is important to realize that the available tomosynthesis platforms are still evolving. Just as early DM units used a higher dose than many analog systems and subsequent modifications in digital detectors allowed a substantial dose decrease while maintaining image quality, early DBT imaging is faced with demands for dose reductions if the technology is to become the standard of care for sequential, routine screening. There is extensive, on-going research to address the balance of dose and image quality in DBT (discussed later).
Tomosynthesis Performance Versus Breast Density
Combination DBT shows an improvement in performance over DM alone, irrespective of breast density. Although it is intuitive that the addition of DBT in the evaluation of a heterogeneously dense breast should improve the detection of cancers and the reduction of false-positives, it is not as obvious why DBT improves the screening performance in fatty breasts. However, just as malignant lesions may be obscured by normal, overlapping, tissue in a heterogeneously dense two-dimensional mammography, subtle areas of lower-contrast distortion may be overlooked in fatty or scattered density breast because of confounding areas of low-contrast glandular tissue and Cooper ligaments (Fig. 4).
Fig. 4.
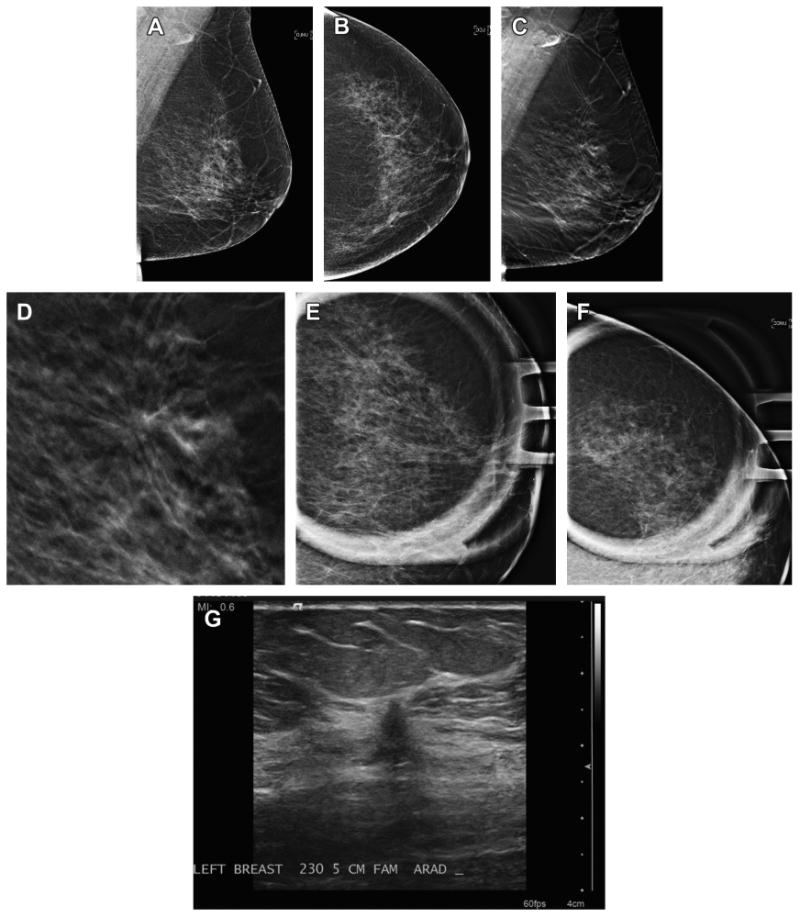
Cancer seen on MLO DBT view only. A 66-year-old woman presented for screening and has normal two-dimensional DM MLO (A) and CC (B) views. Note that the breast has very little glandular tissue to obscure lesions. On the DBT MLO view (C) a subtle area of distortion is present in the superior breast. An enlarged, cropped view (D) of the MLO in-plane DBT slice clearly shows the distortion. Spot magnification two-dimensional views in the MLO (E) and CC (F) views fail to show a discrete mass or persistent area of distortion. Ultrasound (G) was performed based on the three-dimensional localization from the MLO and ML DBT image set. A small, 5-mm intermediate grade invasive ductal carcinoma was found on biopsy.
Rafferty and colleagues5 compared the performance of DM alone with DBT/DM across breast densities, grouped as fatty (BI-RADs density groups 1 and 2) and dense (BIRADs density groups 3 and 4), and found an improvement in the receiver operating characteristic curve for both groups; for fatty breasts the area under the curve (AUC) improved from 0.880 to 0.915; for dense breast, AUC improved from 0.786 to 0.877. An improvement in cancer detection and a significant reduction in false-positive callbacks were seen for both density groups. Although DBT showed the greatest performance improvement in the dense breast subset, the AUC was still highest for the fatty breast subset (0.915 for fatty vs 0.877 for dense).5 This difference in performance is most likely because in extremely dense breasts, there may not be enough fat to create necessary fat-lesion interfaces so that nondistorting lesions may be detected on DBT reconstructed image slices, hence, some cancers are still not detectable. Fig. 5 shows an example of a woman with extremely dense breast who presented with a palpable mass and neither the two-dimensional nor the in-plane DBT slice shows the lesion. Ultrasound of the area of palpable concern demonstrated an irregular mass that was later proved to be an invasive ductal carcinoma on core biopsy.
Fig. 5.
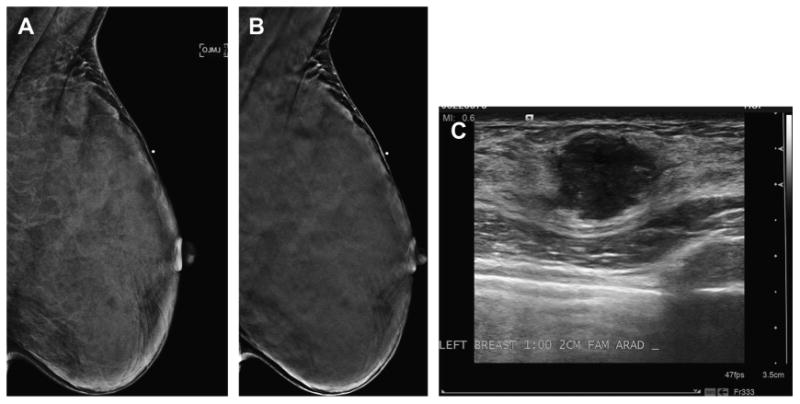
Palpable cancer obscured by dense tissue even on DBT. A 36 year old presented with a palpable lump in the superior left breast. Before imaging, a metallic BB was placed over the area of palpable concern as seen on the MLO view (A). The in-plane slice of the MLO DBT series (B) fails to show a distinct mass, presumably because of the very dense breast tissue and lack of fat preventing any clear margin of a suspicious mass to be detected. Targeted left breast ultrasound (C) clearly shows a highly suspicious mass in the area of palpable concern. Biopsy revealed a high-grade invasive ductal carcinoma.
Tomosynthesis in Diagnostic Imaging
Incorporating DBT in the diagnostic, or problem-solving imaging of patients has the potential to limit, or possibly replace, much of the additional views performed decreasing the x-ray dose and time of imaging. A few early studies have shown a similar or improved performance for DBT in the analysis of lesion margins compared with the conventional DM views, such as spot compression and/or magnification, and 90-degree, medial lateral (ML) views suggesting that tomosynthesis could replace these two-dimensional diagnostic views (Fig. 6).22,28–31
Fig. 6.
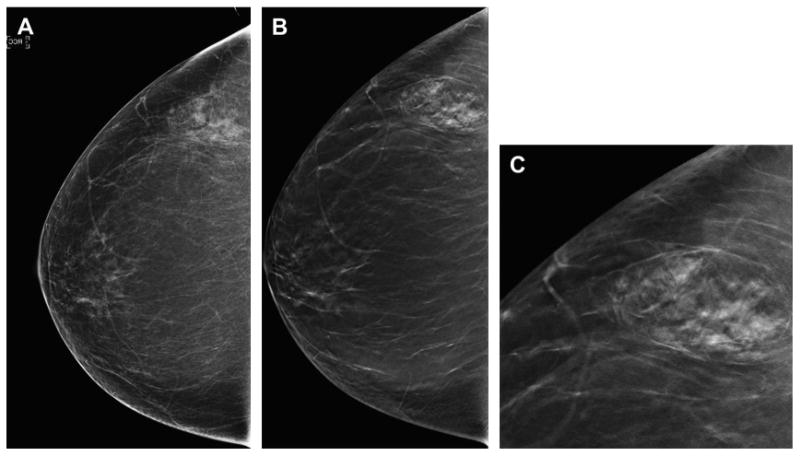
Benign lesion more conspicuous on DBT. A 53-year-old woman presents for baseline screening and has almost entirely fatty breasts except for focal asymmetry in the lateral right breast on the DM CC view (A). On the CC DBT series (B) the lesion is clearly a hamartoma; therefore, no further imaging is needed. An enlarged, cropped view (C) from the CC DBT series clearly shows the mixed density lesion with a pseudocapsule, typical of a hamartoma. No further imaging was needed and the patient was returned to routine screening.
Brandt and colleagues29 compared DBT with conventional diagnostic imaging in the evaluation of 146 women with 158 abnormalities. The agreement between the final DBT BI-RADS categories and the final DM BI-RADS categories from conventional imaging was good to excellent for all readers. In addition, for the conventional work-ups, there was an average of three additional diagnostic views per study compared with the DBT evaluation that was considered adequate in 93% to 99% of cases. Waldherr and colleagues30 found improvement in sensitivity and the negative predictive value of single-view DBT compared with conventional diagnostic imaging in 144 consecutive women referred for diagnostic, problem-solving imaging supporting that DBT will improve the predictive value and diagnostic yield of cancer when incorporated in either screening or diagnostic imaging. Additional studies have shown that DBT is superior to two-dimensional imaging in estimating the extent of malignancies because the margins of the lesions are more conspicuous with tomosynthesis imaging (Fig. 7).7,32,33
Fig. 7.
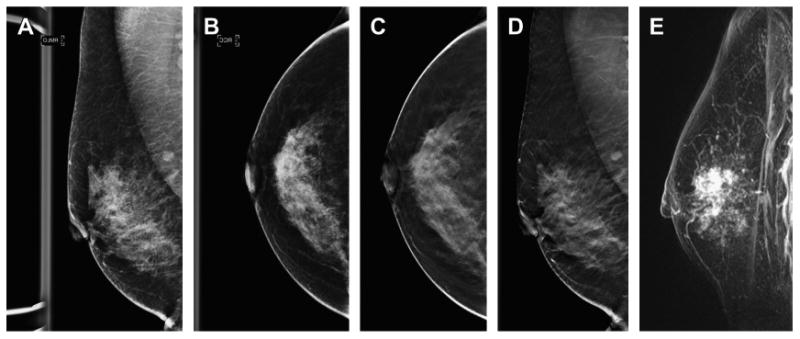
DBT shows the extent of malignancy better than two-dimensional DM imaging. This patient presented for screening and on the DM MLO view (A) no abnormality was seen. On the DM CC view (B) there was a subtle approximately 1.5-cm area of distortion seen in the lateral breast. Both the DBT CC and MLO series (C, D) show extensive distortion caused by a large mass in the superior subareolar location, much more conspicuous than the subtle, small area seen on the DM CC view. A contrast-enhanced breast MR image (E) shows a similar extent of disease as that seen on the DBT study. The patient had a 5-cm invasive ductal carcinoma with an extensive in situ component.
The ability to obtain a three-dimensional location of a lesion in the breast from only one DBT projection is a significant improvement over conventional mammography. In our practice, we have had quite a few cancers that are seen either better or only on one of the two screening DBT projections and not at all on the two-dimensional image set (see Fig. 3). When the patient is called back for diagnostic imaging, the next step is then only ultrasound to confirm the location and ease of potential ultrasound-guided core biopsy; no additional mammographic projections are needed to triangulate or confirm the presence of the lesion.
It should also be noted that some of our DBT-only cancers effaced on conventional spot compression views and might have been disregarded if the DBT images were not as concerning. In evaluating these cases, we relied on the concerning appearance of the lesion on DBT and proceeded with an ultrasound irrespective of what spot compression imaging revealed (see Figs. 3 and 4). If DBT imaging had not been used, these cancers might have been overlooked.
As demonstrated by Brandt and colleagues,29 it is conceivable that the total dose from the combo-mode DBT screening could be less than that when a patient who was only imaged with conventional DM is recalled. Because additional diagnostic imaging frequently includes ML, spot compression, and/or magnification views, and sometimes rolled or tangential views, the total dose could add up to a similar or greater dose that a combo-DBT. In addition, the DBT imaging might provide more diagnostic information.
However, if tomosynthesis resources are limited and DBT is not performed on all patients at screening, how should one best use DBT in the diagnostic setting? Certainly, if triangulation is needed as part of a diagnostic evaluation of a lesion seen on only one view, a combo-DBT ML gives not only the location in the superior-inferior dimension but also a good estimate of the location in the medial to lateral dimension from the position of the lesion in the reconstructed DBT stack. In addition, if DBT resources are limited, one might consider performing DBT on all breast cancer survivors, especially those who had a two-dimensional DM occult cancer that presented as a palpable lump. However, it must be noted that not all cancers will be seen with DBT. Although there are no studies yet published comparing DBT with contrast-enhanced MR imaging in cancer detection, anecdotally we have seen a few cases where fairly large, invasive cancers were not detected on DBT but were seen on MR imaging, presumably because the lesions caused little to no distortion or distinct mass margins.
Calcifications with DBT
There is potentially no greater challenge in DBT imaging than the reconstruction of the tomosynthesis images for the optimal detection and characterization of calcification. If calcifications are small and dispersed, single reconstructed DBT slices may show only a few calcifications of a clinically significant cluster. If calcifications are large, they may cause significant artifacts, appearing on multiple slices as repeating ghost-like, out-of-focus white objects bordered by dark shadows, marching in the direction of the x-ray tube motion (Fig. 8).
Fig. 8.
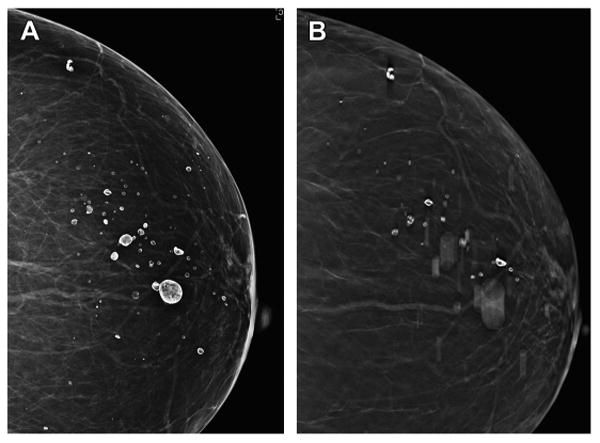
Artifacts on DBT. The two-dimensional DM CC view (A) from a screening mammogram of a woman with an almost entirely fatty breast demonstrates “eggshell” calcifications caused by benign oil cysts. A single reconstructed slice from the CC DBT imaging (B) shows a few calcifications in focus but others are out of focus because of their out-of-plane position, above and below the reconstructed plane viewed. One can imagine that such artifacts created by the reconstruction of out-of-plane coarse calcifications or clips from biopsy could obscure the detection of clinically significant findings.
A few studies have specifically reported on the visibility of calcifications in tomosynthesis imaging with differing results. Poplack and colleagues,21 in a study comparing DM with DBT image quality in the diagnostic evaluation of lesion subtypes, found that when readers graded a DBT image quality as inferior, 72% of the lesion subtypes on those images were calcifications. However, the study was small and only 14 of 99 lesions evaluated were calcification-only lesions. In addition, the tomosynthesis unit used in the study had a much longer average scan time (19 seconds vs 4 seconds) than the FDA-approved model now in clinical use. The longer scan times could have led to patient motion and subsequent unsharpness of the calcifications in the reconstructed images.
The characterizing of calcifications continues to be a challenge with DBT imaging and newer studies have found conflicting results regarding the visibility of calcification-only lesions.34,35 Kopans and colleagues34 evaluated 119 sequential cases of clinically relevant calcifications and found equal or superior performance of DBT versus DM in 92% of cases studied. However, in contrast to Kopan's results, Spangler and colleagues35 performed a multireader study comparing DM only with DBT only in the detection and characterization of calcifications using a test set of 20 biopsy-proved malignancies, 40 biopsy-proved benign cases, and 40 negative screening cases. Overall, there was a statistically significant higher detection rate for calcifications on DM than DBT (84% vs 75%); the specificity in evaluating the calcifications was also higher for DM than DBT (71% vs 64%).
For the present time, because two-dimensional DM images are included in the tomosynthesis image set, readers of DBT have the option to scrutinize calcifications in either a two-dimensional format or in the DBT stack of reconstructed images (discussed later). At this point in time, it is very unlikely that DBT imaging can replace dedicated two-dimensional spot magnification views that are often needed for the characterization of calcifications.
Basics of DBT Interpretation
What Is in a DBT Image Set?
The DBT/DM image set consists of three images series: (1) the conventional two-dimensional mammogram; (2) the source projection images; and (3) the multiple, reconstructed images presented as the “DBT stack” (see Fig. 2). The reconstructed DBT slices, which are typically 1 mm thick, may be displayed either in a cine mode or individually, to be scrolled through manually by the reader. The source, projection images are displayed at the workstation somewhat like a maximum intensity projection image and can be helpful when assessing for gross motion of the patient that might not be evident when viewing the reconstructed DBT stack. In just a click of a button or a toggle between screens, the reader is able to switch back and forth between each image set to compare the coregistered imaging findings quickly and easily.
The DBT slices are generally reconstructed at 1-mm intervals, and therefore the number of reconstructed slices is similar to the thickness of the breast in compression; thick breasts have many more reconstructed slices that thin breasts. At the top or bottom of the DBT stack, the dermis and the cutaneous caves of Kopans,36 small vertically oriented fat-containing columns, are visible confirming the very superficial location of the first images in the stack. It is in these very early slices that skin lesions, such as moles, skin calcifications, or sebaceous cysts, are clearly visible (Fig. 9).
Fig. 9.
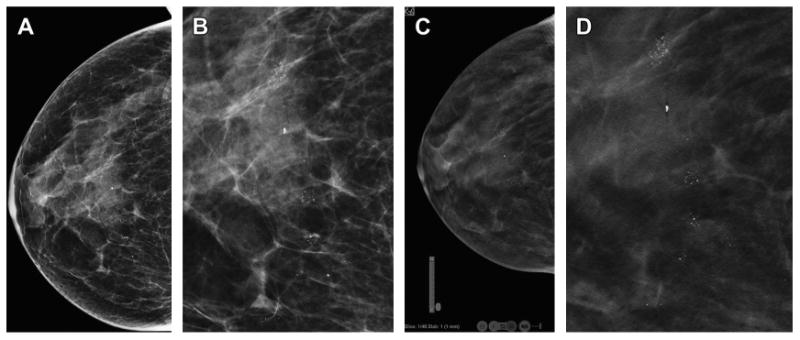
Three-dimensional localization of skin calcifications with DBT. The two-dimensional DM CC view (A) shows multiple clusters of calcifications. An enlarged, cropped two-dimensional CC image (B) shows calcifications that are not clearly benign. The CC DBT image (C) from the last, inferior or caudal, reconstructed slice (C) shows that all the calcifications are localized within the skin. Note the location graphic in the left corner of the image that shows that the slice is the first slice in the series (Slice: 1/46), at the “F” foot or caudal portion of the stack of DBT reconstructed images. Also visible are small round areas of lucency at the edges of the image. These are the caves of Kopans, columns of fat that extend from the dermis to the subcutaneous tissue. These are also seen on the magnified CC DBT view (D) again confirming that the calcifications are clearly within the skin and are therefore benign. No additional imaging is needed.
The DBT stack is presented to the reader usually starting with the first reconstructed slice obtained from either side of the breast, medial or lateral for the MLO stack and from the top or the bottom of the breast for the CC view. The choice of which of these starting locations for the first slice of a DBT image stack may be set in the reader preference field of the DBT hanging protocol on the workstation.
Tools for DBT Interpretation
Triangulation
One of the important advantages of tomosynthesis is the ability to localize a finding in the breast in a three-dimensional location. While the reader scrolls through the individual DBT reconstructed images, a numerical and a graphical representation of the slice location is visible (Fig. 10). These tools allow the reader to localize from where in the breast each reconstructed slice originates, thus allowing triangulation of breast structures or lesions with only one DBT view. This inference of three-dimensional location is important when a clinically significant lesion is visible in only one two-dimensional DM projection and/or seen only on the tomosynthesis images in one projection. In addition, this ability to localize lesions with DBT imaging may lead to a decrease in diagnostic imaging, such as the 90-degree ML view frequently obtained for diagnostic triangulation or tangential imaging used to localize skin lesions.
Fig. 10.
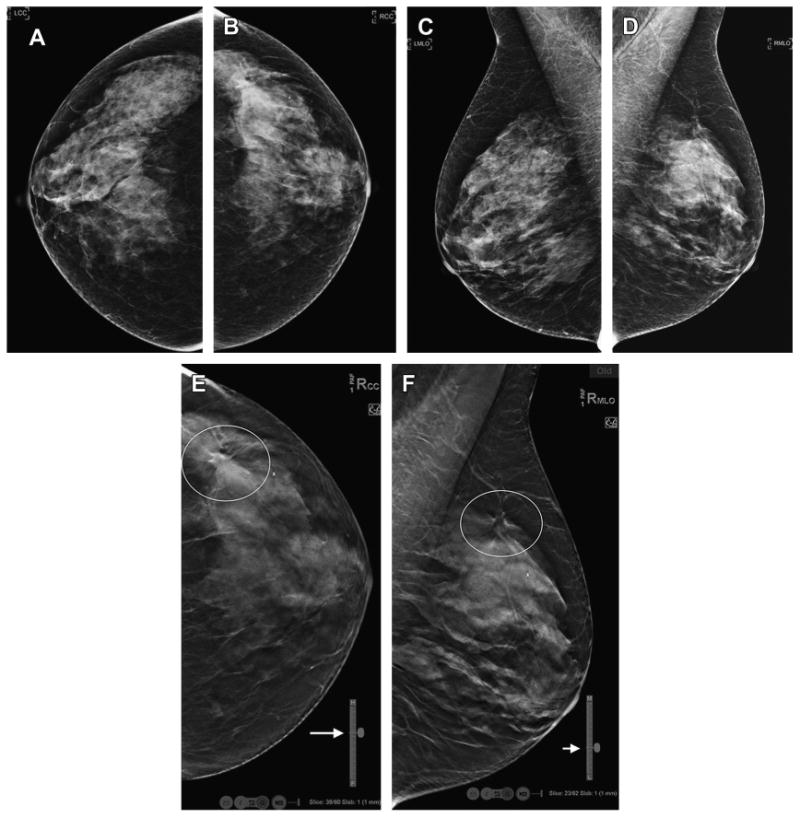
DBT localization tools. The routine, DM screening mammogram (A–D) shows no definite abnormality. On the DBT CC view (E) there is an area of architectural distortion in the lateral breast that is localized in the superior portion of the reconstructed stack of slices (Slice: 39/60 and close to the “H” or head, cranial aspect of breast as shown on vertical localizer marker, arrow). Now knowing were to search in the MLO DBT reconstructed slices (F), a very subtle area of distortion is seen in the superior and lateral aspect of the MLO stack (Slice: 23/62; closer to “L” or lateral side of breast on vertical localizer marker, arrow).
Slabbing
Another useful tool for interpreting tomosynthesis images is the ability to sum or “slab” multiple sequential reconstructed slices into one, thicker slice. For example, if a small spiculated mass or a cluster of calcifications spans multiple of the 1-mm reconstructed DBT slices, the reader may manually expand the thickness of the reconstruction to include as many slices within the stack as he or she wishes. After a desired thickness is chosen, the slices are summed and can be scrolled through using larger-thickness increments (Fig. 11). Although the increased slice thickness increases the number of calcifications seen in the reconstructed slab and may increase the reader's three-dimensional perception of calcifications within a cluster, the spatial resolution of the individual calcifications is decreased with the increased reconstruction thickness. There is great potential for new computer-assisted detection (CAD) algorithms that could help optimize tasks, such as the flagging of concerning calcification clusters on multiple reconstructed slices and the automated volumetric slabbing of zones of calcifications across multiple slices.
Fig. 11.
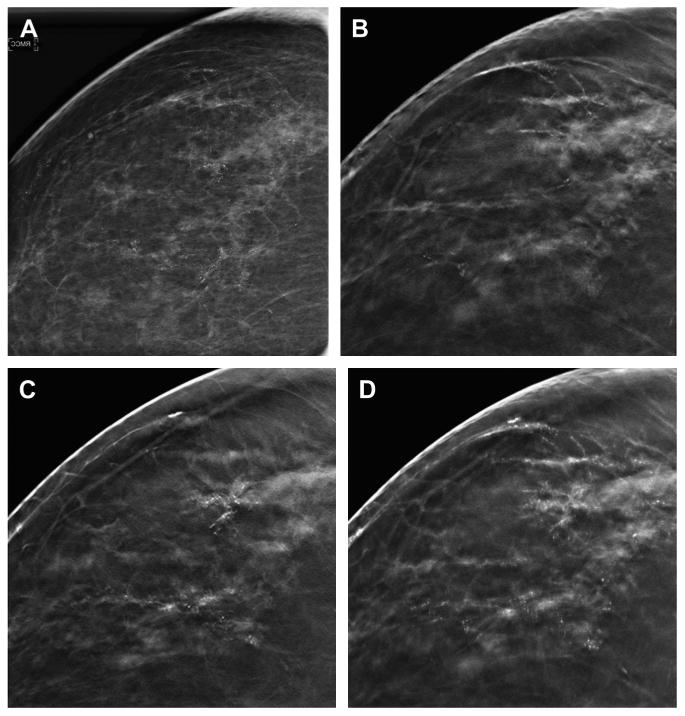
Slabbing to aid in the analysis of calcifications. A two-dimensional CC DM spot magnification view (A) shows suspicious calcifications in the lateral breast. A 1-mm reconstructed DBT slice in the CC projection (B) shows some of the lateral, linear calcifications but unsharpness of other calcifications. A different, 1-mm reconstructed DBT slice in the CC projection (C) shows additional calcifications that are now in-plane and in focus in an area of subtle architectural distortion. The calcifications seen on the previous slice are not as clearly visible on this 1-mm reconstructed slice. A 10-mm reconstructed “slab” (D) better demonstrates the extent of the suspicious calcifications and associated subtle distortion. The slabbing technique may help improve the conspicuity of a larger area of calcifications but also introduces a degree of unsharpness as the reconstruction thickness is increased. On biopsy, this was high-grade ductal carcinoma in situ without invasion.
How to Incorporate the DBT Images into Hanging Protocols
In our screening practice, the combo-mode hanging protocol is almost identical to the two-dimensional digital screening hanging protocol except that after the two-dimensional mammogram presentation with comparison with prior studies, the CC and MLO DBT views are displayed in full resolution, prompting the reader to scroll through the DBT stack to check for any lesions that might not have been seen on the routine two-dimensional views. These full-screen DBT images are placed in the hanging protocol before the final four-view two-dimensional image set is displayed with any CAD marks. Of course, at any time while the reader is viewing the routine, two-dimensional screening views, he or she may toggle back and forth between the DBT and two-dimensional images of the same projection to problem-solve areas of concern. This ability to rapidly change between the image sets is extremely valuable in assessing areas of calcifications, possible distortions, masses, or focal asymmetries. It is humbling to have reviewed an entire set of two-dimensional screening images that look very normal only to review the DBT image set, which reveals an otherwise occult, spiculated mass.
Considerations In DBT Implementation
Dose Concerns
Because the only approved use of DBT is in the combo-mode, which in many ways is a double mammogram, one would expect the total dose per breast to be approximately twice that of a conventional DM mammogram. Indeed, Feng and Sechopoulos37 in a phantom study found that the average dose for a combination DBT/DM study of a 5-cm thick breast phantom with 50% glandularity was 2.50 mGy per DBT view, below the 3 mGy per view limit set by the Mammography Quality Standard Act (MQSA). Of course, one must note that the range of dose varies significantly depending on breast size and composition and in the Oslo Screening Trial, using measurements from actual screening patients, the mean glandular dose for the DM and the DBT studies were 1.58 ± 0.61 mGy and 1.95 ± 0.58 mGy, respectively.6 Therefore, combined together, the average dose for the DM/DBT image set was 3.53 mGy per image set, higher than that calculated by Feng and Sechopoulos37 and also higher than the MQSA limit.
Much of the desire for the two-dimensional DM when implementing DBT is driven by the need to accurately detect and characterize calcifications but the two-dimensional imaging is also extremely helpful in the transition of implementing DBT clinically when comparing with older DM studies. However, with the combination mode of two-dimensional and DBT, the dose penalty is high and possibly not sustainable for all patients over many years of screening.
To decrease the dose of DBT while still including a two-dimensional formatted image, there is active research in creating synthesized two-dimensional images from the DBT acquisition. Gur and colleagues,38 in a study of 114 cases with 10 readers, found that there was a loss of sensitivity but an equivalent specificity when synthetic images plus DBT were compared with the full mode of imaging with two-dimensional DM and DBT. It is important to understand that the algorithm used was an early prototype and newer algorithms are under development. Synthesized two-dimensional images are also being evaluated in one arm of the Oslo Tomosynthesis Screening Trial.39 In mid 2013, the FDA approved the first clinical application of synthetic imaging, or “C-view,” for the Hologic tomosynthesis unit (Fig. 12).40 Thus far, full FDA approval has not been granted.
Fig. 12.
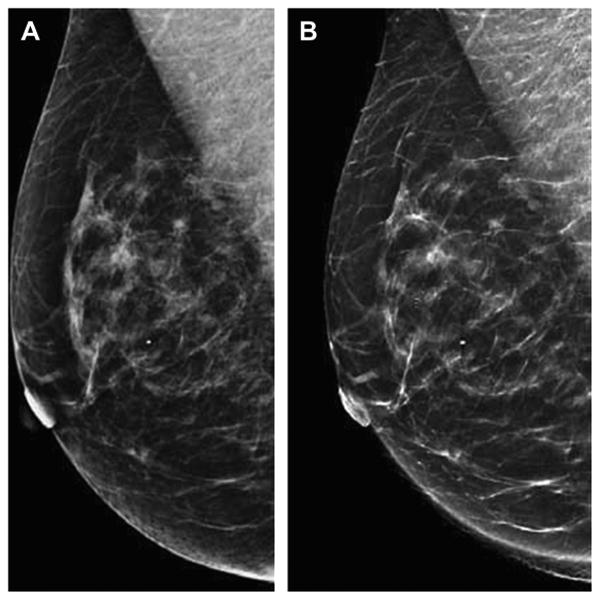
Synthetic two-dimensional images reconstructed from DBT acquisition. The two-dimensional DM MLO view is shown on the left (A) with the reconstructed synthetic MLO view (B) shown on the right (B). The synthetic image (B) is reconstructed by summing the data obtained from the individual slices that make up the DBT image set. Research and development is ongoing to reconstruct two-dimensional images that provide the necessary two-dimensional information, such as the morphology and distribution of clinically significant calcifications, so that two-dimensional DM imaging and the associated dose could be eliminated in many cases. The synthetic two-dimensional image would be viewed with the DBT image set.(Courtesy of Hologic, Inc, Bedford, MA; with permission.)
CAD in DBT
Currently, CAD is available for clinical applications only for two-dimensional imaging. Therefore, when DBT is used in the FDA-approved combo-mode, CAD algorithms run on the two-dimensional DM data and CAD marks are displayed at the workstation on the two-dimensional images only. Although current CAD algorithms for conventional mammography cannot be directly applied to DBT image data, there is active research in this field and data suggest an improvement in three-dimensional CAD performance compared with DM CAD.11,41–45 This is understandable because on individual DBT slices, the margins of masses and subtle areas of distortion are better depicted, which could lead to more true-positive CAD marks. Additionally, because there are presumably less false-positive focal asymmetries with DBT individual slice data, there may also be less false-positive CAD marks per case. Studies using enriched case sets have reported sensitivities of 85% to 90% for masses with DBT CAD with less than 2.5 false-positive marks per case, per breast volume.41–44 Reiser and colleagues45 tested a DBT calcification detection program and found an 86% sensitivity with 1.3 false-positives per breast volume, which was better than DM alone CAD systems.
Because combination DBT/DM image sets do take longer to interpret, DBT CAD could play a significant role in improving workflow efficiency. There is research developing CAD to flag sequential slices of the DBT reconstructed stack containing CAD-detected calcifications so that the reader can quickly target those areas and quickly slab the demarcated thickness to in effect create a volume of slices containing CAD-marked calcifications. This bookmarking of slices containing calcifications detected by the CAD system could help in the efficiency of DBT image interpretation.11
Interpretation Time
There is no doubt that the reading time for interpreting a mammogram that includes DBT images is longer than that for a conventional mammogram. The simple math totaling the four images of a routine mammogram plus the approximately 50, 1-mm reconstructed images per stack from each of four DBT projections (two MLO and two CC) of a 5-cm breast, quickly exceeds 200 images for a single case. Several studies have attempted to calculate just how much additional time it will take to interpret combo-mode DBT studies but at the time of writing this review there are very few measures taken from actual clinical experience where readers have fully implemented DBT in their clinical practice. The early published studies have showed a wide range of additional time for the interpretation of DBT studies, which probably reflected the learning curve of the readers and the use of the early, prototype workstations with less than ideal DBT navigational tools.46 In addition, most of these studies were using test sets that included complicated cancer cases, thus increasing the mean times for interpretation. Gur and colleagues38 evaluated DBT reading times in such an enriched test set and found reading times increased from a mean of 1.22 to 2.39 minutes when DBT images were included. More recently Bernardi and coworkers47 reported that when DBT was incorporated in an enriched screening study, the average reading time increased from 33 seconds to 77 seconds. Early results from the Oslo Tomosynthesis Screening Trial have found similar increases in reading time, with an increase from 45 seconds for DM alone to 91 seconds for the DBT/DM studies.6
Assuming that DBT will routinely be incorporated in breast imaging, there is a great need for processing algorithms, robust image display systems, and navigational tools to help optimize image quality and efficiency of display and reading. Similarly, CAD applications that bookmark individual slices and series slices of potential interest in the DBT stack could help with lesion detection and reading efficiency.
Image Storage Issues
The picture archiving system (PACS) storage requirements for DBT studies are significant and before any site begins clinical implementation, preparations must be made to accommodate the large file sizes and the industry-specific file formats. For each DBT examination, the regular DM images and the reconstructed DBT slices must be stored. The number of slices for each DBT view depends on the thickness of breast but an average combination DBT/DM study produces approximately 1 GB of data. If the DBT images are stored with a 4:1 reversible (lossless) compression, the total size of the dataset decreases to approximately 250 MB,8 which is still substantial compared with a routine DM study and larger than a typical chest-abdomen-pelvis study.48
To keep the storage requirements to the minimum, we do not save the raw data or the projection images in our clinical PACS. A valid question that we have not yet addressed is: How long do we save the reconstructed slices for future clinical comparison? Two years? Three years? Certainly, the reconstructed slices need not be saved for eternity if there is a two-dimensional DM study saved.
Learning Curve and DBT Training
As with implementing any new imaging technology, there is a substantial learning curve in interpreting DBT studies. Currently, radiologists, physicists, and technologists are required by MQSA to complete 8 hours of dedicated tomosynthesis training before clinical implementation.49 Despite this training, our practice had an initial increase in the group's average screening callback rate during the first few months after implementing DBT probably because we began to detect some very subtle, “tomo-only” cancers and began shifting our operating point, calling back screening findings we perceived to be subtle distortion on DBT in hopes of finding additional, “tomo-only” cancers. It is obvious that readers will also need to reset their threshold for passing or calling back what looks extremely benign but seen only on DBT imaging, such as small well-circumscribed masses that are probably cysts or newly unmasked intramammary lymph nodes. We have found that areas of distortion from prior benign biopsies are much more conspicuous with DBT and close correlation with the history of prior procedures and skin scar sites is needed to prevent unnecessary, false-positive callbacks. In addition, we have been surprised with the number of radial scars detected on DBT, high-risk lesions that prompt false-positive biopsies, frequent excision, and occasionally MR imaging.
In our practice, we chose to begin our DBT implementation with large-volume screening so that each reader would develop a template for normal before starting diagnostic imaging. We estimate that it took approximately 1000 DBT screening cases per reader before we had reset our threshold for interpreting DBT at a stable operating point. We have now expanded our DBT practice to include all breast conservation patients and the imaging of the remaining breast in unilateral mastectomy patients.
Reimbursement
DBT is still considered to be investigational and therefore there is no approved CPT code and no standard reimbursement. To receive a level of reimbursement, some centers add the unlisted diagnostic procedure code 76,499 to the appropriate HCPCS Level II “G” codes (G0202, G0204, or G0206) that describes the screening or diagnostic full-field digital mammography performed.50 The success of obtaining reimbursement with this strategy is unknown. Other sites market the fact that they offer DBT imaging and charge patients up to $50 out of pocket for the addition of DBT to their conventional study.51,52 Standard reimbursement, at a yet to be determined level, should follow if the results from large, prospective, clinical trials continue to show significant benefits in specificity and improved cancer detection rates.
Summary
Early data, based mostly on small reader studies, suggest that DBT is likely to have a significant impact on breast imaging. The ability to scroll through the tomosynthesis stack to work through areas of tissue superimposition that on two-dimensional imaging appear concerning has led to a decrease in false-positive callbacks. An improvement in lesion conspicuity and the quasi three-dimensional information gained with the tomosynthesis acquisition may also allow more expeditious evaluations of suspicious areas and an increase in cancer detection.
Results emerging from larger, prospective DBT screening trials have supported the findings from the earlier, smaller reader studies by demonstrating significant improvements in specificity and sensitivity. Most significant is the early prospective data that has shown that the increased cancer detection is caused by the increase in detection of invasive cancers, which are more likely clinically significant, rather than an increase in the detection of in situ lesions, which some consider to be adding to overdiagnosis.
There are, however, issues that must be considered when implementing this new technology into daily clinical practice. With the current technology, there are extremely large data files that require PACS storage, there is an approximately double x-ray dose for the combo-mode of DBT/DM, there is an estimated double in the interpretation time needed, and there is no approved reimbursement to cover the additional overhead needed to support this new digital mammography platform.
Despite these issues, it is important to realize that this new technology is only in its clinical infancy and multiple researchers and industries are working to address these issues. There is no doubt that DBT imaging is here to stay and that it will address many of the limitations of conventional 2D mammography. However, additional data from large, multi-site prospective trials is needed so that the true impact of DBT imaging on breast cancer screening outcomes may be realized.
Key Points.
DBT improves specificity and sensitivity in breast cancer screening.
The conspicuity of masses and areas of distortion is improved with DBT.
The three-dimensional information from DBT imaging may replace the need for some two-dimensional diagnostic imaging in the evaluation of suspicious lesions.
Research is ongoing to address the increased x-ray dose of combination DM/DBT and to improve the efficiency of reading the large image sets.
References
- 1.US Preventive Services Task Force. Screening for breast cancer: US Preventive Services Task Force recommendation statement. Ann Intern Med. 2009;151(10):716–26. doi: 10.7326/0003-4819-151-10-200911170-00008. [DOI] [PubMed] [Google Scholar]
- 2.Pisano ED, Gatsonis C, Hendrick E, et al. Diagnostic performance of digital versus film mammography for breast cancer screening. N Engl J Med. 2005;353:1773–83. doi: 10.1056/NEJMoa052911. [DOI] [PubMed] [Google Scholar]
- 3.Tabar L, Vitak B, Chen TH, et al. Swedish two-county trial: impact of mammographic screening on breast cancer mortality during 3 decades. Radiology. 2011;260(3):658–63. doi: 10.1148/radiol.11110469. [DOI] [PubMed] [Google Scholar]
- 4.Skaane P, Gullien R, Bjorndal H, et al. Digital breast tomosynthesis (DBT): initial experience in a clinical setting. Acta Radiol. 2012;53:524–9. doi: 10.1258/ar.2012.120062. [DOI] [PubMed] [Google Scholar]
- 5.Rafferty EA, Park JM, Philpotts LE, et al. Assessing radiologist performance using combined digital mammography and breast tomosynthesis compared with digital mammography alone: results of a multicenter, multireader trial. Radiology. 2013;266(1):104–13. doi: 10.1148/radiol.12120674. [DOI] [PMC free article] [PubMed] [Google Scholar]
- 6.Skaane P, Bandos AI, Gullien R, et al. Comparison of digital mammography alone and digital mammography plus tomosynthesis in a population-based screening program. Radiology. 2013;267:47–56. doi: 10.1148/radiol.12121373. [DOI] [PubMed] [Google Scholar]
- 7.Michell MJ, Iqbal A, Wasan RK, et al. A comparison of the accuracy of film-screen mammography, full-field digital mammography, and digital breast tomosynthesis. Clin Radiol. 2012;67:976–81. doi: 10.1016/j.crad.2012.03.009. [DOI] [PubMed] [Google Scholar]
- 8.Baker JA, Lo JY. Breast tomosynthesis: state-of-the-art and review of the literature. Acad Radiol. 2011;18(10):1298–310. doi: 10.1016/j.acra.2011.06.011. [DOI] [PubMed] [Google Scholar]
- 9.Helvie MA. Digital mammography imaging: breast tomosynthesis and advanced applications. Radiol Clin North Am. 2010;48:917–29. doi: 10.1016/j.rcl.2010.06.009. [DOI] [PMC free article] [PubMed] [Google Scholar]
- 10.Baldwin P. Digital breast tomosynthesis. Radiol Technol. 2009;81:57–74. [PubMed] [Google Scholar]
- 11. [March 30, 2013]; Available at: http://breasttomo.com/sites/default/files/010-WP-00060-Rev2_June2012-TomoWhitePaper.pdf.
- 12. [AccessedMarch 30, 2013]; Available at: http://www.accessdata.fda.gov/cdrh_docs/pdf8/P080003b.pdf.
- 13.Svahn T, Anderson I, Chakraborty D, et al. The diagnostic accuracy of dual-view digital mammography, single view breast tomosynthesis and dual-view combination of breast tomosynthesis and digital mammography in a free-response observer performance study. Radiat Prot Dosimetry. 2010;139:113–7. doi: 10.1093/rpd/ncq044. [DOI] [PMC free article] [PubMed] [Google Scholar]
- 14.Gur D, Adams GS, Chough DM, et al. Localized detection and classification of abnormalities on FFDM and tomosynthesis examinations rated under an FROC paradigm. AJR Am J Roentgenol. 2011;196:737–41. doi: 10.2214/AJR.10.4760. [DOI] [PubMed] [Google Scholar]
- 15.Wallis MG, Moa E, Zanca F, et al. Two-view and single-view tomosynthesis versus full-field digital mammography: high resolution X-ray imaging observer study. Radiology. 2012;262:788–96. doi: 10.1148/radiol.11103514. [DOI] [PubMed] [Google Scholar]
- 16.Noroozian M, Hadjiiski L, Rahnama-Moghadam S, et al. Digital breast tomosynthesis is comparable to mammographic spot views for mass characterization. Radiology. 2012;262:61–8. doi: 10.1148/radiol.11101763. [DOI] [PMC free article] [PubMed] [Google Scholar]
- 17.Bernardi D, Ciatto S, Pellegrini M, et al. Prospective study of breast tomosynthesis as a triage to assessment in screening. Breast Cancer Res Treat. 2012;133:267–71. doi: 10.1007/s10549-012-1959-y. [DOI] [PubMed] [Google Scholar]
- 18.Rose SL, Tidwell AL, Bujnoch LJ, et al. Implementation of breast tomosynthesis in a routine screening practice: an observational study. American journal of roentgenology. 2013;200(6):1401–8. doi: 10.2214/AJR.12.9672. [DOI] [PubMed] [Google Scholar]
- 19.Haas BM, Kalra V, Geisel J, et al. Comparison of tomosynthesis plus digital mammography and digital mammography alone for breast cancer screening. Radiology. 2013;269(3):694–700. doi: 10.1148/radiol.13130307. [DOI] [PubMed] [Google Scholar]
- 20.Conant EF, McCarthy AM, Kontos D, et al. Digital Breast Tomosynthesis in Combination with Digital Mammography Compared to Digital Mammography Alone: A Natural Experiment in General-Population Screening Outcomes in preparation. 2014 personal communications. [Google Scholar]
- 21.Poplack SP, Tosteson TD, Kogel CA, et al. Digital breast tomosynthesis: initial experience in 98 women with abnormal digital screening mammography. American Journal of Roentgenology. 2007;189(3):616–23. doi: 10.2214/AJR.07.2231. [DOI] [PubMed] [Google Scholar]
- 22.Tagliafico A, Astengo D, Cavagnetto F, et al. One-to-one comparison between digital spot compression view and digital breast tomosynthesis. Eur Radiol. 2012;22:539–44. doi: 10.1007/s00330-011-2305-1. [DOI] [PubMed] [Google Scholar]
- 23.Gennaro G, Toledano A, di Maggio C, et al. Digital breast tomosynthesis versus digital mammography: a clinical performance study. Eur Radiol. 2010;20:1545–53. doi: 10.1007/s00330-009-1699-5. [DOI] [PubMed] [Google Scholar]
- 24.Rafferty E, Niklason L, Halpern E, et al. Assessing radiologist performance using combined full-field digital mammography and breast tomosynthesis versus full-field digital mammography alone: results of a multi-center multi-reader trial. Presented at the Radiological Society of North America annual meeting; Chicago (IL). 2007. [Google Scholar]
- 25.Wald NJ, Murphy P, Major P, et al. UKCCCR multicentre randomized controlled trial of one and two view mammography in breast cancer screening. BMJ. 1995;311:1189–93. doi: 10.1136/bmj.311.7014.1189. [DOI] [PMC free article] [PubMed] [Google Scholar]
- 26.Rafferty E, Niklason L, Jameson-Meehan L. Breast tomosynthesis: one view or two?. Presented at the Radiological Society of North America annual meeting; Chicago (IL). 2006. [Google Scholar]
- 27.Gur D, Abrams GS, Chough DM, et al. Digital breast tomosynthesis: observer performance study. AJR Am J Roentgenol. 2009;193:586–91. doi: 10.2214/AJR.08.2031. [DOI] [PubMed] [Google Scholar]
- 28.Zuley ML, Bandoss AI, Ganott MA, et al. Digital breast tomosynthesis versus supplemental diagnostic mammographic views for evaluation of noncalcified breast lesions. Radiology. 2013;266:89–95. doi: 10.1148/radiol.12120552. [DOI] [PMC free article] [PubMed] [Google Scholar]
- 29.Brandt KR, Craig DA, Hoskins TL, et al. Can digital breast tomosynthesis replace conventional diagnostic mammography views for screening recalls without calcifications? A comparison study in a simulated clinical setting. AJR Am J Roentgenol. 2013;200(2):291–8. doi: 10.2214/AJR.12.8881. [DOI] [PubMed] [Google Scholar]
- 30.Waldherr C, Cerny P, Altermatt HJ, et al. Value of one-view breast tomosynthesis versus two-view mammography in diagnostic workup of women with clinical signs and symptoms and in women recalled from screening. AJR Am J Roentgenol. 2013;200(1):226–31. doi: 10.2214/AJR.11.8202. [DOI] [PubMed] [Google Scholar]
- 31.Hakim CM, Chough DM, Ganott MA, et al. Digital breast tomosynthesis in the diagnostic environment: a subjective side-by-side review. AJR Am J Roentgenol. 2010;195(2):172–6. doi: 10.2214/AJR.09.3244. [DOI] [PubMed] [Google Scholar]
- 32.Fornvik D, Zackrisson S, Ljungberg O, et al. Breast tomosynthesis: accuracy of tumor measurement compared with digital mammography and ultrasonography. Acta Radiol. 2010;3:240–7. doi: 10.3109/02841850903524447. [DOI] [PubMed] [Google Scholar]
- 33.Meacock LM, Mombelloni S, Iqbal A, et al. The accuracy of breast cancer size measurement: digital breast tomosynthesis (DBT0 vs. 2D digital mammography (DM)). Presented at the European College of Radiology annual meeting; Vienna (Austria). 2010. [Google Scholar]
- 34.Kopans D, Gavenonis S, Halpern E, et al. Calcifications in the breast and digital breast tomosynthesis. Breast J. 2011;17(6):638–44. doi: 10.1111/j.1524-4741.2011.01152.x. [DOI] [PubMed] [Google Scholar]
- 35.Spangler ML, Zuley M, Sumkin J. Detection and classification of calcifications on digital breast tomosynthesis and 2D digital mammography: a comparison. AJR Am J Roentgenol. 2011;196:320–4. doi: 10.2214/AJR.10.4656. [DOI] [PubMed] [Google Scholar]
- 36.Kopans DB, Rusby JE. Cutaneous caves and subcutaneous adipose columns in the breast: radiologic-pathologic correlation. Radiology. 2008;249(3):779–84. doi: 10.1148/radiol.2493080112. [DOI] [PubMed] [Google Scholar]
- 37.Feng SS, Sechopoulos I. Clinical digital breast tomosynthesis system: dosimetric characterization. Radiology. 2012;263:35–42. doi: 10.1148/radiol.11111789. [DOI] [PMC free article] [PubMed] [Google Scholar]
- 38.Gur D, Zuley ML, Anello MI, et al. Dose reduction in digital breast tomosynthesis (DBT) screening using synthetically reconstructed projection images: an observer performance study. Acad Radiol. 2012;19:166–71. doi: 10.1016/j.acra.2011.10.003. [DOI] [PMC free article] [PubMed] [Google Scholar]
- 39.Houssami N, Skaane P. Overview of the evidence on digital breast tomosynthesis in breast cancer detection. Breast. 2013;22(2):101–8. doi: 10.1016/j.breast.2013.01.017. http://dx.doi.org/10.1016/j.breast.2013.01.017. [DOI] [PubMed] [Google Scholar]
- 40. [Accessed March 21, 2013]; Available at: http://www.fda.gov/downloads/AdvisoryCommittees/CommitteesMeetingMaterials/MedicalDevices/MedicalDevicesAdvisoryCommittee/RadiologicalDevicesPanel/UCM328613.pdf.
- 41.Chan HP, Wei J, Zhang Y, et al. Computer-aided detection of masses in digital tomosynthesis mammography: comparison of three approaches. Med Phys. 2008;35:4087–95. doi: 10.1118/1.2968098. [DOI] [PMC free article] [PubMed] [Google Scholar]
- 42.Chan HP, Wei J, Sahiner Y, et al. Computer-aided detection system for breast masses on digital tomosynthesis mammograms: preliminary experience. Radiology. 2005;237:1075–80. doi: 10.1148/radiol.2373041657. [DOI] [PMC free article] [PubMed] [Google Scholar]
- 43.Singh S, Tourassi GD, Baker JA, et al. Automated breast mass detection in 3D reconstructed tomosynthesis volumes: a featureless approach. Med Phys. 2008;35:3626–36. doi: 10.1118/1.2953562. [DOI] [PMC free article] [PubMed] [Google Scholar]
- 44.Reiser I, Nishikawa RM, Giger ML, et al. Computerized mass detection for digital breast tomosynthesis directly from the projection images. Med Phys. 2006;33:482–91. doi: 10.1118/1.2163390. [DOI] [PubMed] [Google Scholar]
- 45.Reiser I, Nishikawa RM, Edwards AV, et al. Automated detection of microcalcification clusters for digital breast tomosynthesis using projection data only: a preliminary study. Med Phys. 2008;35:1486–93. doi: 10.1118/1.2885366. [DOI] [PMC free article] [PubMed] [Google Scholar]
- 46.Good WF, Abrams GS, Catullo VJ, et al. Digital breast tomosynthesis: a pilot observer study. AJR Am J Roentgenol. 2008;190:865–9. doi: 10.2214/AJR.07.2841. [DOI] [PubMed] [Google Scholar]
- 47.Bernardi D, Ciatto S, Pellegrini M, et al. Application of breast tomosynthesis in screening: incremental effect on mammography acquisition and reading time. Br J Radiol. 2012;85:1174–8. doi: 10.1259/bjr/19385909. [DOI] [PMC free article] [PubMed] [Google Scholar]
- 48. [Accessed March 21, 2013]; Available at: http://www.auntminnie.com/index.aspx?sec=sup&sub=wom&pag=dis&ItemID=102872&wf55368.
- 49.Mammography Quality Standard Act requirements. [Accessed March 21, 2013]; Available at http://www.fda.gov/radiationemittingproducts/mammographyqualitystandardsactandprogram/facilitycertificationandinspection/ucm243765.htm.
- 50. [Accessed March 21, 2013]; Available at: http://gm.acr.org/Hidden/Economics/FeaturedCategories/Pubs/coding_source/archives/MayJun2011/QA.aspx.
- 51. [Accessed March 21, 2013]; Available at: http://www.okbreastcare.com/tomo.html.
- 52. [Accessed March 21, 2013]; Available at: http://www.breastimaginghoustoncom/news.html.


