

ABSTRACT
We sought a new approach to treating infections by intracellular bacteria, namely, by altering host cell functions that support their growth. We screened a library of 640 Food and Drug Administration (FDA)-approved compounds for agents that render THP-1 cells resistant to infection by four intracellular pathogens. We identified numerous drugs that are not antibiotics but were highly effective in inhibiting intracellular bacterial growth with limited toxicity to host cells. These compounds are likely to target three kinds of host functions: (i) G protein-coupled receptors, (ii) intracellular calcium signals, and (iii) membrane cholesterol distribution. The compounds that targeted G protein receptor signaling and calcium fluxes broadly inhibited Coxiella burnetii, Legionella pneumophila, Brucella abortus, and Rickettsia conorii, while those directed against cholesterol traffic strongly attenuated the intracellular growth of C. burnetii and L. pneumophila. These pathways probably support intracellular pathogen growth so that drugs that perturb them may be therapeutic candidates. Combining host- and pathogen-directed treatments is a strategy to decrease the emergence of drug-resistant intracellular bacterial pathogens.
IMPORTANCE
Although antibiotic treatment is often successful, it is becoming clear that alternatives to conventional pathogen-directed therapy must be developed in the face of increasing antibiotic resistance. Moreover, the costs and timing associated with the development of novel antimicrobials make repurposed FDA-approved drugs attractive host-targeted therapeutics. This paper describes a novel approach of identifying such host-targeted therapeutics against intracellular bacterial pathogens. We identified several FDA-approved drugs that inhibit the growth of intracellular bacteria, thereby implicating host intracellular pathways presumably utilized by bacteria during infection.
INTRODUCTION
Despite the increasing resistance of pathogenic bacteria to antibiotics and the growing need for new antimicrobials, the development of novel therapeutics has slowed (1, 2). New broad-spectrum therapeutics that are safe, effective, and not vulnerable to the development of bacterial resistance are therefore highly desirable. Intracellular bacterial pathogens are often difficult to treat with conventional antibiotics. An alternative therapeutic approach is to perturb host pathways used by bacteria in various stages of their life cycle, namely, adhesion, entry, and growth. Our goal here was to discover drugs that perturb host cell targets and limit infection by intracellular pathogens. We refer to such agents as “host-directed antimicrobial drugs,” or HDADs. Such agents may have the additional benefit of reducing the development of resistance to conventional antibiotics.
We used four intracellular bacterial species to search for HDADs: Coxiella burnetii, Legionella pneumophila, Brucella abortus, and Rickettsia conorii. These are the causative agents of Q fever, Legionnaires’ disease, brucellosis, and Mediterranean spotted fever, respectively. We began our work with Coxiella burnetii, a common, readily dispersed pathogen that poses a risk to human populations in agricultural settings (3). C. burnetii resides in the acidic environment of modified phagolysosomes, where it requires multiple components of host trafficking pathways (4, 5).
We initially screened for HDADs that inhibit the entry and/or the intracellular growth of C. burnetii in THP-1 macrophage-like cells. We then determined which of these drugs limited the entry versus the intracellular growth of various other pathogens. While each of these organisms has a unique intracellular lifestyle, they probably depend on some of the same host functions. These include signaling proteins, organelle trafficking effectors, and metabolites that serve as nutrients (6–9). Indeed, we identified several FDA-approved, host-directed drugs that inhibit the intracellular growth of multiple pathogens. These drugs provide a foundation for the development of a novel class of antibacterial therapeutics.
RESULTS
Identification of drugs that block the intracellular growth of Coxiella burnetii.
We screened a library of 640 FDA-approved drugs (Enzo Life Sciences; BML-2842) for compounds that block the intracellular growth of C. burnetii in THP-1 cells. We assessed the intracellular growth of a C. burnetii NMII strain that constitutively expresses the mCherry fluorescent protein by measuring its red fluorescence (λ580 [excitation]/λ620 [emission]) over the course of 120 h. The fluorescence signal is proportional to the numbers of CFU and genome equivalents of C. burnetii and therefore is an accurate indicator of bacterial cell growth (Fig. S1). Initially, drugs were added 2 h before infection to identify compounds that blocked either the entry or the subsequent intracellular growth of the bacteria. The initial screen identified 158 compounds that reduced the final intracellular abundance of C. burnetii at 120 h by 80% or more.
To eliminate false positives due to host cell toxicity, we assayed cell viability by determining the cells’ ability to reduce 3-(4,5-dimethylthiazol-2-yl)-2,5-diphenyltetrazolium bromide (MTT). Using uninfected THP-1 cells, we found that 66 of the 640 test compounds showed a time-dependent decrease in viability over a period of 120 h (Fig. 1A; see also Fig. S2A and Table S1 in the supplemental material). We also used high-content image analysis to independently measure the cytotoxic effects of the drugs on C. burnetii-infected THP-1 cells. In this assay, we compared untreated and drug-treated cells for the percentage of the area in each microscopic field occupied by THP-1 cells fluorescently labeled by the cholesterol stain filipin. We found an additional 11 compounds to be cytotoxic, and these results correlated with the MTT data (Fig. S2B; Table S1). Figure 1B shows merged fluorescence images of the mCherry expressed by intracellular C. burnetii and filipin staining for a representative set of eight compounds. These eight compounds illustrate the results of the previous assays: no effect (moroxydine, glipizide), cytotoxicity (cyclosporine, quinacrine, and puromycin), and “hits” (amiodarone, loperamide, and bepridil). Hits are compounds that reduce intracellular growth by at least 80% but cause less than a 20% decrease in viability based on the Coxiella-containing vacuole (CCV) counts, MTT dye reduction, and relative mCherry fluorescence. That is, the hit compounds prevented the development of CCVs in the absence of cytotoxicity. Growth curves generated by measuring the accumulation of mCherry fluorescence in the presence of the eight representative compounds confirm growth inhibition. In total, we identified 112 compounds that inhibit the intracellular growth of C. burnetii with minimal cytotoxicity to host cells (Table S2).
FIG 1 .

Identification of antibacterial compounds that are nontoxic to host cells. (A) Six hundred forty FDA-approved drugs were first screened for their inhibition of the intracellular growth of bacteria in THP-1 cells. Then, they were screened to eliminate those toxic to THP-1 cells. Finally, host-acting compounds were identified by removing known antimicrobials. (B) Dual-fluorescence images of THP-1 cells treated with representative compounds. (Top) Agents with no effect on the intracellular C. burnetii growth or host cells; (middle) cytotoxic agents; (bottom) agents inhibiting bacterial growth but not cytotoxic. Each image represents the overlay of two fluorescence channels: 590/650 nm to detect mCherry-expressing C. burnetii and 340/380 nm to detect filipin-stained cell membranes. The pseudogreen color was used to visually improve the detection of C. burnetii. Scale bar, 100 µm. (C) Agents causing different degrees of inhibition of C. burnetii intracellular growth and host cell cytotoxicity. Circles, relative prevalence of Coxiella-containing vacuoles (CCVs); triangles, relative mCherry fluorescence; gray bars, relative viability at day 5; RFU, relative fluorescence units. (D) Effect of selected compounds on CCV size (area of individual CCV in each image). (E) Growth of C. burnetii in THP-1 cells treated with selected compounds at 33 µM. Intracellular bacterial abundance was followed over 5 days by the mCherry fluorescence of the bacteria.
Because our objective was to identify drugs that target host rather than bacterial functions, we ruled out compounds that act directly on the C. burnetii. We thus eliminated all drugs that were annotated as antibiotics, antifungals, antivirals, antiprotozoals, antimalarials, antituberculars, and antipneumocystics (Table S2). Nevertheless, most of the library compounds delivered at 33 µM, the concentration used for screening, decreased the growth of Coxiella in acidified citrate cysteine medium 2 (ACCM-2), an axenic medium (Table S3). ACCM-2 is an empirically derived nutrient-rich formulation containing high concentrations of l-cysteine and iron salts that supports C. burnetii metabolic activity in the absence of host cells. It is possible that some drugs react with medium components to generate toxic by-products and/or to diminish the availability of essential nutrients. These effects may not be relevant during C. burnetii growth in host cells, since most compounds that decrease C. burnetii growth in ACCM-2 had little or no effect on their growth in THP-1 cells. When retested at 10 µM, many of the 112 hit compounds no longer reduced axenic growth yet still inhibited intracellular growth (Table S3). Therefore, 75 host-targeting compounds were not cytotoxic but inhibited C. burnetii growth in THP-1 cells (Tables S2 and S3). The effect of these 75 compounds on the number and size of CCV, intracellular bacterial growth, and cell viability is shown in Fig. S3A. Nearly all of the agents decreased both the number and the size of C. burnetii CCV (Fig. S3B) and inhibited intracellular bacterial growth (Fig. S4A). Furthermore, each of these drugs inhibited C. burnetii growth not only in THP-1 but also in HeLa cells at 50% effective concentrations (EC50s) of 5 to 25 µM, that is, at lower concentrations than that used for screening, 33 µM (Fig. S4B to D). We infer that these compounds alter the physiology of THP-1 cells and thereby limit their ability to support C. burnetii infection or growth.
Host receptor signaling, calcium fluxes, and sterol homeostasis are required for C. burnetii intracellular growth.
To find out which host pathways are affected by the 75 hit compounds, we grouped them according to their annotations in the PubChem and DrugBank databases (10, 11). Most fell into three general categories: those that target G protein-coupled receptors (GPCRs), those that interfere with calcium transport, and those that target sterol homeostasis (Table 1). Nearly all of the agents that target GPCRs are antagonists of signaling receptors for acetylcholine, histamine, serotonin, dopamine, and other adrenergics, suggesting that cellular signaling pathways are required for the intracellular growth of C. burnetii. Utilization of host signaling pathways has previously been observed for several bacterial pathogens, including C. burnetii (12–15). In addition, the proper functions of several host kinases that are downstream effectors of these receptors are essential for the intracellular growth of L. pneumophila, a species closely related to C. burnetii (16). It is also possible that the agents that we identified do not act on GPCRs or that GPCRs support pathogen growth through novel actions distinct from their canonical functions (17–19).
TABLE 1 .
Nontoxic host-targeting inhibitors of four intracellular pathogensa
| Compound name | Therapeutic class | Inhibition |
Major pathway/target | |||
|---|---|---|---|---|---|---|
| Cb | Lp | Ba | Rc | |||
| Trifluoperazine⋅2HCl (205) | Antipsychotic | × | × | × | GPCRs/Ca | |
| Lomerizine (330) | Antimigraine | × | × | × | Ca | |
| Bepridil⋅HCl (12) | Antianginal | × | × | × | Ca | |
| Loperamide⋅HCl (16) | Antidiarrheal | × | × | × | GPCRs/Ca | |
| (+)-Butaclamol⋅HCl (93), aripiprazole (149), trifluperidol (637) | Antipsychotic | × | × | × | GPCRs/Ca | |
| Clemastine (130) | Antihistamine | × | × | × | GPCRs | |
| Nisoldipine (139) | Antihypertensive | × | × | × | GPCRs/Ca | |
| Mifepristone (620) | Abortifacient | × | × | S | ||
| Oxatomide (223) | Antiallergic | × | × | GPCRs | ||
| Amitriptyline⋅HCl (444) | Antidepressant | × | × | GPCRs | ||
| Chlorpromazine⋅HCl (95) | Antiemetic | × | × | GPCRs/Ca | ||
| Cyproheptadine (639) | Antihistamine | × | × | GPCRs/Ca | ||
| Trequinsin⋅HCl (609) | Antihypertensive | × | × | GPCRs/Ca | ||
| Bromocriptine mesylate (215) | Anti-Parkinsonian | × | × | GPCRs | ||
| Spiperone⋅HCl (107) | Antipsychotic | × | × | GPCRs/Ca | ||
| Dihydroergocristine (594) | Antivertigo | × | × | GPCRs | ||
| Finasteride (440) | Benign prostatic hypertrophy | × | × | S | ||
| Melengestrol acetate (622) | Progestogen | × | × | S | ||
| Fluoxetine (596) | Antidepressant | × | × | GPCRs/Ca | ||
| Verapamil (198), felodipine (202) | Antihypertensive | × | × | GPCRs/Ca | ||
| Naltrindole⋅HCl (105) | Opioid antagonist | × | × | GPCRs | ||
| Orphenadrine citrate (402) | Antispasmodic | × | × | GPCRs | ||
| Desloratadine (412) | Antihistamine | × | × | GPCRs | ||
| Donepezil⋅HCl (5) | Nootropic | × | GPCRs | |||
| Amiodarone⋅HCl (13) | Antiarrhythmic | × | IonC | |||
| Benzydamine (640) | Analgesic | × | Lipids | |||
| Suramin (256) | Anthelmintic | × | GPCRs | |||
| Flutamide (448) | Antiandrogen | × | GPCRs | |||
| Propafenone (24) | Antiarrhythmic | × | GPCRs | |||
| Ketotifen (587) | Antiasthmatic | × | GPCRs/Ca | |||
| Maprotiline⋅HCl (55), nisoxetine⋅HCl (56), mianserin⋅HCl (81), imipramine⋅HCl (113), amoxapine (114), escitalopram (153), citalopram (394) | Antidepressant | × | GPCRs/Ca | |||
| Domperidone (96), tropisetron (577) | Antiemetic | × | GPCRs | |||
| Danazol (410) | Antigonadotropin | × | S | |||
| Promethazine⋅HCl (103), loratadine (478) | Antihistamine | × | GPCRs | |||
| Nicardipine⋅HCl (14), naftopidil⋅2HCl (33), manidipine (135), lacidipine (140), propranolol S(−) (163), diltiazem (194), nimodipine (196), nitrendipine (197), cilnidipine (203), doxazosin (419), propranolol (540) | Antihypertensive | × | GPCRs/Ca | |||
| Dihydroergotamine mesylate (40) | Antimigraine | × | GPCRs | |||
| Lapatinib ditosylate (274), bicalutamide (305), toremifene (570) | Antineoplastic | × | HER, TK, GPCRs | |||
| Calcipotriene (283) | Antipsoriatic | × | Vitamin D | |||
| Haloperidol (67), quetiapine fumarate (111), clozapine (216), clothiapine (217), mesoridazine besylate (600) | Antipsychotic | × | GPCRs/Ca | |||
| Dipyridamole (227), cilostamide (602) | Antithrombotic | × | PDE | |||
| Canrenone (380) | Diuretic | × | S | |||
| Vardenafil (131) | Erectile dysfunction | × | PDE | |||
| Estradiol (428) | Estrogen | × | S | |||
| Naltriben methanesulfonate hydrate (118) | Opioid antagonist | × | GPCRs | |||
| Chlormadinone acetate (388), progesterone (523) | Progestogen | × | S | |||
| Cinanserin (592) | Serotonin antagonist | × | GPCRs | |||
| Flunarizine⋅2HCl (200) | Vasodilator | × | GPCRs/Ca | |||
| Fluspirilene (17) | Antipsychotic | × | × | GPCRs/Ca | ||
| (R)-(−)-Apomorphine⋅HCl (94) | Anti-Parkinsonian | × | GPCR | |||
| Carvedilol (164), telmisartan (558) | Antihypertensive | × | GPCRs/Ca, ATR/PPAR | |||
| Bleomycin (158), 5-fluorouracil (441) | Antineoplastic | × | DNA | |||
| Raloxifene (262) | Antiosteoporotic | × | S | |||
| Tolcapone (136) | Anti-Parkinsonian | × | COMT | |||
| Estriol (429), medroxyprogesterone 17-acetate (482), pregnenolone (527), megestrol acetate (621) | Estrogen/progestogen | × | S | |||
| Clomiphene (398) | Gonad stimulant | × | × | S | ||
| Dehydroepiandrosterone (411) | Adrenal hormone | × | S | |||
| Dexamethasone (226), clobetasol propionate (401), fluocinolone acetonide (446) | Anti-inflammatory | × | S, GCR | |||
| Doxofylline (421) | Bronchodilator | × | PDE | |||
| 17-Hydroxyprogesterone (463) | Progestogen | × | S | |||
| Prazosin⋅HCl (34) | Antihypertensive | × | GPCRs | |||
| Troglitazone (260) | Antidiabetic | × | PPAR | |||
| Mevastatin (254) | Antihyperlipidemic | × | HMG-CoA | |||
| Bexarotene (296) | Antineoplastic | × | RXR | |||
| Fluphenazine⋅2HCl (97) | Antipsychotic | × | GPCRs | |||
| Calcifediol (220) | Vitamin/antirachitic | × | Vitamin D | |||
Compound numbers are given in parentheses. The previously established therapeutic class and targeted pathway are given for each agent. Target pathways are abbreviated as follows: GPCR, G protein-coupled receptors; S, sterol/hormone; COMT, catechol-O-methyl transferase; PDE, phosphodiesterase; IonC, ion channel; GCR, glucocorticoid receptor; ATR, angiotensin receptor; PPAR, peroxisome proliferator-activated receptor; TK, tyrosine kinase; HER, human epidermal growth factors receptor; HMG-CoA, hydroxymethylglutaryl-CoA reductase; and RXR, retinoid X receptor. × represents >80% inhibition of the intracellular growth. Pathogens are abbreviated as follows: Cb, C. burnetii; Lp, L. pneumophila; Ba, B. abortus; and Rc, R. conorii.
To test the hypothesis that compounds targeting GPCRs, calcium, and sterol homeostasis interfere with C. burnetii intracellular growth, we also examined small molecules that are not included in the 640-compound FDA library but are known to target GPCRs. In particular, we tested a collection of GPCR agonists whose function is opposite to those of our GPCR antagonist hits. We observed that these agonists had no effect on C. burnetii intracellular growth. For example, while dopamine receptor antagonists from the FDA collection suppressed C. burnetii infection, 6,7-ADTN, a dopamine receptor agonist had no effect. Similarly, cholinergic receptor antagonists suppressed intracellular bacterial growth, while (±)-epibatidine, a cholinergic receptor agonist, had no effect. No effect was also observed for other GPCR agonists, including serotonin, 8-epi-prostaglandin F2, clonidine, and histamine, which stimulate serotonin, thromboxane, adrenergic, and histamine receptors, respectively (Table 2). In addition, we tested a number of kinase inhibitors, including those for protein kinase A (PKA), vascular endothelial growth factor receptor (VEGF-R; Flk-1) tyrosine, mitogen-activated protein (MAP), Syk, and Raf. These agents strongly attenuated C. burnetii intracellular growth without killing the THP-1 cells (Table 2). These data support the hypothesis that proper receptor kinase signaling is required for the successful growth of C. burnetii in THP-1 cells.
TABLE 2 .
Additional compounds that target signaling, calcium, and sterol/hormone homeostasis
| Target | Compound | Description | Cb growth inhibitiona |
|---|---|---|---|
| GPCR/kinases | Serotonin | Serotonin R agonist | No |
| 6,7-ADTN | Dopamine R agonist | No | |
| (±)-Epibatidine | Nicotinic cholinergin agonist | No | |
| Clonidine | Adrenergic R agonist | No | |
| Histamine | Histamine R agonist | No | |
| Prostaglandin F2a | Prostaglandin FP receptor agonist | No | |
| U-46619 | Thromboxane TP receptor agonist | No | |
| A-3 | Kinase inhibitors | Yes | |
| H-89 | Kinase inhibitors (PKA inhibitor) | Yes | |
| ML7 | Kinase inhibitors | Yes | |
| ML9 | Kinase inhibitors | Yes | |
| SU-4312 | Kinase inhibitors: VEGF-R (Flk-1) tyrosine kinase | Yes | |
| SB202190 | Kinase inhibitors (MAP kinase inhibitor) | Yes | |
| Piceatannol | Kinase inhibitors (Syk inhibitor) | Yes | |
| ZM336372 | Kinase inhibitors (Raf inhibitor) | Yes | |
| Genistein | Kinase inhibitors (tyrosine kinase inhibitor) | Yes | |
| Calcium | U-50488 | Ca channel blocker | Yes |
| E6 berbamine | Calmodulin inhibitor | Yes | |
| (R)-(+)-BAY K-8644 | Ca channel blocker | Yes | |
| Thapsigargin | Ca-ATPase inhibitor | Yes | |
| Sterol/hormones | RHC-80267 | DAG lipase inhibitor | Yes |
| BW-B 70C | 5-Lipoxygenase inhibitor | Yes | |
| NS-398 | Cox-2 inhibitor | Yes | |
| AA-861 | 5-Lipoxygenase inhibitor | Yes |
Compounds not included in the original FDA library were tested for inhibition of C. burnetii intracellular growth in THP-1 cells treated at various concentrations (3 to 149 µM) of agent. “Yes” denotes compounds that inhibited C. burnetii intracellular growth by >80% at concentrations ranging between 21 and 68 µM. No, no effect; DAG, diacylglycerol.
Identification of compounds that decrease the intracellular growth of other bacterial pathogens: Legionella pneumophila, Brucella abortus, and Rickettsia conorii.
To search for host-directed inhibitors of the entry or growth of intracellular pathogens other than C. burnetii, we screened the FDA library using L. pneumophila, B. abortus, and R. conorii. We found 56 noncytotoxic compounds that inhibited the intracellular growth of mCherry-expressing L. pneumophila by more than 80% in THP-1 cells over a period of 72 h. Thirty-two of these compounds act on the host cells, while the remaining 24 target the pathogens (Fig. 2A; Tables 1 and S2). The majority of the 32 host-active compounds are annotated as targeting GPCR signaling, calcium, and sterol/hormone homeostasis in Table 1.
FIG 2 .
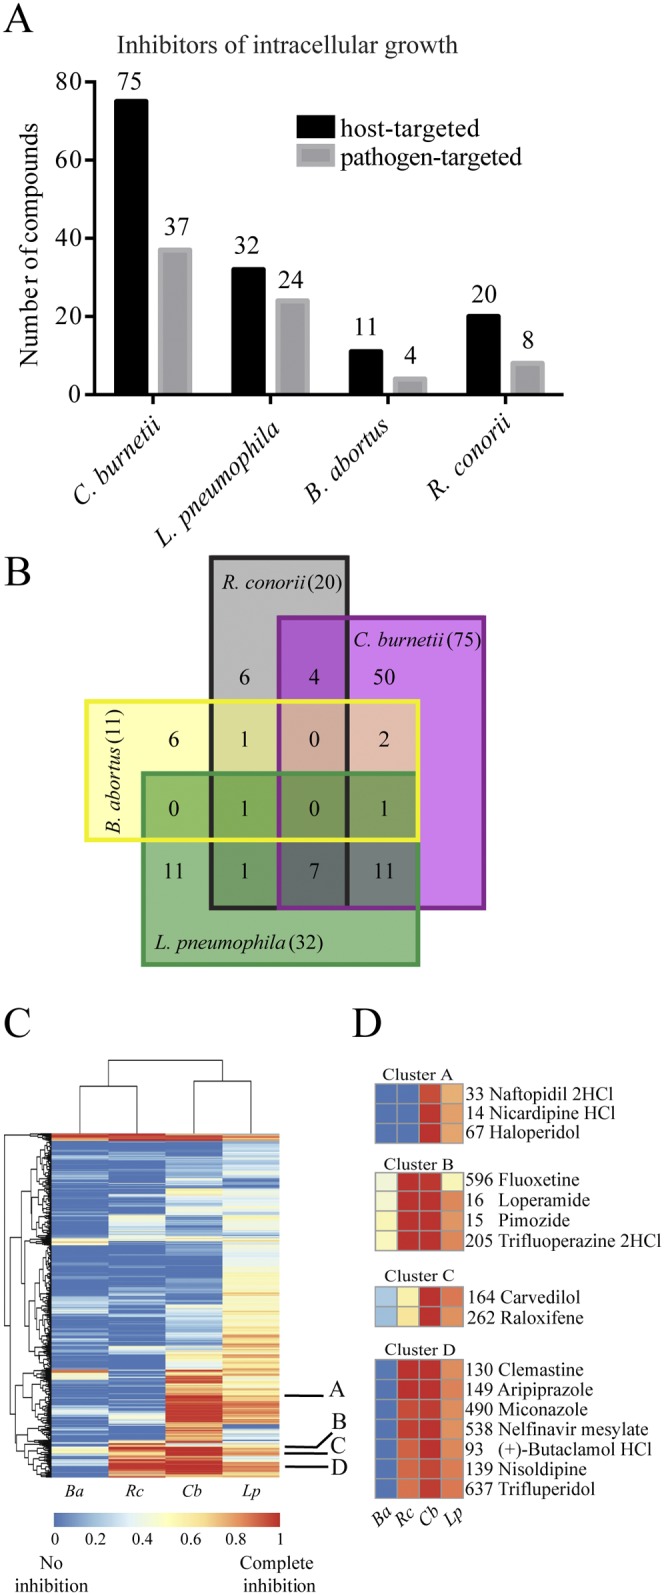
Effects of drugs on four intracellular pathogens. (A) Numbers of drugs (in the starting library of 640) that caused >80% inhibition of the intracellular growth of C. burnetii, L. pneumophila, and R. conorii or >50% inhibition of B. abortus. Black bars represent host-targeted compounds, while the gray bars represent pathogen-targeted compounds, including antibiotics, antifungals, antivirals, antiprotozoals, antimalarials, antituberculars, and antipneumocystics. (B) Venn diagram of numbers of overlapping compounds among the 101 most effective host-targeting compounds inhibiting the intracellular growth of four pathogens. The values in the squares give the numbers of compounds that affect the indicated organisms, while the numbers in parentheses in the four sectors of the diagram give the sums of the values for the overlapping compounds for each organism. (C) Heatmap generated using hierarchical clustering of inhibitory efficiencies of all compounds from the library. Blue denotes no inhibition, and red denotes complete inhibition. Labels A to D indicate the representative clusters of hits shown in panel D. Ba, B. abortus; Rc, R. conorii; Cb, C. burnetii; Lp, L. pneumophila. (D) Closeup heatmaps of clusters A to D from panel C. Compound numbers are shown next to each name.
Only one compound, the antibiotic azithromycin, inhibited the intracellular growth of mCherry-expressing B. abortus by more than 80%. However, 15 other compounds inhibited its growth by more than 50%. Four of these have known antibiotic activities, and the remaining 11 may potentially act on host cell functions (Fig. 2A; Tables 1 and S2). Fluorescent strains of R. conorii are not available, so we relied on an immunofluorescence assay to assess the organism’s growth in THP-1 cells (20). Twenty-eight noncytotoxic compounds inhibited the intracellular growth of R. conorii by more than 80% at 72 h following infection. Eight of these are known to target the pathogen, and the remaining 20 are likely to act on host functions (Fig. 2A; Tables 1 and S2). Notably, most of these 20 compounds act upon GPCR signaling and calcium homeostasis, but some also target the peroxisome proliferator-activated receptor, the retinoid X receptor, vitamin D metabolism, and hydroxymethylglutaryl coenzyme A (CoA) reductase (Table 1). These other pathways may reflect the fact that R. conorii replicates in the cytosol rather than in a vacuole, as do the other three bacterial species. We conclude that GPCR signaling and calcium fluxes may be involved in the entry or intracellular growth of all four bacterial species studied. Other pathways may possibly be utilized by individual species.
HDADs can be grouped into functional and structural clusters.
Many drugs inhibited more than one of the four pathogens, as shown in the Venn diagram in Fig. 2B and listed in Table 1. For example, 11 out of 32 compounds that were effective against L. pneumophila were also effective in inhibiting C. burnetii. Seven compounds (bepridil, loperamide, butaclamol, aripiprazole, trifluperidol, clemastine, and nisoldipine) inhibited three pathogens, C. burnetii, L. pneumophila, and R. conorii, while inhibition of C. burnetii and R. conorii occurred with fluoxetine, verapamil, felodipine, and naltrindole (Fig. 2B). We then compared the inhibitory effects of groups of hits on the four pathogens using clustering analysis. Because the clustering analysis was performed with all of the data, including results for cytotoxicity and antibiotics, we found that the majority of drugs that strongly inhibited the intracellular growth of all four bacterial species either were toxic to the host cells or were known antibiotics. However, clusters A to D in Fig. 2D suggest that certain drugs have no cytotoxicity against THP-1 cells and no known antimicrobial activity. In particular, cluster B includes compounds that blocked the growth of all four of the pathogens to some degree. The other clusters suggest noncytotoxic and nonantimicrobial agents that were effective in inhibiting at least two pathogens. We also found that compounds that inhibited C. burnetii were more likely to affect L. pneumophila than the other two pathogens, suggesting that these species might utilize common host pathways (Fig. 2C). This was unexpected, given the very different properties of the L. pneumophila and C. burnetii vacuoles; it may reflect, however, their close phylogenetic relationship and/or similar nutritional requirements.
In total, we identified 101 noncytotoxic and nonantimicrobial drugs that at least partially inhibited the intracellular growth of one or more of the four pathogens. To determine whether these compounds are structurally related, we extrapolated the two-dimensional (2D) Tanimoto similarity score using the Chemical Structure Clustering Tool available through PubChem (11). We found that the compounds generally fell into one of seven major groups (Fig. S5). Structure cluster 1 contains 15 sterol-like compounds that inhibit the growth of all four intracellular pathogens. Structure cluster 2 contains eight dihydropyridine calcium channel blockers that predominantly affect C. burnetii growth. Structure cluster 5 contains four thioxantine-containing compounds (trifluoperazine, fluphenazine, promethazine, chlorpromazine) that strongly inhibit most of the four pathogens. Structure cluster 5 also contains compounds with dibenzocycloheptene structures (cyproheptadine and amitriptyline) that inhibit the intracellular growth of both C. burnetii and L. pneumophila. Finally, structure cluster 7 contains 4-phenyl piperidine-containing hit compounds, such as loperamide, haloperidol, and trifluperidol. Thus, many of the HDADs fall into groups with shared chemical features.
Disruption of cholesterol trafficking blocks the intracellular growth of C. burnetii and L. pneumophila.
The requirement for host cholesterol during infection by a number of bacterial species, including C. burnetii and Brucella spp., has been previously observed (21–27). Because several of the FDA drugs that block C. burnetii intracellular growth are annotated as inhibitors of cholesterol homeostasis, we screened the FDA library for drugs that alter intracellular cholesterol distribution. To do this, we imaged cell membrane cholesterol with the sterol-specific fluorescent stain filipin. We performed this screen not only on THP-1 cells but also on HeLa cells because of their superior filipin imaging. Under normal conditions, cholesterol is localized largely to the plasma membrane, but many compounds promote its accumulation in endolysosomal vesicles. One such compound, U18666A, an inhibitor of cholesterol transport, served as a positive control; it clearly decreased filipin staining at the plasma membrane and increased filipin staining of endosomal vesicles in both THP-1 and HeLa cells (Fig. S6A).
Sixty-two members of the FDA drug library affected the distribution of cholesterol in HeLa and THP-1 cells in a manner similar to that of U18666A (Fig. 3A; Table S4). Many of these 62 compounds were not previously known to alter cholesterol distribution. The majority of these agents were noncytotoxic in the MTT assay. Surprisingly, 57 of these 62 compounds completely inhibited the intracellular growth of C. burnetii (Fig. 3B). The five drugs that had no effect on C. burnetii have structures closely related to that of cholesterol (Fig. 3C). Many of the cholesterol-directed compounds were less effective on L. pneumophila and even less so on R. conorii; most had little effect on B. abortus (Fig. S6B). We infer that several classes of compounds that perturb cholesterol distribution block intracellular multiplication, particularly of C. burnetii.
FIG 3 .

Effect of cholesterol perturbation on the intracellular growth of C. burnetii. (A) HeLa cells treated for 24 h with representative compounds at 33 µM and then fixed and stained for cholesterol with filipin. Grayscale was inverted for better visualization. Scale bar, 100 µm. (B) Effects of 62 cholesterol-disrupting compounds on C. burnetii intracellular growth measured by fluorescence (relative to that of DMSO-treated control cells). (C) Chemical structures of cholesterol and 5 of the 62 compounds that perturbed cholesterol but not C. burnetii growth.
To independently evaluate the role of cholesterol trafficking in the intracellular growth of C. burnetii, we constructed THP-1 cell lines with decreased levels of NPC-1, a transporter that facilitates the export of cholesterol from late endosomes and lysosomes. We found that reducing the expression of NPC-1 decreased the intracellular growth of C. burnetii (Fig. 4A and B). We infer that the intracellular movement of cholesterol is a key determinant of C. burnetii growth that can be interrupted by a wide variety of FDA-approved drugs.
FIG 4 .
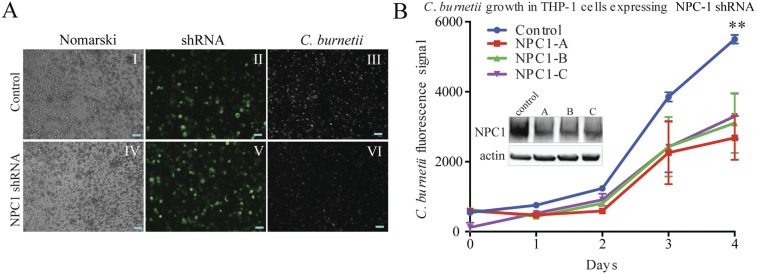
Genetic disruption of cholesterol homeostasis inhibits the intracellular growth of C. burnetii. (A) Images of NPC-1 shRNA-mediated inhibition of intracellular C. burnetii. Panels I and IV show Nomarski images of control (empty-vector shRNA) THP-1 cells and cells transfected with NPC-1 shRNA. Panels II and V show fluorescence signals generated from the shRNA vector. Panels III and VI show intracellular C. burnetii. For direct comparison of fluorescence signals, images were taken at a constant exposure. Scale bars, 100 µm. (B) Growth curve of C. burnetii in THP-1 cells transfected with the control and three different constructs of NPC-1 shRNA. Western blot of NPC-1 levels relative to those in an actin control in cells transfected with NPC-1 shRNA constructs and control shRNA.
Do HDADs block pathogen entry or intracellular multiplication?
In the foregoing studies, drugs were added to cells prior to infection. In order to determine whether the compounds prevent pathogen uptake or subsequent growth, we examined the effects of adding the compounds 4 h after infection. A strong correlation was observed between the levels of inhibition of intracellular growth when the compounds were added before and after infection (Fig. 5A), suggesting that the effect of most agents is on growth rather than entry. The correlation was strongest for C. burnetii. In contrast, we found that for L. pneumophila and, especially, B. abortus, several agents were more effective when added prior to, rather than after, infection, suggesting that they block pathogen entry. We therefore grouped agents showing similar effects on pathogen growth when applied pre- and postinfection using K-means complete clustering (K = 20). Clustering highlighted the differences between the effects of the two groups of agents (Fig. 5B). The relative inhibitory effects of these drugs are presented in Fig. 5C. For C. burnetii, cluster 8 contains 12 drugs that were significantly more effective when added before rather than after infection (Fig. 5C, top). In the case of L. pneumophila, cluster 11 contains 17 drugs that exceeded 60% inhibition of intracellular growth when applied prior to infection but had little effect when applied postinfection (Fig. 5C, middle). Similarly, for B. abortus, the compounds in clusters 1 and 14 were highly inhibitory prior to infection but not afterward. Three of these drugs, vincristine sulfate, albendazole, and disulfiram, are known inhibitors of microtubule polymerization (28–30). Indeed, inhibitors of microtubules have been shown to block the internalization of B. abortus (31). We infer that some agents in each cluster inhibit bacterial entry. For therapeutic applications, interest should be focused on the most potent drugs that act after infection, in particular, HDADs that inhibit a broad range of bacterial species. These include trifluoperazine, lomerizine, bepridil, loperamide, butaclamol, aripiprazole, trifluperidol, clemastine, and nisoldipine.
FIG 5 .

Identification of compounds that affect microbial entry. (A) Graphs representing correlations between efficiencies of drug inhibition of the intracellular bacterial growth of C. burnetii, L. pneumophila, and B. abortus when the drug was applied preinfection and postinfection. (B) Heatmaps generated by binning (K-means = 20) hierarchical cluster analysis results for the efficiency of drugs pre- versus postinfection. The color scale ranges from 0 (blue, no inhibition) to 1 (red, complete inhibition). (C) Bar graphs representing compounds from clusters with the highest difference in inhibition between the pre- and postinfection treatments. Inhibition values <1 were set to 1, and values <0 were set to 0.
DISCUSSION
This study identified drugs that strongly inhibit the intracellular growth of bacterial pathogens by targeting host cells. We screened a small library of FDA-approved drugs because there is considerable information about their properties. Furthermore, if any were found to be effective in vitro, they could be applied in vivo without significant toxicity. We found that many compounds blocked the growth of one or more of four bacterial species. We established systematic methods for measuring the intracellular growth of bacteria that can be applied to other species and even to viruses and parasites.
We were surprised to find a large number of host-directed antimicrobial drugs (HDADs) among the 640 compounds in the FDA library. Others have reported individual instances of host-targeted compounds that interfere with infection by a variety of pathogens, many of which were also found in the work reported here (Table 3). The actions of these HDADs might reflect their known activities or secondary or even off-target effects. For example, the ability to alter the cellular distribution of cholesterol was not previously reported for most of the 62 agents with this activity. Many of the HDADs could be grouped based on their known targets. Our results confirm earlier work demonstrating the effectiveness of calcium-targeting compounds against infection by the intracellular pathogen Neorickettsia risticii (32). Several GPCR antagonists, but not agonists, were inhibitory of bacterial growth, as were drugs that interfere with kinase signaling pathways and calcium homeostasis. Although the functions of host signaling pathways in promoting or limiting intracellular pathogens has been studied extensively, the roles of individual GPCRs are not known. HDADs targeting GPCRs may provide new information about host cell pathways important for certain pathogens.
TABLE 3 .
Cross-reference for drugs with published reports on their effectiveness in inhibiting a broader spectrum of pathogensa
| Pathogen group | Organism | Compound(s) | Model(s) | Reference(s) |
|---|---|---|---|---|
| Bacteria | Listeria monocytogenes | Pimozide, flunarizine⋅2HCl, thioridazine, trifluoperazine⋅2HCl, fluphenazine⋅2HCl, amiodarone⋅HCl, bepridil⋅HCl, tamoxifen, clomiphene citrate, floxuridine, celecoxib | TC | 43, 44 |
| Anaplasma phagocytophilum | Imipramine, imatinib, nystatin | TC | 23, 45, 46 | |
| Neorickettsia risticii | Verapamil, diltiazem, flunarizine, nifedipine, chlorpromazine, trifluoperazine | TC | 32 | |
| Bacillus subtilis | Pimozide | TC | 43 | |
| Salmonella enterica serovar Typhimurium | Pimozide, nifedipine, chlorpromazine⋅HCl | TC, AM | 43, 47, 48 | |
| Escherichia coli | Pimozide, finasteride | TC, AM | 43, 49 | |
| MRSA | Thioridazine, chlorpromazine⋅HCl | TC | 50 | |
| Mycobacterium tuberculosis | Thioridazine, vitamin D, imatinib, verapamil, | Patients, TC, AM | 51–57 | |
| Vibrio cholerae | Lacidipine | AM | 58 | |
| Pseudomonas aeruginosa | Raloxifene | AM | 59 | |
| Chlamydia pneumoniae | Verapamil, nifedipine | TC | 47, 60 | |
| C. burnetii | 17-Beta-estradiol | AM | 61 | |
| Viruses | VSV | Donepezil⋅HCl | TC | 62, 66 |
| HIV | Vitamin D, citalopram | TC | 54, 63 | |
| EBV | Haloperidol, trifluoperazine⋅2HCl, chlorpromazine⋅HCl, promethazine⋅HCl | TC | 64 | |
| HBV | Chlorpromazine⋅HCl | TC | 65 |
We propose two general and testable hypotheses for the actions of HDADs. First, some may bind to their known targets and alter host cell physiology in the anticipated manner. Second, the physicochemical properties of a drug might result in “off-target” effects producing changes in the host cell that limit pathogen growth or survival. There are well-known instances of these effects among commonly prescribed drugs. For example, phospholipidosis can be induced by cationic amphiphiles that accumulate in the acidic milieu of lysosomes (33). There, such agents can inhibit acid sphingomyelinase, and some of them may have broad clinical applications through altering lysosomal function (34, 35). Finally, many drugs that are “promiscuous inhibitors” of enzymes or GPCRs share properties that lead to colloidal aggregation (36, 37). Although these properties may confound detailed biochemical analyses, they might produce beneficial effects in vivo and alter cell physiology so that the intracellular growth of pathogens is decreased. These inadvertent, nonspecific effects may confer broad inhibition of a variety of intracellular pathogens. Further studies on subsets of the compounds identified in this work will be required to distinguish among these possible mechanisms.
MATERIALS AND METHODS
Bacterial strains and media.
All studies on live B. abortus and R. conorii were performed in a biosafety level 3 (BLS-3) facility at the University of Chicago, Howard Taylor Ricketts Regional Biocontainment Laboratory, according to U.S. select-agent regulations. C. burnetii Nine Mile Phase II (NMII) RSA439 (mCherry) is an RG-2 strain that is exempt from U.S. select-agent regulations. It was grown in acidified citrate cysteine medium 2 (ACCM-2) or solid ACCM-2 at 2.5% O2 (38). Six-day-old cultures were used for experiments. The abundance of bacteria was assessed by their optical density at 600 nm (OD600), and OD600s were normalized to C. burnetii-equivalent genomes determined by quantitative PCR and to numbers of CFU of bacteria grown on solid ACCM-2. L. pneumophila strain JR32 carrying the plasmid vector pXDC50 expressing mCherry fluorescent protein under an isopropyl-β-d-thiogalactopyranoside (IPTG)-inducible Ptac promoter, was grown on N-(2-acetamido)-2-aminoethanesulfonic acid-buffered charcoal yeast extract (ABCYE) medium plates containing chloramphenicol (5 µg/ml) and then streaked on ABCYE plates containing chloramphenicol and 0.5 mM IPTG to induce expression of mCherry (39). B. abortus mCherry was generated from the wild-type B. abortus 2308 parent strain by integration of a mini-Tn7 plasmid expressing mCherry (the mini-Tn7 plasmid was a gift of H. P. Schweizer). B. abortus was grown overnight in suspension in tryptic soy broth, centrifuged, and resuspended to 1 × 10⁹ CFU/ml in RPMI 1640 (Gibco) prior to infection. R. conorii Malish7 was grown in Vero cells and released by needle shearing; the bacteria were purified by sucrose density gradient centrifugation prior to use (9, 20).
Cell culture.
All cell lines were grown at 37°C in a humidified environment with 5% CO2. THP-1 macrophage-like cells were grown to a maximum density of 1 × 10⁶/ml in complete RPMI 1640 medium supplemented with 1% penicillin-streptomycin (GIBCO), 2 mM glutamine (GIBCO), and 10% heat-inactivated fetal bovine serum (FBS; HyClone). HeLa cells were cultured in Dulbecco’s modified Eagle’s medium (DMEM; GIBCO) supplemented with 2 mM glutamine and 1% penicillin-streptomycin plus 10% heat-inactivated fetal bovine serum. Vero cells were cultivated in DMEM supplemented with 1× nonessential amino acids (Mediatech) and 0.5 mM sodium pyruvate (Lonza).
Drugs and reagents.
The 640 compounds used in the screens were obtained from the Screen-Well FDA-approved drug library and provided as 10 mM stock solutions in dimethyl sulfoxide (DMSO; BML-2842; Enzo Life Sciences). Additional compounds were obtained from the Screen-Well ICCB Known Bioactives Library as 5 mg/ml or 1 mM stock solutions in DMSO (Enzo Life Sciences, BML02840-0100). Filipin and U18666A were dissolved in DMSO (Sigma-Aldrich).
General method for screening inhibition of intracellular bacterial growth.
Two days prior to infection, THP-1 cells (100-µl aliquots at 1 × 10⁶ cells/ml) were placed in the wells of 96-well plates (3904; Costar) and differentiated with 40 ng/ml phorbol myristate acetate (PMA). The plates were incubated in a humidified incubator at 37°C under 5% CO2. The medium overlying the confluent cell monolayers was replaced with Advanced RPMI-1640, and drugs were added to 33 µM (final concentration) at a specified time prior to or following infection. After the addition of bacteria, the plates were centrifuged at 2,170 rpm for 10 min to promote infection.
Screen for inhibition of Coxiella burnetii intracellular growth.
The growth medium was replaced with advanced RPMI 1640. Drugs were added to the monolayers at 33 µM (final concentration) 2 h prior to infection or 4 h after infection. Bacteria were added at a multiplicity of infection (MOI) of 20 for THP-1 cells and at an MOI of 100 for HeLa cells. The intracellular growth of C. burnetii was assessed by the fluorescence of the constitutively expressed mCherry protein using a Tecan Infinite M200 PRO fluorescence plate reader with 580-nm excitation and 620-nm emission (40).
Screen for inhibition of Legionella pneumophila intracellular growth.
On the day of screening, the medium overlying THP-1 cells was replaced with 100 µl of complete CO2-independent medium (complete CO2IM; Gibco) and the plates were preincubated for 2 h prior to infection in complete CO2-independent medium containing drugs at 33 µM (final concentration; 0.3% DMSO). L. pneumophila cells were resuspended in CO2-independent medium, and each well was infected with 10 µl of a bacterial suspension that yielded an MOI of 10. After centrifugation at 2,170 rpm for 10 min to promote infection, the plates were incubated for 3 days at 37°C, and mCherry fluorescence was measured.
Screen for inhibition of Brucella abortus intracellular growth.
One day prior to infection, B. abortus 2308 was grown from frozen stocks in tryptic soy broth in a shaking incubator at 37°C, washed, and added at an MOI of 100 to wells of THP-1 cells containing either 33 µM drug (preinfection treatment) or no drug (postinfection treatment). The plates were centrifuged to synchronize infection and then incubated for 1 h at 37°C. At that time, 50 µg/ml gentamicin was added for 30 min to kill extracellular but not intracellular bacteria. The cells were further washed and incubated in fresh medium containing 25 µg/ml gentamicin. At this point, 33 µM drug was added to the postinfection treatment set. Cells were incubated for 3 days before fluorescence was determined.
Screen for inhibition of Rickettsia conorii intracellular growth.
Drugs were added 30 min prior to infection of THP-1 cells with R. conorii at an MOI of 2.5. The plates were centrifuged at 500 × g for 5 min. After 3 days at 37°C (to mid-log phase), the monolayers were fixed with paraformaldehyde and permeabilized with 0.1% Triton X-100. R. conorii were detected with 1 µg/ml anti-OmpB (5C7.31) followed by Alexa Fluor 488 goat anti-mouse IgG (20). Fluorescent antibody binding was measured using a Tecan Infinite M200 Pro microplate reader with 488-nm excitation and 525-nm emission.
Colorimetric MTT cytotoxicity assay.
Reduction of MTT [3-(4.5-dimethylthiazol-2-yl)-2.5-diphenyltetrazolium bromide] was used as an index of cell viability. MTT was added to wells at a final concentration of 0.5 mg/ml, and the cells were incubated for 4 h at 37°C in a humidified incubator at 5% CO2. The medium was replaced with 100 µl isopropyl alcohol containing 40 mM HCl and 20 µl of 10% sodium dodecyl sulfate (SDS) (to solubilize precipitated serum protein). Absorbance of the reaction product was measured at 570 nm in a Tecan Infinite 200 Pro microplate reader.
High-content cell imaging.
Cells were imaged in an ultrathin glass bottom 96-well plate (655090; Greiner) at the University of Chicago Cellular Screening Center using the ImageXpress high-content screening system integrated with a Thermo F3 robotic arm. Images were acquired at a ×20 magnification at constant exposure. Two- to 4-fold field coverage was imaged for each condition and analyzed using ImageJ (41). All images were visually screened for imaging artifacts.
Cholesterol staining.
HeLa cells were allowed to attach overnight to wells. THP-1 cells were differentiated with PMA for 48 h prior to drug treatment. Fresh medium and compounds were added at a final concentration of 10 to 50 µM, and the cells were further incubated for 24 h. Cells were then washed twice with phosphate-buffered saline (PBS) and incubated for 10 min at room temperature on a rotating platform with 100 µl of 4% paraformaldehyde (Thermo Scientific). The fixed cells were washed with PBS and incubated with filipin (F9765; Sigma-Aldrich) at 50 µg/ml for 1 h in the dark and washed again before storage at 4°C prior to imaging.
High-content cytotoxicity assay.
Cytotoxicity to THP-1 cells infected with C. burnetii was estimated 5 days after addition of drugs from the relative reduction of cell numbers. Filipin staining of their cholesterol was used to visualize cells by fluorescence imaging using the ImageXpress high-content screening system at a ×20 magnification. Cytotoxicity was estimated from the fractional coverage of well bottoms with cells, relative to the coverage of well bottoms with nontreated infected controls. Images were analyzed by the batch protocol using an ImageJ macro. All images were visually screened for imaging artifacts.
Coxiella-containing vacuole count.
Coxiella-infected cells were treated with test agents for 5 days prior to being imaged. ImageJ analysis was then used to count the number and size distribution of the intracellular vacuoles therein. Images were analyzed by the batch protocol using an ImageJ macro. The threshold for vacuole detection was set between 20 and 255 grayscale. The sizes of particles for analysis were set between 200 and infinity, and their circularity was set between 0.6 and 1.0.
Fluorescence imaging.
Live-cell imaging was done using the Olympus IX-81 motorized inverted microscope equipped with the X-Cite series 120Q wide-field fluorescence excitation light source (EXFO). Cells were imaged using 10×/0.3 and 20×/0.45 LUCPLFLN objectives. Images were captured using an Olympus DP72 camera with cellSens imaging software v1.8.1 (Olympus).
Lentivirus production.
Phoenix cells and the helper plasmids pMD.G and pCMVR8.91 were kind gifts of Jose Silva, Columbia University, New York, NY. The 3 GIPZ lentiviral human NPC-1 short hairpin RNA (shRNA) constructs used in this study were obtained from Open Biosystems (Thermo-Scientific). Phoenix cells were grown in DMEM supplemented with glutamine and 10% FBS. Twenty-four hours prior to transfection, Phoenix cells were plated to achieve 50 to 70% confluence on the day of transfection. Transfection was as described by the manufacturer’s instructions (42) (jetPEI Polyplus transfection; VWR, Chicago, IL). Briefly, helper plasmids pMD.G and pCMVR8.91 were mixed together with the GPIZ NPC-1 shRNA plasmid in the presence of the DNA transfection reagent jetPEI, and the mixture of DNA and jetPEI was placed on the cells. Media containing lentivirus was collected after 48 h and passed through a 0.45-µm filter.
NPC-1 knockdown.
THP-1 cells were infected with lentivirus carrying an shRNA vector and a green fluorescent protein (GFP) marker. One milliliter of THP-1 culture was dispensed into 6-well plates at 5 × 10⁵ cells/well, followed by addition of 1 ml of virus suspension (mixed with Polybrene, 4 µg/ml). The plates were centrifuged at 200 × g for 1 h at room temperature and then incubated at 37°C under 5% CO2 for 6 h. Cells were centrifuged at 300 × g for 10 min, washed to remove Polybrene and small debris, and resuspended in complete advanced RPMI 1640 medium, and the incubation continued. Medium was removed from the infected cells after 24 h, and fresh medium was added. Cells were collected by centrifugation at 300 × g for 10 min at room temperature, and the cell pellet was resuspended in 500 µl PBS containing 2% serum. The suspension was filtered through a cell strainer (40-µm nylon; BD-Falcon); the GFP-positive THP-1 cells were isolated by flow cytometry and grown in complete advanced RPMI 1640. The NPC-1 shRNA knockdown cells were differentiated with PMA, analyzed by Western blotting for expression of NPC-1 protein, and analyzed for L. pneumophila infection as previously described.
Western blots.
Western blot analysis was performed on cell extracts (3 × 10⁵ cell equivalents) boiled in SDS sample buffer and run on 4 to 20% polyacrylamide precast gels (Bio-Rad). The blot was incubated in the presence of rabbit anti-NPC-1 monoclonal antibody (1:1,000; EPR5209; Abcam) followed by a 2-h incubation with horseradish peroxidase (HRP)-conjugated anti-rabbit secondary antibody (1:500; Amersham Life Science). The signal was detected by its chemiluminescence (SuperSignal West Femto maximum-sensitivity substrate; Thermo Scientific).
Cluster analysis.
Inhibitory efficiencies of all drugs against each of the four bacterial species were scaled 0 to 1 before cluster analysis. Complete linkage hierarchical clustering was performed using the University of Chicago Center for Research Informatics Web interface specifically designed for our data set (https://biocore.cri.uchicago.edu/). The K-means clustering algorithm was applied to data generated from pre- versus post-infection treatment.
Statistical analysis.
Screens were done two or three times, except for R. conorii. Growth inhibition was normalized to control cells treated with DMSO only; standard deviations (SD) are given for 3 experiments. The EC50s (50% effective concentrations) of selected compounds were calculated using GraphPad Prism software. The molecular-structure Tanimoto similarity score of compounds was obtained using the Chemical Structure Clustering Tool. A Tanimoto similarity score of less than 0.68 was considered statistically significant (P < 0.05).
SUPPLEMENTAL MATERIAL
Correlation of expressed mCherry fluorescence with the growth of C. burnetii. Fluorescence signal intensity correlation with CFU and genome equivalents determined by bacterial plating and quantitative PCR, respectively. Download
Identification of cytotoxic compounds. (A) Growth curves generated by measuring THP-1 viability at 24, 48, 72, and 120 h after addition of the compounds. Graphed growth curves show representative nontoxic (lincomycin and zolmitriptan) and toxic (ketoconazole and vinblastine) compounds. (B) Correlation curve of the cytotoxic effect of compounds assessed at day 5 using the MTT assay in the absence of C. burnetii (x axis) versus compound cytotoxicity in cells infected with C. burnetii (y axis) determined by imaging. Download
Seventy-five nontoxic compounds that inhibit the intracellular growth of C. burnetii. (A) Circles represent averaged fluorescence (RFU) relative to that of the control. Squares represent Coxiella-containing vacuoles (averaged CCV counts ± SD) extrapolated from fluorescence images. Triangles represent the viability of cells based on the MTT dye reduction assay. The gray area represents the viability at day 5. (B) Effects of 75 nontoxic inhibitors of the intracellular growth of C. burnetii with regard to CCV size. CCV size was determined as the area of each CCV in an image. Points are individual measurements, squares are averages, and colored lines are ranges of distribution. Download
C. burnetii growth in THP-1 and HeLa cells. (A) C. burnetii growth in THP-1 cells treated with 75 nontoxic inhibitors. Cells were treated with drugs at 33 µM, and the intracellular growth of C. burnetii was assessed as mCherry fluorescence over a period of 5 days. (B) Coxiella-infected THP-1 cells were treated with representative compounds at concentrations lower than those used in the screen. (Top) Nomarski images; (middle) corresponding fluorescent images from intracellular mCherry-expressing C. burnetii cells; (bottom) overlay. For direct comparison of fluorescence signals, images were taken at a constant exposure. Scale bar = 200 µm. (C) C. burnetii growth (measured as mCherry fluorescence) in THP-1 and HeLa cells treated with selected compounds at increasing concentrations between 5 and 50 µM. (D) Potencies of selected inhibitors of C. burnetii growth in THP-1 and HeLa cells determined as mCherry fluorescence 7 days postinfection. EC50, estimated concentration for 50% inhibition. Download
Clustering of candidate compounds based on similarities in chemical structure. (A) A chemical structure cluster was generated using the PubChem Chemical Structure Clustering Tool. Clusters 1 to 7 (shaded) represent compounds with significant structural similarities. A similarity score (2D Tanimoto similarity) of 0.68 is statistically significant (P < 0.05). Compounds are identified by their compound identifications (CIDs). (B) Table of the seven clusters of structurally related compounds. Pathogen abbreviations are as follows: Coxiella burnetii (Cb), Legionella pneumophila (Lp), Brucella abortus (Ba), and Rickettsia conorii (Rc). Download
Disruption of cholesterol homeostasis and its effect on the intracellular growth of bacteria. (A) Fluorescence images of filipin-stained cholesterol in HeLa and THP-1 cells treated with DMSO alone (top row) or with U18666A at 10 µM (middle row) or 50 µM (bottom row). For direct comparison, the images were taken at a constant exposure. Scale bars = 100 µm. (B) Levels of inhibition of the intracellular growth of L. pneumophila, B. abortus, and R. conorii by 62 cholesterol-perturbing compounds. The inhibitory efficiencies were measured in THP-1 cells at day 3 postinfection in cells treated with compounds at a 33 µM concentration. Efficiencies of <1 were set to 0, whereas inhibitory efficiencies of >1 were set to 1. The efficiency of amoxapine in inhibiting the intracellular growth of R. conorii could not be assessed (*). Download
Cytotoxicity of all compounds to THP-1 cells as measured by MTT and imaging. The MTT-measured cytotoxicity of each compound was assessed at a 33 µM concentration at 4, 24, 48, 72, and 120 h of incubation with each drug. Values were calculated relative to those for untreated control cells. Cytotoxicity by imaging was calculated as an average area covered by cells relative to that covered by nontreated control cells. Cytotoxicity by imaging is expressed as an average of ratios of the areas from 2 to 4 images per condition ± the standard deviation. Comp., compound; NA, quantification not available because of the detection of a false-positive signal due to empty wells; StDev, SD.
Host- and pathogen-targeting inhibitors of C. burnetii, L. pneumophila, B. abortus, and R. conorii. The data represent the growth of intracellular bacteria relative to that of nontreated controls. Standard deviations were calculated for at least three independent experiments.
C. burnetii intracellular and axenic growth by candidate agents at 10 µM versus 33 µM.
Sixty-two cholesterol-targeting compounds.
ACKNOWLEDGMENTS
We acknowledge membership within and support from the Region V Great Lakes Regional Center of Excellence in Biodefense and Emerging Infectious Diseases Consortium (NIH award 1-U54-AI-057153). This work was also supported by award 5RO1 AI23549 (H.A.S.). We declare that no financial interests exist.
We acknowledge the assistance of Donna Arvans, Phylicia Robins, and the support staff of the Howard Taylor Ricketts Regional Biocontainment Laboratory.
The experiments were conceived and designed by all authors. D.M.C., L.-P.P., N.J.-G., S.P.R., and J.E.G. performed the experiments, D.M.C., L.-P.P., and J.E.G analyzed the data, and D.M.C., H.A.S., S.C., T.L.S., and J.E.G. wrote the paper.
Footnotes
Citation Czyż DM, Potluri L-P, Jain-Gupta N, Riley SP, Martinez JJ, Steck TL, Crosson S, Shuman HA, Gabay JE. 2014. Host-directed antimicrobial drugs with broad-spectrum efficacy against intracellular bacterial pathogens. mBio 5(4):e01534-14. doi:10.1128/mBio.01534-14.
REFERENCES
- 1. Boucher HW, Talbot GH, Bradley JS, Edwards JE, Gilbert D, Rice LB, Scheld M, Spellberg B, Bartlett J. 2009. Bad bugs, no drugs: no ESKAPE! An update from the Infectious Diseases Society of America. Clin. Infect. Dis. 48:1–12. 10.1086/591855 [DOI] [PubMed] [Google Scholar]
- 2. Stanton TB. 2013. A call for antibiotic alternatives research. Trends Microbiol. 21:111–113. 10.1016/j.tim.2012.11.002 [DOI] [PubMed] [Google Scholar]
- 3. Kim SG, Kim EH, Lafferty CJ, Dubovi E. 2005. Coxiella burnetii in bulk tank milk samples, United States. Emerg. Infect. Dis. 11:619–621. 10.3201/eid1104.041036 [DOI] [PMC free article] [PubMed] [Google Scholar]
- 4. Heinzen RA, Hackstadt T, Samuel JE. 1999. Developmental biology of Coxiella burnetii. Trends Microbiol. 7:149–154. 10.1016/S0966-842X(99)01475-4 [DOI] [PubMed] [Google Scholar]
- 5. Berón W, Gutierrez MG, Rabinovitch M, Colombo MI. 2002. Coxiella burnetii localizes in a Rab7-labeled compartment with autophagic characteristics. Infect. Immun. 70:5816–5821. 10.1128/IAI.70.10.5816-5821.2002 [DOI] [PMC free article] [PubMed] [Google Scholar]
- 6. van Schaik EJ, Chen C, Mertens K, Weber MM, Samuel JE. 2013. Molecular pathogenesis of the obligate intracellular bacterium Coxiella burnetii. Nat. Rev. Microbiol. 11:561–573. 10.1038/nrmicro3049 [DOI] [PMC free article] [PubMed] [Google Scholar]
- 7. Fields BS, Benson RF, Besser RE. 2002. Legionella and Legionnaires’ disease: 25 years of investigation. Clin. Microbiol. Rev. 15:506–526. 10.1128/CMR.15.3.506-526.2002 [DOI] [PMC free article] [PubMed] [Google Scholar]
- 8. Gomez G, Adams LG, Ficht AR, Ficht TA. 2013. Host-Brucella interactions and Brucella genome as tools for subunit antigen discovery and immunization against brucellosis. Front. Cell. Infect. Microbiol. 3:17. 10.3389/fcimb.2013.00017 [DOI] [PMC free article] [PubMed] [Google Scholar]
- 9. Martinez JJ, Cossart P. 2004. Early signaling events involved in the entry of Rickettsia conorii into mammalian cells. J. Cell Sci. 117:5097–5106. 10.1242/jcs.01382 [DOI] [PubMed] [Google Scholar]
- 10. Wishart DS, Knox C, Guo AC, Cheng D, Shrivastava S, Tzur D, Gautam B, Hassanali M. 2008. DrugBank: a knowledgebase for drugs, drug actions and drug targets. Nucleic Acids Res. 36:D901–D906. 10.1093/nar/gkm958 [DOI] [PMC free article] [PubMed] [Google Scholar]
- 11. Bolton EE, Wang Y, Thiessen PA, Bryant SH. 2008. Chapter 12 PubChem: integrated platform of small molecules and biological activities. Annu. Rep. Comput. Chem. 4:217–241. 10.1016/S1574-1400(08)00012-1 [DOI] [Google Scholar]
- 12. McDonough JA, Newton HJ, Klum S, Swiss R, Agaisse H, Roy CR. 2013. Host pathways important for Coxiella burnetii infection revealed by genome-wide RNA interference screening. mBio 4(1):e00606-12. 10.1128/mBio.00606-12 [DOI] [PMC free article] [PubMed] [Google Scholar]
- 13. Macdonald LJ, Graham JG, Kurten RC, Voth DE. 2014. Coxiella burnetii exploits host cAMP-dependent protein kinase signalling to promote macrophage survival. Cell. Microbiol. 16:146–159. 10.1111/cmi.12213 [DOI] [PMC free article] [PubMed] [Google Scholar]
- 14. Bhavsar AP, Guttman JA, Finlay BB. 2007. Manipulation of host-cell pathways by bacterial pathogens. Nature 449:827–834. 10.1038/nature06247 [DOI] [PubMed] [Google Scholar]
- 15. Haenssler E, Isberg RR. 2011. Control of host cell phosphorylation by Legionella pneumophila. Front. Microbiol. 2:64. 10.3389/fmicb.2011.00064 [DOI] [PMC free article] [PubMed] [Google Scholar]
- 16. Hempstead AD, Isberg RR. 2013. Host signal transduction and protein kinases implicated in Legionella infection. Curr. Top. Microbiol. Immunol. 376:249–269. 10.1007/82_2013_342 [DOI] [PMC free article] [PubMed] [Google Scholar]
- 17. Shin S, Case CL, Archer KA, Nogueira CV, Kobayashi KS, Flavell RA, Roy CR, Zamboni DS. 2008. Type IV secretion-dependent activation of host MAP kinases induces an increased proinflammatory cytokine response to Legionella pneumophila. PLoS Pathog 4:e1000220. 10.1371/journal.ppat.1000220 [DOI] [PMC free article] [PubMed] [Google Scholar]
- 18. Hempstead AD, Isberg RR. 2013. Host signal transduction and protein kinases implicated in Legionella infection. Curr. Top. Microbiol. Immunol. 376:249–269. 10.1007/82_2013_342 [DOI] [PMC free article] [PubMed] [Google Scholar]
- 19. Zhang X, Wang W, Bedigian AV, Coughlin ML, Mitchison TJ, Eggert US. 2012. Dopamine receptor D3 regulates endocytic sorting by a prazosin-sensitive interaction with the coatomer COPI. Proc. Natl. Acad. Sci. U. S. A. 109:12485–12490. 10.1073/pnas.1207821109 [DOI] [PMC free article] [PubMed] [Google Scholar]
- 20. Chan YG, Riley SP, Chen E, Martinez JJ. 2011. Molecular basis of immunity to rickettsial infection conferred through outer membrane protein B. Infect. Immun. 79:2303–2313. 10.1128/IAI.01324-10 [DOI] [PMC free article] [PubMed] [Google Scholar]
- 21. Howe D, Heinzen RA. 2005. Replication of Coxiella burnetii is inhibited in CHO K-1 cells treated with inhibitors of cholesterol metabolism. Ann. N. Y. Acad. Sci. 1063:123–129. 10.1196/annals.1355.020 [DOI] [PubMed] [Google Scholar]
- 22. Wiklund ED, Catts VS, Catts SV, Ng TF, Whitaker NJ, Brown AJ, Lutze-Mann LH. 2010. Cytotoxic effects of antipsychotic drugs implicate cholesterol homeostasis as a novel chemotherapeutic target. Int. J. Cancer 126:28–40. 10.1002/ijc.24813 [DOI] [PubMed] [Google Scholar]
- 23. Xiong Q, Lin M, Rikihisa Y. 2009. Cholesterol-dependent Anaplasma phagocytophilum exploits the low-density lipoprotein uptake pathway. PLoS Pathog. 5:e1000329. 10.1371/journal.ppat.1000329 [DOI] [PMC free article] [PubMed] [Google Scholar]
- 24. Liu CI, Liu GY, Song Y, Yin F, Hensler ME, Jeng WY, Nizet V, Wang AH, Oldfield E. 2008. A cholesterol biosynthesis inhibitor blocks Staphylococcus aureus virulence. Science 319:1391–1394. 10.1126/science.1153018 [DOI] [PMC free article] [PubMed] [Google Scholar]
- 25. Watarai M, Makino S, Michikawa M, Yanagisawa K, Murakami S, Shirahata T. 2002. Macrophage plasma membrane cholesterol contributes to Brucella abortus infection of mice. Infect. Immun. 70:4818–4825. 10.1128/IAI.70.9.4818-4825.2002 [DOI] [PMC free article] [PubMed] [Google Scholar]
- 26. Xiong Q, Rikihisa Y. 2012. Subversion of NPC1 pathway of cholesterol transport by Anaplasma phagocytophilum. Cell. Microbiol. 14:560–576. 10.1111/j.1462-5822.2011.01742.x [DOI] [PMC free article] [PubMed] [Google Scholar]
- 27. Gilk SD, Cockrell DC, Luterbach C, Hansen B, Knodler LA, Ibarra JA, Steele-Mortimer O, Heinzen RA. 2013. Bacterial colonization of host cells in the absence of cholesterol. PLoS Pathog. 9:e1003107. 10.1371/journal.ppat.1003107 [DOI] [PMC free article] [PubMed] [Google Scholar]
- 28. Potchoo Y, Braguer D, Peyrot V, Chauvet-Monges AM, Sari JC, Crevat A. 1986. In vitro inhibition of microtubule assembly by disulfiram. Int. J. Clin. Pharmacol. Ther. Toxicol. 24:499–504 [PubMed] [Google Scholar]
- 29. Owellen RJ, Hartke CA, Dickerson RM, Hains FO. 1976. Inhibition of tubulin-microtubule polymerization by drugs of the vinca alkaloid class. Cancer Res. 36:1499–1502 [PubMed] [Google Scholar]
- 30. Lacey E. 1990. Mode of action of benzimidazoles. Parasitol. Today 6:112–115. 10.1016/0169-4758(90)90227-U [DOI] [PubMed] [Google Scholar]
- 31. Ferrero MC, Fossati CA, Baldi PC. 2009. Smooth Brucella strains invade and replicate in human lung epithelial cells without inducing cell death. Microbes Infect. 11:476–483. 10.1016/j.micinf.2009.01.010 [DOI] [PubMed] [Google Scholar]
- 32. Rikihisa Y, Zhang Y, Park J. 1995. Role of Ca2+ and calmodulin in ehrlichial infection in macrophages. Infect. Immun. 63:2310–2316 [DOI] [PMC free article] [PubMed] [Google Scholar]
- 33. Shayman JA, Abe A. 2013. Drug induced phospholipidosis: an acquired lysosomal storage disorder. Biochim. Biophys. Acta 1831:602–611. 10.1016/j.bbalip.2012.08.013 [DOI] [PMC free article] [PubMed] [Google Scholar]
- 34. Kornhuber J, Tripal P, Reichel M, Mühle C, Rhein C, Muehlbacher M, Groemer TW, Gulbins E. 2010. Functional inhibitors of acid sphingomyelinase (FIASMAs): a novel pharmacological group of drugs with broad clinical applications. Cell. Physiol. Biochem. 26:9–20. 10.1159/000315101 [DOI] [PubMed] [Google Scholar]
- 35. Leventhal AR, Chen W, Tall AR, Tabas I. 2001. Acid sphingomyelinase-deficient macrophages have defective cholesterol trafficking and efflux. J. Biol. Chem. 276:44976–44983. 10.1074/jbc.M106455200 [DOI] [PubMed] [Google Scholar]
- 36. Sassano MF, Doak AK, Roth BL, Shoichet BK. 2013. Colloidal aggregation causes inhibition of G protein-coupled receptors. J. Med. Chem. 56:2406–2414. 10.1021/jm301749y [DOI] [PMC free article] [PubMed] [Google Scholar]
- 37. Feng BY, Shelat A, Doman TN, Guy RK, Shoichet BK. 2005. High-throughput assays for promiscuous inhibitors. Nat. Chem. Biol. 1:146–148. 10.1038/nchembio718 [DOI] [PubMed] [Google Scholar]
- 38. Omsland A, Cockrell DC, Howe D, Fischer ER, Virtaneva K, Sturdevant DE, Porcella SF, Heinzen RA. 2009. Host cell-free growth of the Q fever bacterium Coxiella burnetii. Proc. Natl. Acad. Sci. U. S. A. 106:4430–4434. 10.1073/pnas.0812074106 [DOI] [PMC free article] [PubMed] [Google Scholar]
- 39. Hervet E, Charpentier X, Vianney A, Lazzaroni JC, Gilbert C, Atlan D, Doublet P. 2011. Protein kinase LegK2 is a type IV secretion system effector involved in endoplasmic reticulum recruitment and intracellular replication of Legionella pneumophila. Infect. Immun. 79:1936–1950. 10.1128/IAI.00805-10 [DOI] [PMC free article] [PubMed] [Google Scholar]
- 40. Beare PA, Howe D, Cockrell DC, Omsland A, Hansen B, Heinzen RA. 2009. Characterization of a Coxiella burnetii ftsZ mutant generated by Himar1 transposon mutagenesis. J. Bacteriol. 191:1369–1381. 10.1128/JB.01580-08 [DOI] [PMC free article] [PubMed] [Google Scholar]
- 41. Schneider CA, Rasband WS, Eliceiri KW. 2012. NIH image to ImageJ: 25 years of image analysis. Nat. Methods 9:671–675. 10.1038/nmeth.2089 [DOI] [PMC free article] [PubMed] [Google Scholar]
- 42. Rodriguez-Barrueco R, Marshall N, Silva JM. 2013. Pooled shRNA screenings: experimental approach. Methods Mol. Biol. 980:353–370. 10.1007/978-1-62703-287-2_21 [DOI] [PubMed] [Google Scholar]
- 43. Lieberman LA, Higgins DE. 2009. A small-molecule screen identifies the antipsychotic drug pimozide as an inhibitor of Listeria monocytogenes infection. Antimicrob. Agents Chemother. 53:756–764. 10.1128/AAC.00607-08 [DOI] [PMC free article] [PubMed] [Google Scholar]
- 44. Lieberman LA, Higgins DE. 2010. Inhibition of Listeria monocytogenes infection by neurological drugs. Int. J. Antimicrob. Agents 35:292–296. 10.1016/j.ijantimicag.2009.10.011 [DOI] [PMC free article] [PubMed] [Google Scholar]
- 45. Lin M, den Dulk-Ras A, Hooykaas PJ, Rikihisa Y. 2007. Anaplasma phagocytophilum AnkA secreted by type IV secretion system is tyrosine phosphorylated by Abl-1 to facilitate infection. Cell. Microbiol. 9:2644–2657. 10.1111/j.1462-5822.2007.00985.x [DOI] [PubMed] [Google Scholar]
- 46. Lin M, Rikihisa Y. 2003. Obligatory intracellular parasitism by Ehrlichia chaffeensis and Anaplasma phagocytophilum involves caveolae and glycosylphosphatidylinositol-anchored proteins. Cell. Microbiol. 5:809–820. 10.1046/j.1462-5822.2003.00322.x [DOI] [PubMed] [Google Scholar]
- 47. Mair SM, Nairz M, Bellmann-Weiler R, Muehlbacher T, Schroll A, Theurl I, Moser PL, Talasz H, Fang FC, Weiss G. 2011. Nifedipine affects the course of Salmonella enterica serovar. Typhimurium infection by modulating macrophage iron homeostasis. J. Infect. Dis. 204:685–694. 10.1093/infdis/jir395 [DOI] [PMC free article] [PubMed] [Google Scholar]
- 48. Amaral L, Kristiansen JE, Frolund Thomsen V, Markovich B. 2000. The effects of chlorpromazine on the outer cell wall of Salmonella typhimurium in ensuring resistance to the drug. Int. J. Antimicrob. Agents 14:225–229. 10.1016/S0924-8579(00)00136-9 [DOI] [PubMed] [Google Scholar]
- 49. Lee CB, Ha US, Yim SH, Lee HR, Sohn DW, Han CH, Cho YH. 2011. Does finasteride have a preventive effect on chronic bacterial prostatitis? Pilot study using an animal model. Urol. Int. 86:204–209. 10.1159/000320109 [DOI] [PubMed] [Google Scholar]
- 50. Martins M, Bleiss W, Marko A, Ordway D, Viveiros M, Leandro C, Pacheco T, Molnar J, Kristiansen JE, Amaral L. 2004. Clinical concentrations of thioridazine enhance the killing of intracellular methicillin-resistant Staphylococcus aureus: an in vivo, ex vivo and electron microscopy study. In Vivo 18:787–794 [PubMed] [Google Scholar]
- 51. Amaral L, Boeree MJ, Gillespie SH, Udwadia ZF, van Soolingen D. 2010. Thioridazine cures extensively drug-resistant tuberculosis (XDR-TB) and the need for global trials is now! Int. J. Antimicrob. Agents 35:524–526. 10.1016/j.ijantimicag.2009.12.019 [DOI] [PubMed] [Google Scholar]
- 52. Udwadia ZF, Sen T, Pinto LM. 2011. Safety and efficacy of thioridazine as salvage therapy in Indian patients with XDR-TB. Recent Pat. Antiinfect. Drug Discov. 6:88–91. 10.2174/157489111796064614 [DOI] [PubMed] [Google Scholar]
- 53. Abbate E, Vescovo M, Natiello M, Cufré M, García A, Gonzalez Montaner P, Ambroggi M, Ritacco V, van Soolingen D. 2012. Successful alternative treatment of extensively drug-resistant tuberculosis in Argentina with a combination of linezolid, moxifloxacin and thioridazine. J. Antimicrob. Chemother. 67:473–477. 10.1093/jac/dkr500 [DOI] [PubMed] [Google Scholar]
- 54. Campbell GR, Spector SA. 2012. Vitamin D inhibits human immunodeficiency virus type 1 and Mycobacterium tuberculosis infection in macrophages through the induction of autophagy. PLoS Pathog. 8:e1002689. 10.1371/journal.ppat.1002689 [DOI] [PMC free article] [PubMed] [Google Scholar]
- 55. Napier RJ, Rafi W, Cheruvu M, Powell Kimberly R, Zaunbrecher MA, Bornmann W, Salgame P, Shinnick TM, Kalman D. 2011. Imatinib-sensitive tyrosine kinases regulate mycobacterial pathogenesis and represent therapeutic targets against tuberculosis. Cell Host Microbe 10:475–485. 10.1016/j.chom.2011.09.010 [DOI] [PMC free article] [PubMed] [Google Scholar]
- 56. Martins M, Viveiros M, Amaral L. 2008. Inhibitors of Ca2+ and K+ transport enhance intracellular killing of M. tuberculosis by non-killing macrophages. In Vivo 22:69–75 [PubMed] [Google Scholar]
- 57. Fabri M, Stenger S, Shin DM, Yuk JM, Liu PT, Realegeno S, Lee HM, Krutzik SR, Schenk M, Sieling PA, Teles R, Montoya D, Iyer SS, Bruns H, Lewinsohn DM, Hollis BW, Hewison M, Adams JS, Steinmeyer A, Zügel U, Cheng G, Jo EK, Bloom BR, Modlin RL. 2011. Vitamin D is required for IFN-gamma-mediated antimicrobial activity of human macrophages. Sci. Transl. Med. 3:104ra102. 10.1126/scitranslmed.3003045 [DOI] [PMC free article] [PubMed] [Google Scholar]
- 58. Dasgupta A, Dastidar SG. 2012. Antibacterial & antitoxic effects of the cardiovascular drug lacidipine in an animal model. Indian J. Med. Res. 135:913–916 [PMC free article] [PubMed] [Google Scholar]
- 59. Ho Sui SJ, Lo R, Fernandes AR, Caulfield MD, Lerman JA, Xie L, Bourne PE, Baillie DL, Brinkman FS. 2012. Raloxifene attenuates Pseudomonas aeruginosa pyocyanin production and virulence. Int. J. Antimicrob. Agents 40:246–251. 10.1016/j.ijantimicag.2012.05.009 [DOI] [PMC free article] [PubMed] [Google Scholar]
- 60. Salin OP, Pohjala LL, Saikku P, Vuorela HJ, Leinonen M, Vuorela PM. 2011. Effects of coadministration of natural polyphenols with doxycycline or calcium modulators on acute Chlamydia pneumoniae infection in vitro. J. Antibiot. 64:747–752. 10.1038/ja.2011.79 [DOI] [PubMed] [Google Scholar]
- 61. Leone M, Honstettre A, Lepidi H, Capo C, Bayard F, Raoult D, Mege JL. 2004. Effect of sex on Coxiella burnetii infection: protective role of 17beta-estradiol. J. Infect. Dis. 189:339–345. 10.1086/380798 [DOI] [PubMed] [Google Scholar]
- 62. Sochocka M, Zaczyńska E, Leszek J, Siemieniec I, Błach-Olszewska Z. 2008. Effect of donepezil on innate antiviral immunity of human leukocytes. J. Neurol. Sci. 273:75–80. 10.1016/j.jns.2008.06.021 [DOI] [PubMed] [Google Scholar]
- 63. Benton T, Lynch K, Dubé B, Gettes DR, Tustin NB, Ping Lai J, Metzger DS, Blume J, Douglas SD, Evans DL. 2010. Selective serotonin reuptake inhibitor suppression of HIV infectivity and replication. Psychosom. Med. 72:925–932. 10.1097/PSY.0b013e3181f883ce [DOI] [PMC free article] [PubMed] [Google Scholar]
- 64. Nemerow GR, Cooper NR. 1984. Infection of B lymphocytes by a human herpesvirus, Epstein-Barr virus, is blocked by calmodulin antagonists. Proc. Natl. Acad. Sci. U. S. A. 81:4955–4959. 10.1073/pnas.81.15.4955 [DOI] [PMC free article] [PubMed] [Google Scholar]
- 65. Dorobantu C, Macovei A, Lazar C, Dwek RA, Zitzmann N, Branza-Nichita N. 2011. Cholesterol depletion of hepatoma cells impairs hepatitis B virus envelopment by altering the topology of the large envelope protein. J. Virol. 85:13373–13383. 10.1128/JVI.05423-11 [DOI] [PMC free article] [PubMed] [Google Scholar]
- 66. Sochocka M, Zaczyńska E, Taboł A, Czarny A, Leszek J, Sobczyński M. 2010. The influence of donepezil and EGb 761 on the innate immunity of human leukocytes: effect on the NF-kappaB system. Int. Immunopharmacol. 10:1505–1513. 10.1016/j.intimp.2010.08.024 [DOI] [PubMed] [Google Scholar]
Associated Data
This section collects any data citations, data availability statements, or supplementary materials included in this article.
Supplementary Materials
Correlation of expressed mCherry fluorescence with the growth of C. burnetii. Fluorescence signal intensity correlation with CFU and genome equivalents determined by bacterial plating and quantitative PCR, respectively. Download
Identification of cytotoxic compounds. (A) Growth curves generated by measuring THP-1 viability at 24, 48, 72, and 120 h after addition of the compounds. Graphed growth curves show representative nontoxic (lincomycin and zolmitriptan) and toxic (ketoconazole and vinblastine) compounds. (B) Correlation curve of the cytotoxic effect of compounds assessed at day 5 using the MTT assay in the absence of C. burnetii (x axis) versus compound cytotoxicity in cells infected with C. burnetii (y axis) determined by imaging. Download
Seventy-five nontoxic compounds that inhibit the intracellular growth of C. burnetii. (A) Circles represent averaged fluorescence (RFU) relative to that of the control. Squares represent Coxiella-containing vacuoles (averaged CCV counts ± SD) extrapolated from fluorescence images. Triangles represent the viability of cells based on the MTT dye reduction assay. The gray area represents the viability at day 5. (B) Effects of 75 nontoxic inhibitors of the intracellular growth of C. burnetii with regard to CCV size. CCV size was determined as the area of each CCV in an image. Points are individual measurements, squares are averages, and colored lines are ranges of distribution. Download
C. burnetii growth in THP-1 and HeLa cells. (A) C. burnetii growth in THP-1 cells treated with 75 nontoxic inhibitors. Cells were treated with drugs at 33 µM, and the intracellular growth of C. burnetii was assessed as mCherry fluorescence over a period of 5 days. (B) Coxiella-infected THP-1 cells were treated with representative compounds at concentrations lower than those used in the screen. (Top) Nomarski images; (middle) corresponding fluorescent images from intracellular mCherry-expressing C. burnetii cells; (bottom) overlay. For direct comparison of fluorescence signals, images were taken at a constant exposure. Scale bar = 200 µm. (C) C. burnetii growth (measured as mCherry fluorescence) in THP-1 and HeLa cells treated with selected compounds at increasing concentrations between 5 and 50 µM. (D) Potencies of selected inhibitors of C. burnetii growth in THP-1 and HeLa cells determined as mCherry fluorescence 7 days postinfection. EC50, estimated concentration for 50% inhibition. Download
Clustering of candidate compounds based on similarities in chemical structure. (A) A chemical structure cluster was generated using the PubChem Chemical Structure Clustering Tool. Clusters 1 to 7 (shaded) represent compounds with significant structural similarities. A similarity score (2D Tanimoto similarity) of 0.68 is statistically significant (P < 0.05). Compounds are identified by their compound identifications (CIDs). (B) Table of the seven clusters of structurally related compounds. Pathogen abbreviations are as follows: Coxiella burnetii (Cb), Legionella pneumophila (Lp), Brucella abortus (Ba), and Rickettsia conorii (Rc). Download
Disruption of cholesterol homeostasis and its effect on the intracellular growth of bacteria. (A) Fluorescence images of filipin-stained cholesterol in HeLa and THP-1 cells treated with DMSO alone (top row) or with U18666A at 10 µM (middle row) or 50 µM (bottom row). For direct comparison, the images were taken at a constant exposure. Scale bars = 100 µm. (B) Levels of inhibition of the intracellular growth of L. pneumophila, B. abortus, and R. conorii by 62 cholesterol-perturbing compounds. The inhibitory efficiencies were measured in THP-1 cells at day 3 postinfection in cells treated with compounds at a 33 µM concentration. Efficiencies of <1 were set to 0, whereas inhibitory efficiencies of >1 were set to 1. The efficiency of amoxapine in inhibiting the intracellular growth of R. conorii could not be assessed (*). Download
Cytotoxicity of all compounds to THP-1 cells as measured by MTT and imaging. The MTT-measured cytotoxicity of each compound was assessed at a 33 µM concentration at 4, 24, 48, 72, and 120 h of incubation with each drug. Values were calculated relative to those for untreated control cells. Cytotoxicity by imaging was calculated as an average area covered by cells relative to that covered by nontreated control cells. Cytotoxicity by imaging is expressed as an average of ratios of the areas from 2 to 4 images per condition ± the standard deviation. Comp., compound; NA, quantification not available because of the detection of a false-positive signal due to empty wells; StDev, SD.
Host- and pathogen-targeting inhibitors of C. burnetii, L. pneumophila, B. abortus, and R. conorii. The data represent the growth of intracellular bacteria relative to that of nontreated controls. Standard deviations were calculated for at least three independent experiments.
C. burnetii intracellular and axenic growth by candidate agents at 10 µM versus 33 µM.
Sixty-two cholesterol-targeting compounds.