Summary
Spatial patterning is a ubiquitous feature of biological systems. Meiotic crossovers provide an interesting example, defined by the classical phenomenon of crossover interference. Here, analysis of crossover patterns in budding yeast identifies a molecular pathway for interference. Topoisomerase II (Topo II) plays a central role, thus identifying a new function for this critical molecule. SUMOylation [of TopoII and axis component Red1] and ubiquitin-mediated removal of SUMOylated proteins are also required. These and other findings support the hypothesis that crossover interference involves accumulation, relief and redistribution of mechanical stress along the protein/DNA meshwork of meiotic chromosome axes, with TopoII required to adjust spatial relationships among DNA segments.
During meiosis, crossovers (COs) promote genetic diversity and create physical connections between homologs that ensure their accurate segregation (review in refs 1–3). COs arise stochastically from a larger set of undifferentiated precursor recombination complexes, at different chromosomal positions in different meiotic nuclei. Nonetheless, along any given chromosome in any given nucleus, COs tend to be evenly spaced (review in refs 3, 4). This feature was originally recognized early in the 20th century as the genetic phenomenon of CO interference5,6.
CO interference is particularly interesting because it implies the occurrence of communication along chromosomes. Remarkably, communication can extend over distances ranging from 300 nanometers to >30 microns 4,7,8. Some models for CO interference invoke spreading of a molecular-based change along the chromosomes9. Even spacing can also be achieved by a reaction-diffusion process10. We have proposed, alternatively, that interference involves the accumulation, relief and redistribution of mechanical stress, with spreading molecular changes following as a consequence of spreading stress relief 4. Aberrant CO patterns are observed in mutants defective for recombination enzymology, chromosome structure, chromatin state and DNA-based signal transduction. However, no specific molecular process has been defined. To address this deficit, we examined CO patterns in wild-type (WT) and mutant strains of budding yeast as defined by cytological localization of CO-correlated molecular foci.
CO Interference in wild-type meiosis
Mammals, plants and fungi share a common meiotic recombination program. Recombination initiates by programmed double-strand breaks (DSBs), which occur in the context of developing chromosome structural axes11,12. Each DSB identifies a partner duplex on a homologous chromosome and mediates whole chromosome pairing. As a result, homolog structural axes are coaligned, linked by bridging recombination complexes13. CO patterning is thought to act upon these bridging interactions13, 14, designating a subset to be COs, with accompanying interference14, 15. In yeast, CO-designation locally nucleates installation of synaptonemal complex (SC) between homolog axes13, 14, 16. SC then spreads along the lengths of the chromosomes. Correspondingly, CO patterning and interference are independent of SC formation13, 17, 18 (below).
In yeast, a powerful early marker for analysis of CO interference is provided by cytologically prominent foci of E3 ligase Zip3, which specifically mark the sites of patterned COs 8, 18–20 (Methods). Zip3 foci emerge immediately following CO-designation, thus avoiding complications arising during formation of actual CO products8. Also, Zip3 foci do not mark the sites of additional COs that arises by other routes8 (Methods).
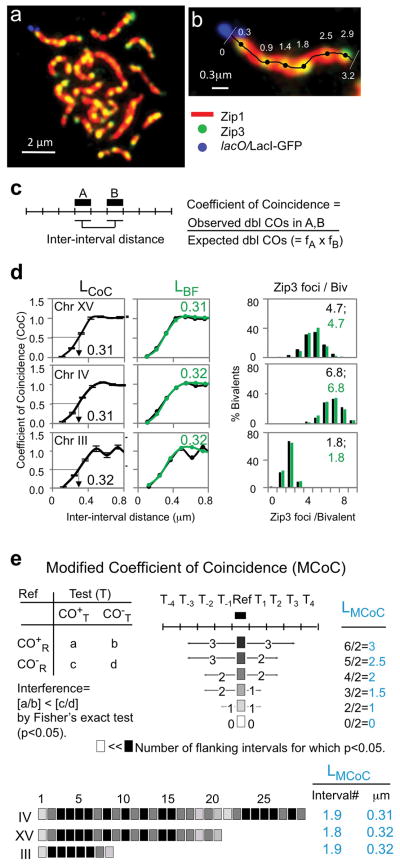
For the present study, Zip3-MYC foci were visualized along the SCs of surface-spread pachytene chromosomes by wide-field epi-fluorescence8 (Fig. 1ab; Methods). Each Zip3 focus position was defined, to an accuracy of ~1 pixel (67nm) along a particular marked chromosome in each of ~200–300 nuclei, thus defining patterns with a high degree of reproducibility and accuracy8 (Methods; Supplementary Table 1). Using these position data, the distance along a chromosome over which the interference signal is detectable, i.e. the “interference distance” (L), is defined by three different approaches (Fig. 1C–F). In each case, (L) is given in units of physical distance (rationale below), μm SC, which is a proxy for chromosome length at late leptotene when CO-designation actually occurs (above).
Figure 1. CO Interference in wild-type meiosis.
a, Spread yeast pachytene chromosomes fluorescently labeled for SC component Zip1 (red), CO-correlated Zip3 foci (green) and a lacO/LacI-GFP array at the end of Chromosome XV (blue). b, Positions of Zip3 foci along a chromosome XV bivalent and total SC were determined in a single continuous trace (Methods). c, Definition of CoC. d, CoC and average number/distribution of COs on chromosomes XV, III and IV (black). Bars indicate standard errors. BF best-fit simulations in green. LCoC and LBF = 0.3± 0.01μm for all three chromosomes (N = 4, 3 and 2 experiments, 200–300 bivalents each). e, Modified CoC analysis defines, for each interval, the number of adjacent intervals affected by CO interference (Methods). Top Left: each interval is considered individually as a reference interval (Ref). Chromosomes that do or do not contain a CO in that interval (CO+R, CO−R) are evaluated for the number that do or do not contain a CO in a second (nearby) interval (Test; CO+T, CO−T). Fisher’s exact test is applied to determine if there were fewer COs in the CO+R group versus the CO−R group, implying interference emanating from the reference interval to the test interval. Top Right: number of nearby test intervals where interference was detected in one direction from the reference interval gives LMCoC for that interval. Bottom: Average LMCoC for all reference intervals along a chromosome (0.16μm per interval): LMCoC = ~0.3 μm for all three chromosomes (Extended Data Fig. 3a).
LCoC
CO interference is classically described by Coefficient of Coincidence (CoC) analysis5, 6, 8 (Fig. 1C). Chromosomes are divided into evenly-spaced intervals. For every possible pair of intervals, the frequency of chromosomes with a CO in both intervals (a “double” CO) is compared with the frequency expected for independent occurrence (given by the product of the frequencies for the two intervals taken individually). The resulting ratios are plotted as a function of inter-interval distance. Zip3 foci along three chromosomes of different sizes (330–1530kb) exhibit classical CoC relationships (Fig. 1d left column). For intervals that are close together, bivalents exhibiting a focus in each interval (“double events”) are much rarer than expected, reflecting operation of interference; as the inter-interval distance increases, double event frequencies progressively approach, and then reach, that expected for independent occurrence, where the observed frequency is the same as the expected frequency (CoC = 1). At even longer intervals, CoC values can exceed one, reflecting the tendency for even spacing8. For convenience, we define the interference distance described by such curves as the inter-interval distance at which CoC = 0.5, i.e. LCoC (Fig. 1d left column). The three analyzed chromosomes exhibit virtually identical CoC curves and values of LCoC = 0.3 ± 0.01 μm (N=2–4; Fig. 1d left column: ref. 8; Methods).
LBF
We previously described a stress-and-stress relief mechanism for CO patterning (the “beam-film” (BF) model). BF-predicted CO patterns are defined by simulation analyses8 (Methods) that can accurately describe CO patterns in diverse organisms, including yeast8 (Fig. 1d middle and right columns). The BF parameter (L) is the distance over which the interference signal spreads along the chromosomes and corresponds to the distance at which the predicted CoC = 0.5, i.e. LBF. BF simulations give the same value of (L) and LBF = ~0.3 μm for all three analyzed yeast chromosomes (Fig. 1d middle column).
LMCoC
CO interference can be examined by a modified CoC analysis (“MCoC”21, Fig. 1e; Methods). The three analyzed yeast chromosomes exhibit the same average LMCoC of ~0.3 μm.
CO interference requires Topoisomerase II
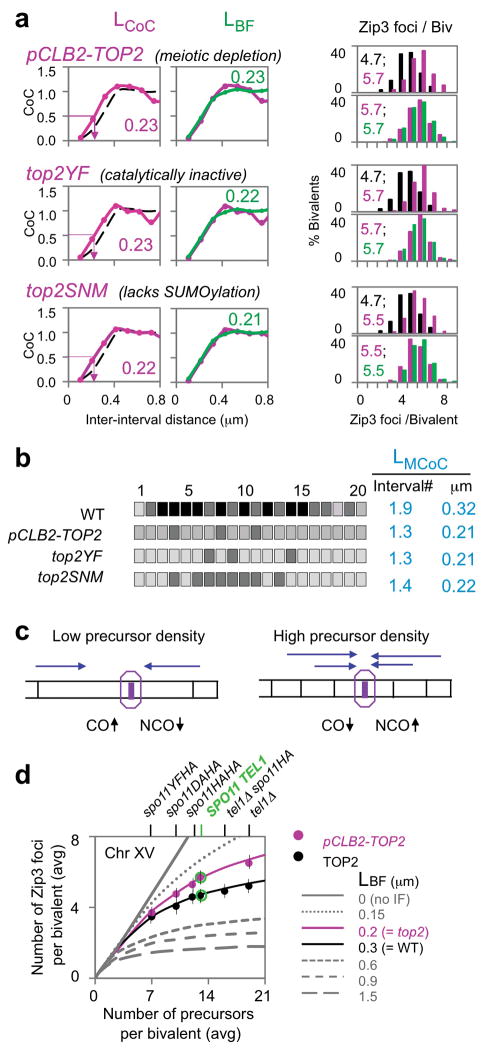
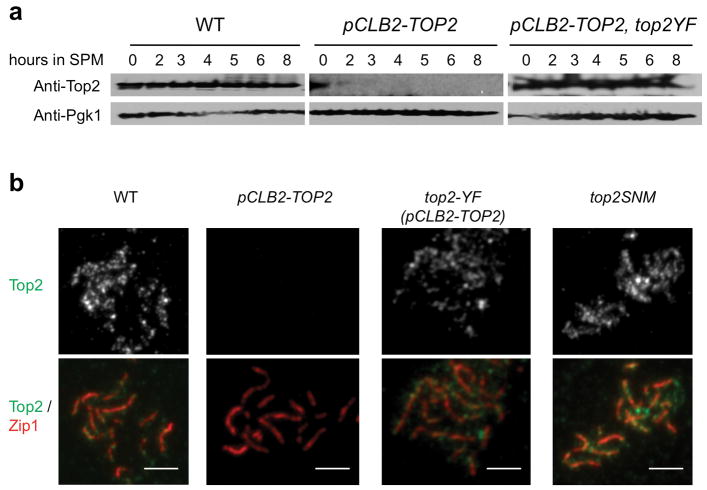
Topoisomerase II alleviates topological stresses within chromosomes. If CO interference involves mechanical stress along the chromosomes4, TopoII could be a key player. We assessed CO interference in three mutants with altered Topoisomerase II states (Fig. 2; Extended Data Figs 1–3). (i) TopoII was depleted using a pCLB2-TOP2 fusion which expresses Topoisomerase II in vegetative cells but not meiosis. (ii) TopoII catalytic activity was eliminated in meiosis by expressing a catalytically-inactive allele (top2YF) under its native promoter in a pCLB2-TOP2 strain, leaving top2YF as the only gene expressed during meiosis. (iii) SUMOylation of TopoII at several C-terminal residues22 was eliminated by mutation. All three top2 mutant strains grow well vegetatively, progress to the pachytene stage of meiosis, and exhibit normal SC morphology and length 23 (Extended Data Fig. 3). Meiotic TopoII levels and localization are severely reduced in pCLB2-TOP2 and not detectably changed in other mutants (Extended Data Fig. 1).
Figure 2. CO interference in top2 mutants.
a, b, All three top2 mutants show decreased CO interference by all criteria (LCoC, LBF, LMCoC) and correspondingly increased CO frequency. In a, WT, top2 and BF simulation data (black, pink and green). c, The basis for CO homeostasis8. At lower (higher) precursor density (black vertical lines; left (right)), a given precursor will be less (more) likely to be experience interference emanating from nearby COs (indicated by fewer (more) blue lines), giving an increased (decreased) probability of a CO at each individual position, and thus along the whole chromosome length. The magnitudes of these effects will be greater or lesser according to the strength of CO interference (and zero in its absence). d, Quantitative evaluation of CO homeostasis on Chromosome XV. Lines: relationship of CO number to precursor number (parameter N) predicted by BF simulations at varying interference levels (LBF = interference distance (L); other parameters appropriate to WT yeast meiosis8). CO homeostasis decreases with decreasing CO interference. Filled circles: strains exhibiting altered DSB levels (top) were analyzed for Zip3 foci in TOP2 (black) and pCLB2-TOP2 (pink) backgrounds (Methods; Extended Data Fig. 4). Average frequency of Zip3 foci per bivalent plotted versus DSB (= precursor) number (vertical lines indicate S.D.). pCLB2-TOP2 differs experimentally from WT in the direction expected for decreased CO interference. Experimental data for WT and pCLB2-TOP2 both quantitatively match the relationships predicted for their corresponding interference levels by BF simulations (LBF = 0.3 and 0.2 μm, respectively; Fig. 2ab).
In all three top2 mutant strains, for all three analyzed chromosomes, the interference distance is decreased from ~0.3 μm in WT to ~0.2 μm as defined by LCoC, LBF and LMCoC (Fig. 2ab; Extended Data Fig. 2–3; Methods). Reduced interference should be accompanied by an increased number of COs. Correspondingly, similarly in all cases, the distribution of Zip3 foci per bivalent is shifted to higher values (Fig. 2ab; Extended Data Fig. 2).
For pCLB2-TOP2, existence of an interference defect was confirmed by a fourth approach. Meiotic CO patterns are characterized by “CO homeostasis”24. A decrease or increase in the frequency of DSBs (and thus CO precursor interactions) necessarily decreases or increases the frequency of COs. However, the magnitudes of such changes are less than proportional to the change in DSB/precursor frequency, implying a homeostatic effect. CO homeostasis is a direct consequence of CO interference8, 24: homeostatic disparity is greater or less when CO interference is stronger or weaker, and absent when CO interference is absent. This interplay is predicted, and can be quantified, by BF simulations8 (Figure 2d; Methods).
CO homeostasis can be evaluated experimentally. The number of Zip3 foci along a given chromosome is determined in a series of strains that exhibit different levels of DSBs (precursors). Decreased and increased levels are conferred by hypomorphic mutations in DSB transesterase Spo11 and a tel1Δ mutation respectively8 (Methods; Extended Data Fig. 4; Fig. 2d). In a TOP2 background, homeostasis is apparent in the non-linear relationship of Zip3 focus number to DSB number (chromosomes XVand III; ref.8;Fig. 2d, filled black circles; Extended Data Fig. 4). Moreover, the experimentally-defined relationships occur at exactly the level of interference predicted to occur in WT meiosis by best-fit BF simulation analysis8 (LBF = ~0.3 μm; above; Fig. 2d).
If pCLB2-TOP2 reduces the interference distance, it should bring the relationship between Zip3 focus number and DSB number closer to the linear proportionality seen in the absence of interference. This prediction is fulfilled (Chromosomes XV and III; Fig. 2d, filled pink circles; Extended Data Fig. 4). Furthermore, the mutant relationships again occur specifically at the interference distance predicted by best-fit BF simulation analysis for this mutant (LBF = ~0.2 μm; above; Fig. 2d, Extended Data Fig. 4). These results confirm the existence of an interference defect in pCLB2-TOP2 and provide further evidence that the BF model can accurately describe CO patterns (see also Extended Data Fig. 4).
CO interference requires SUMO and STUbL
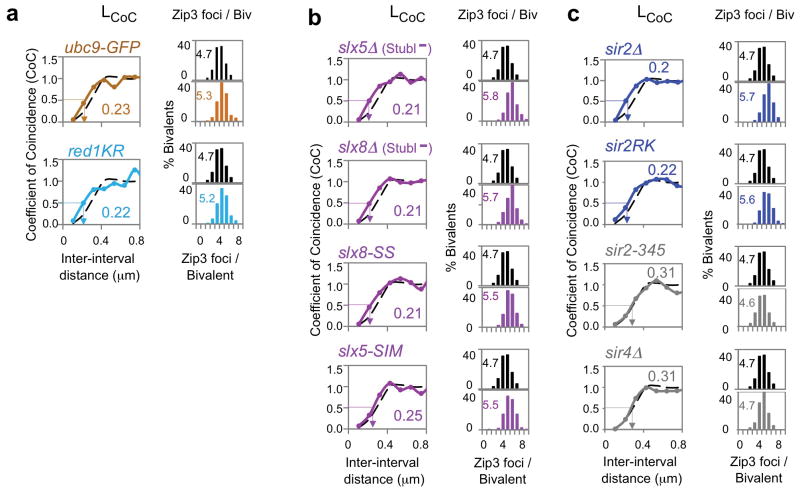
SUMOylation of TopoII requires Ubc9, yeast’s only known SUMO-E225. Another Ubc9 substrate is meiotic axis component Red120. Mutation of Red1’s prominent SUMOylation patch, which dramatically reduces the level of modification (red1KR26), confers the same altered Zip3 focus patterns as top2 mutations, including top2SNM (Fig. 3a; Extended Data Fig. 3). Interestingly, a ubc9 non-null allele, ubc9-GFP27, also exhibits this same phenotype (Fig. 3a; Extended Data Fig. 3), as well as an elevated level of COs as defined genetically27.
Figure 3. CO interference requires post-translational modification.
a–c, WT and mutant CO patterns (black; colors). Quantitatively similar decreases in CO interference and increases in CO number are seen in: ubc9-GFP (SUMO E2; brown); red1KR (non-SUMOylated Red1; cyan); strains lacking Slx5 or Slx8 (slx5Δ or slx8Δ) or mutated for the Slx5 SUMO-binding motif or the Slx8 ubiquitin ligase motif (slx5-SIM, slx8-SS) (magenta); or lacking Sir2 (sir2Δ) or mutated for the Sir2/Slx5 interaction site (sir2RK) (blue). CO interference does not require Sir2 deacetylation activity (sir2-345) or Sir2 interaction partner Sir4 (sir4Δ) (grey) or other Sir2 activities/partners (text).
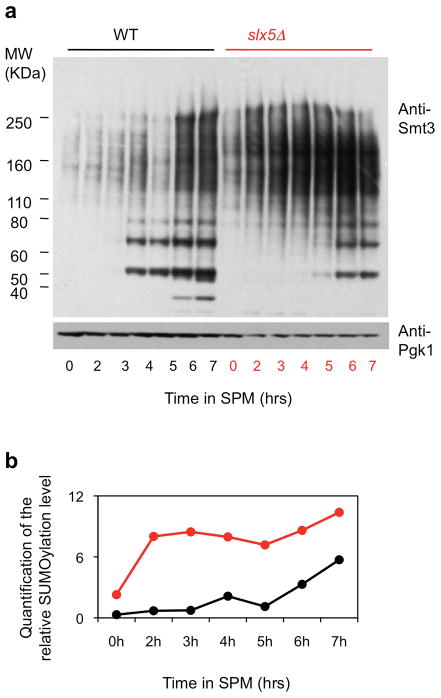
CO Interference also requires STUbL protein Slx5/8. Slx5/8 recognizes and ubiquitinates SUMOylated proteins, thereby targeting them for removal from their cognate complexes28. Absence of Slx5/8 activity confers a strong global increase in protein SUMOylation during meiosis (Extended Data Fig. 5). Absence of either Slx5 or Slx8, or mutational abrogation of either the Slx5 SUMO-binding motif or the Slx8 ubiquitin ligase motif (slx5Δ, slx8Δ, slx5-SIM or slx8-SS) confers the same changes in Zip3 focus patterns as top2, red1-KR and ubc9-GFP (Fig. 3b; Extended Data Fig. 2–3). The slx5Δ defect is confirmed genetically (Extended Data Fig. 3; Supplementary Table 2).
Sirtuin Sir2 is required for CO interference via Slx5/8 STUbL activity. Sir2 is the founding member of the sirtuin family. One Sir2 role is to enable Slx5/8 STUbL activity29. We find that absence of Sir2 (sir2Δ) or specific mutational elimination of Sir2’s interaction with Slx5/8 (sir2RK) confer the same changes in Zip3 focus patterns as all of the other mutations analyzed above, again by all criteria (Fig. 3c; Extended Data Fig. 2–3). The interference defect in sir2RK is further confirmed genetically (Extended Data Fig. 3; Supplementary Table 2).
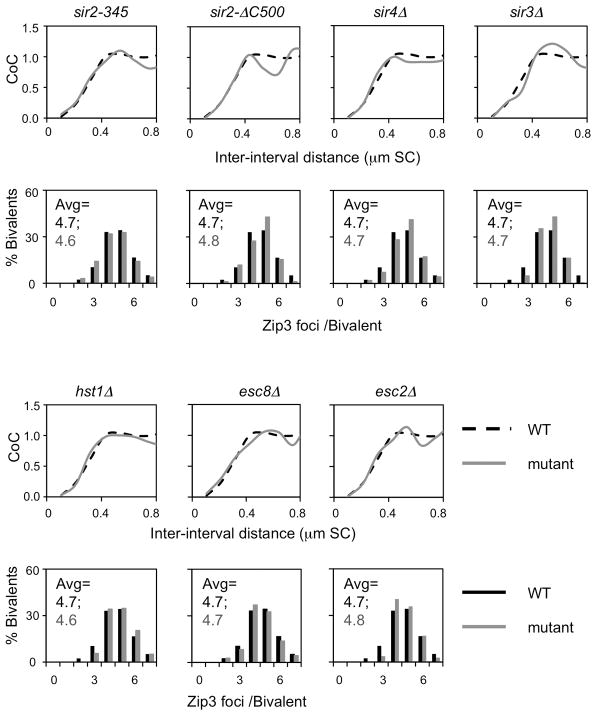
Sir2’s role in interference is specific to this one function. Elimination of other Sir2-mediated activities does not alter CO interference as shown for abrogation of histone deacetylase catalysis (sir2-345); elimination of Sir2 partners required for silencing roles (in deletion mutants of Sir3, Sir4, Esc2 and Esc8); and elimination of a Sir2 cohesion role (sir2ΔC500; Fig. 3c; Extended Data Fig. 3 and 6).
A single TopoII CO interference pathway
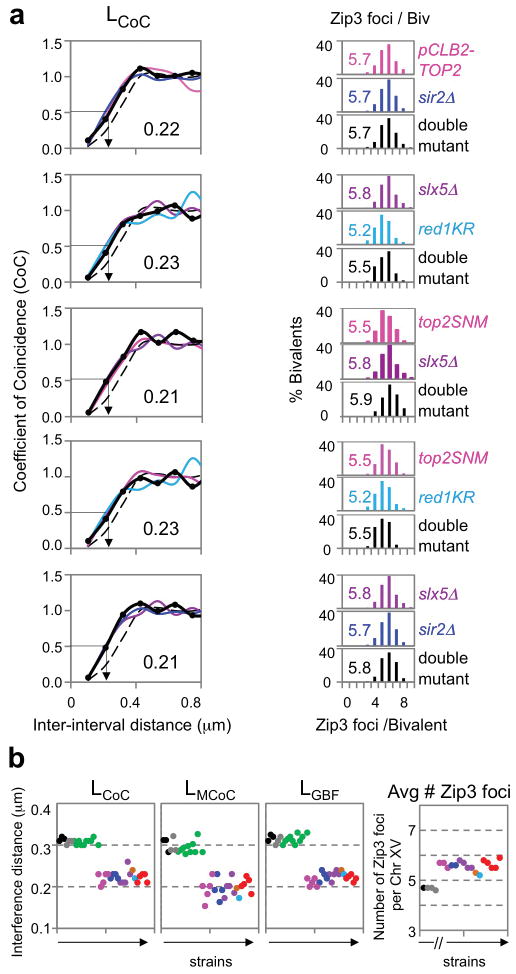
All analyzed mutants exhibit the same quantitative defects in CO interference and CO number as defined by Zip3 focus patterns (Figs 2–4; Extended Data Figs 2–3). Double mutants carrying combinations of single mutations also exhibit these same phenotypes: sir2Δ slx5Δ; sir2Δ PCLB2-TOP2; slx5Δ top2SNM; red1KR top2SNM; and red1KR slx5Δ (Fig. 4ab). Thus, the described mutant defects define a single molecular pathway.
Figure 4. A single pathway for CO interference.
a, Representative double mutants and component single mutants exhibit the same quantitative defect in CO interference and increased CO number (colors and black) versus WT (dashed line). b, CO interference and CO number phenotypes for all mutants (Figs 1–5). WT (black), sir2-345 and sir4Δ (grey), top2 mutants (pink), sir2Δ and sir2RK (blue), slx5/8 mutants (purple), ubc9-GFP (brown), red1KR (light blue), double mutants (red); mutants with altered axis length showing WT phenotype (green).
This pathway may directly implement the spreading interference signal, but other perturbations are not excluded (Supplementary Discussion). These results cannot be explained by (i) prolongation of the CO-designation period; (ii) higher DSB/precursor levels (Extended Data Figs 4, 7 and 8); or (iii) obviously altered axis organization, since all mutants exhibit WT SC lengths (Extended Data Fig. 3). All mutants exhibit reduced evenness of spacing as defined by gamma distribution analysis (Supplementary Discussion).
The “obligatory CO” does not require robust CO interference
Since a CO is required for meiotic homolog segregation, every pair of homologs must acquire at least one (the “obligatory CO”3). The frequency of zero-Zip3 focus chromosomes is <10−3 for chromosomes IV and XV and ~1% for chromosome III because it is small8. None of the identified interference-defective mutants exhibits an increased frequency of zero-Zip3 foci chromosomes (Figs 1–4; Extended Data Fig. 2). This result argues against models in which CO interference is required to ensure the obligatory CO8,9 while the BF model predicts this phenotype8.
The CO interference metric is physical distance
We analyzed Zip3 focus patterns in strains whose pachytene SC lengths differ from those of the reference WT SK1 strain (Fig. 5; Extended Data Fig. 9). These strains exhibit different interference distances when the metric used is genomic length (kb) but exactly the same (WT) interference distance when the metric is μm SC length (Fig. 5; compare top and bottom panels). BF simulations give the same relationships (Extended Data Fig. 9a–c). Thus, in budding yeast, the metric for spreading CO interference is physical chromosome distance, as in mouse, Arabidopsis, human and tomato8, 30–32. SC length differences likely result from altered chromatin loop lengths (kb) without a change in basic axis structure33, 34. In all cases, experimental Zip3 focus distributions are matched by BF simulations that use the WT value for interference distance (LBF). These and other details (Extended Data Fig. 9 legend) provide further evidence of the precision with which the BF model explains diverse CO patterns.
Figure 5. The metric of CO interference is physical chromosomal length (μm).
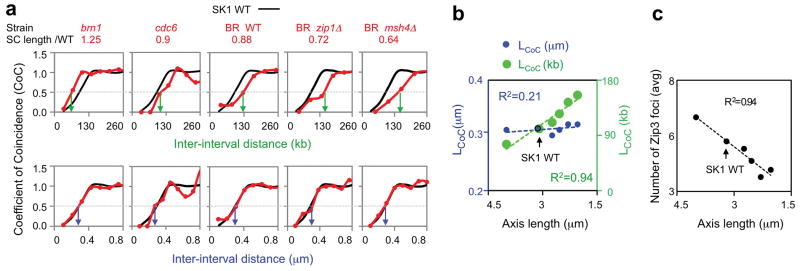
a, b, CoC relationships for strains with different axis lengths (red) relative to WT SK1 (black). a, Interference lengths differ in genomic distance (kb) (top) but are the same in physical distance (μm SC) (bottom). b, LCoC values from Panel a with corresponding linear regression lines. c, Zip3 focus frequencies vary linearly with bivalent axis/SC length.
The TopoII interference pathway is highly specific
None of >20 other examined mutants exhibit altered Zip3 focus patterns including those with: (i) altered axis composition (condensin, pch2Δ); (ii) lacking either a sister chromatid (cdc6) or any/normal SC (zip1Δ; msh4Δ)8,18 (Fig. 5; discussion in Extended Data 9a and Methods); or (iii) deleted for Sir2 relative Hst1; ATM homolog Tel1; meiotic telomere/motion protein Ndj1; chromodomain protein Dot1; DSB-triggered gamma-H2A; TopoII-colocalizing Nse1/Smc5/6; nucleosome density factor Yta7; Mph1, Mlh1/3 and Mms4 (recombination resolution); or Msh2 (mismatch repair) (Extended Data Fig. 6; L.Z. unpublished).
Discussion
Topoisomerase II is essential for normal CO interference, revealing a new, previously unsuspected role for this centrally important molecule.
Presented findings further suggest that CO interference is mediated by communication along prophase chromosome structural axes (Fig. 6a). The TopoII interference pathway involves SUMOylation of Red1, a prominent meiotic axis component. TopoII itself occurs prominently along meiotic prophase axes, in yeast and mammals35, 36 and along the structural axes of mammalian mitotic late-stage chromosomes, to which meiotic axes are related37. Moreover, the TopoII interference pathway requires SUMOylation of TopoII, as well as of Red1. In mitotic mammalian cells, SUMOylated TopoII is implicated in late-stage chromosome structural axes38 and in yeast, SUMOylated TopoII occurs preferentially in centromere regions39 which, during meiosis, mimic CO-designation/interference sites by nucleating SC formation16. Spreading of interference along the axis matches our finding that the relevant metric is physical chromosome distance and the inference that variations in SC length in different mutants resulting from variations in loop length rather than basic axis structure. Finally, spreading along the axis explains how the interference signal is first generated by, and then sensed by, biochemical recombination complexes, which are intimately embedded in the axes from their first inception as pre-DSB ensembles12. Notably, the meiotic prophase axis likely comprises a meshwork of DNA segments joined by linker proteins1,33,37 (Fig. 6ab).
Figure 6. Proposed role of TopoII for CO interference.
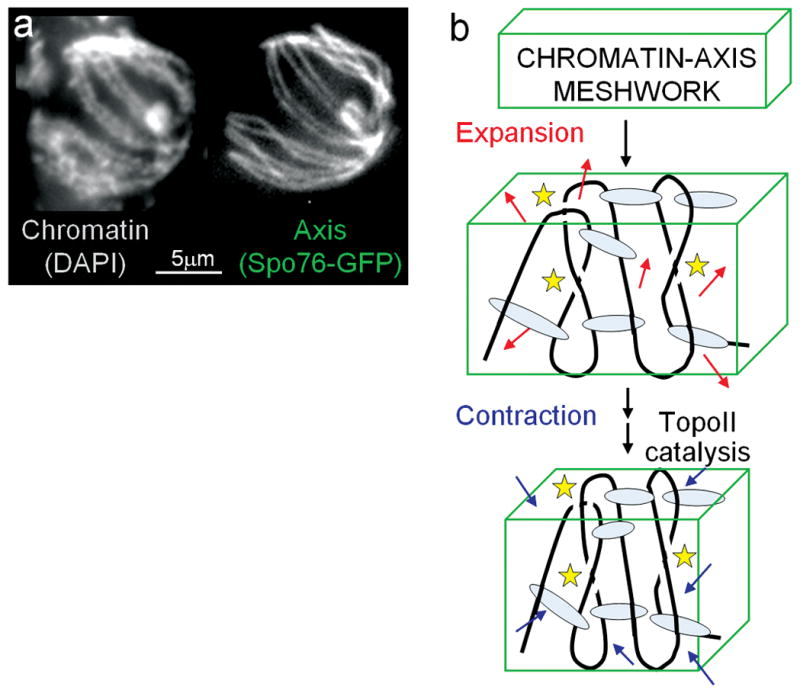
a, Chromosomes at the CO-designation stage (late leptotene), well-visualized in the filamentous fungus Sordaria, suggest that the axis (illuminated with Spo76-GFP) incorporates a significant fraction of chromatin (stained with DAPI) in a DNA/protein structural meshwork (images by D. Zickler). b, Model. (top): Global chromatin expansion within the structural axis meshwork is constrained by meshwork tethers, giving an expanded, mechanically stressed meshwork state. (bottom): Spreading interference creates a more contracted state with resulting reduction in mechanical meshwork stress. Full implementation of contraction, and thus maximal spreading of interference, requires readjustment of spatial relationships among component DNA segments which, comprising topologically closed domains, require TopoII-mediated duplex/duplex passages (yellow stars).
Most importantly: CO interference requires the catalytic activity of TopoII. Since TopoII activity does not require input of external energy from ATP hydrolysis, its reactions must be driven forward, and given directionality, by their substrates, which are changed by TopoII from a higher potential energy state to a lower potential energy state. If substrate for TopoII during CO interference is the axis meshwork (above), that meshwork is first placed in a high potential energy state and then, in response to CO designation, undergoes relaxation, dependent upon TopoII activity. That is: the axis meshwork begins in a mechanically stressed state and is then relaxed to a less mechanically stressed state dependent upon TopoII. This scenario closely matches the proposed stress and stress relief mechanism for CO patterning4, 14 (Methods): stress accumulates along the chromosomes and provokes local CO-designation which, by its intrinsic nature results in local relief of stress. That local change then redistributes along the chromosomes, emanating outward from its nucleation site, reducing stress, and thereby disfavoring additional stress-promoted CO-designations in the affected regions. Given this scenario: what is the source of meshwork stress and how does TopoII alleviate that stress? We previously suggested that mechanical stress arises from axis-constrained global chromatin expansion; CO-designation and interference then involve local nucleation and spreading of chromatin/axis compaction4, 14 (Fig. 6b). TopoII could act during compaction to adjust spatial relationships among DNA segments within the axis meshwork (Fig. 6b), thereby implementing both local relief of stress and its redistribution. The stress-relief role of TopoII is thus specifically targeted to the compaction process, and thus to regions undergoing CO designation/interference. This role also explains why the TopoII pathway is important, but not absolutely essential, for CO interference: in its absence, the basic process of spreading stress relief would occur, but full relaxation would not be possible without meshwork readjustment (Fig. 6b). Interestingly, mitotic chromosomes are constrained by topologically-sensitive linkages and collapse upon removal of protein/DNA links40, 41, exactly as expected for a meshwork under expansion stress.
We further note that the BF model, formulated to quantitatively describe the predictions of a stress and stress relief mechanism,4, 8 accurately and quantitatively describes diverse CO patterning data for WT meiosis, including CO homeostasis, in yeast and other organisms (ref. 8; Fig. 1d, 2d), as well as CO patterning in mutants including: (i) CO interference, CO number and CO homeostasis in mutants defective in the TopoII interference pathway (Fig. 2a,d; not shown); (ii) CO patterns at varying DSB levels in those mutants (Extended Data Fig. 4); and (iii) CO patterns in mutants with altered axis lengths (Extended Data Fig. 9ab). Recent findings in C. elegans42 also can be directly explained by such a model (Supplementary Discussion). Nonetheless: proof that CO patterning involves macroscopic mechanical effects requires direct identification of such effects.
Finally, the current results implicate SUMOylation (of Red1 and TopoII, likely among multiple targets) and ubiquitin-targeted removal of SUMOylated proteins in the TopoII CO interference pathway. These effects presumably act sequentially on the same molecules, which are first specifically SUMOylated and then targeted for removal via STUbL activity. SUMOylation might establish preconditions for CO interference whose subsequent implementation would require removal of those SUMOylated proteins. Alternatively, SUMOylation and STUbL activity might compete actively in a single aspect of the patterning process; or SUMOylation might function only to target protein removal. For yeast TopoII, absence of SUMOylation (in top2SNM) decreases the mobility of chromosome-bound TopoII43, perhaps promoting repeated cycles of TopoII catalytic activity.
Methods
Strains
Yeasts strains used in this study are isogenic derivatives of SK1 (Extended Data Table 1) except for BR strains (Fig. 5) for which Zip2 foci data were kindly provided by J. Fung (UCSF; ref. 18).
Pachytene Zip2/Zip3 foci mark the sites of patterned (“interfering”) COs
In budding yeast, as in many organisms, the majority of COs arises as the consequence of the programmed patterning process characterized by CO interference. However, a minority of COs arises in some other way. The two types of COs are referred to as “patterned”, “Class I” or “interfering” and as “Class II” or “non-interfering”, respectively. We prefer to avoid the terms “interfering” and “non-interfering” for reasons discussed below.
There are a total of ~90 COs per yeast nucleus per round of meiosis as defined by both microarray and genetic analysis44–46. Mutant analysis suggests that the patterned (Class I) COs comprise ~70% of total COs (estimates range from 60–90% in different studies, e.g. refs 47, 48). ~70% of ~90 total COs implies ~63 patterned (Class I) COs per nucleus. Zip2/3 foci appear to specifically mark the sites of patterned (Class I) COs by several criteria.
There are ~65 foci of Zip2, Zip3 and Msh4/5 on yeast pachytene chromosomes per nucleus, and these different types of foci are highly colocalized with one another, implying that they mark the same specific set of recombinational interactions8, 19, 49–51. These foci also colocalize with DSBs formation/repair components, e.g. Mre11 and Rad51/Dmc1, implying that they mark the sites of recombinational interactions (e.g. refs 18, 19, 50 and unpublished data). The number of these foci corresponds well to the predicted number of patterned COs (above). Furthermore, CO levels defined genetically co-vary with the number of Zip2/3 and Msh4/5 foci in mutants examined, e.g. sgs1Δ, tel1Δ and spo11 hypomorphs, implying that they represent an important majority of recombinational interactions (refs 24, 52, 53 and this study). Additionally, Zip2/3 and Msh4/5 have all been implicated specifically in maturation of patterned/interfering COs (e.g. refs 8, 18, 19, 44, 50, 51).
Zip2 and Zip3 foci exhibit robust interference as shown both by CoC relationships for random adjacent pairs of intervals and also by full CoC relationships along specific individual chromosomes (refs 8, 18 and this study). Also, the number of Zip3 foci shows CO homeostasis as defined in strains with altered DSB levels (refs 8, 53 and this study), where homeostasis is dependent upon the presence of CO interference (refs 8, 24 and this study). In contrast to Zip2/3 foci, total COs show much weaker interference8.
-
Our BF model can accurately explain total CO patterns (including CoC relationships and the event distribution for total COs) by assuming that Zip2/3 foci mark the sites of patterned (Class I) COs; that Class II COs represent ~30% of total COs; and, furthermore, that Class II COs arise from the interactions that are “leftover” after the operation of CO-designation and interference8. These “leftover” interactions are usually matured without exchange of flanking markers, i.e. to “non-crossover” (NCO) products. However, as proposed by N. Hunter15 and modeled in our analysis, these interactions may sometimes proceed to a CO outcome instead of a NCO outcome, thus giving Class II COs. Such a mixture of NCOs and a few COs would make the outcome for leftover meiotic interactions similar to the outcome of mitotic DSB repair.
We also note that the term “non-interfering” is misleading when applied to Class II recombinational interactions. In budding yeast, as in several (possibly all) other organisms, total recombinational interactions tend to be evenly spaced along each bivalent8. As a result, not only will patterned/Class I COs exhibit interference, so too will total interactions and Class II COs; moreover, Class II COs will interfere with patterned (Class I) COs8.
-
Both Zip2 and Zip3 foci occur specifically on the association sites between homologs in zip1Δ chromosomes18, 50. Analysis of Zip2 foci reveals that they exhibit interference8, 18. Moreover, they exhibit the same level of interference along zip1Δ chromosomes as along WT chromosomes when the metric of interference is physical distance (text Fig. 5).
We note that this robust cytological interference contrasts with the fact that, by genetic analysis, CO interference is significantly compromised in a zip1Δ mutant (e.g. refs 44, 54). It also can be noted that cytological and genetic studies were carried out in different strain backgrounds (BR at 30°C and SK1 at 30°C, respectively). This is because: (a) in BR at 30°C, zip1Δ chromosomes are well-formed to permit cytological analysis but meiosis arrests during prophase, thus precluding genetic analysis of recombination outcomes; whereas (b) in SK1 at 30°C, zip1Δ chromosomes are less well-formed, thus making cytological analysis more difficult, whereas meiosis does not arrest, thus permitting genetic analysis.
One possible explanation for the absence of genetic interference in the latter case can be excluded. In principle, CO-designation and interference might occur normally and then be followed by a CO-specific “maturation defect”, i.e. a defect in the probability that designated interactions will actually mature to detectable COs. This scenario is not acceptable because, in such a situation, the detectable COs that do manage to form will still exhibit normal interference8. By contrast, a diagnostic maturation effect can be seen in an mlh1Δ mutant8, 55.
Two other, not mutually exclusive, explanations for absence of genetic interference in zip1Δ can be suggested.
In WT meiosis, CO interference is fundamentally a structure-based process to which DNA events are biochemically coupled as a downstream consequence. By this scenario, Zip1 would not be required for local “CO-designation” and interference at the structural level but would be required either to (a) set up coupling between CO/NCO decisions and biochemical events and/or (b) transduce the structural interference signal into the appropriate biochemical outcome. It appears that CO-designation is a specifically programmed outcome and interactions which are not CO-designated mature instead to NCOs as the default option15, 24. It further appears that some of these “NCO-fated” interactions may actually mature into CO products, thus giving the “non-patterned” COs which are not marked by Zip3 foci8. Thus, in scenario (a), all interactions might progress to the “NCO” outcome, giving an increase in NCOs and some COs as well, with those COs exhibiting the same distribution as total precursor interactions. This is, in fact, the phenotype observed at the HIS4LEU2 hot spot in SK1 zip1Δ at 30°C14. In scenario (b), CO/NCO differentiation would occur at the biochemical level but there would be no progression of CO-fated interactions. This is, in fact, the phenotype observed at the HIS4LEU2 hot spot in SK1 zip1Δ at 33°C14.
A reduction in the frequency of mature patterned (Class I) COs might be accompanied by an increase in the frequency of COs from other sources, e.g. occurrence of additional DSBs, some of which then give rise to COs56. Attempts to model this situation with BF simulations suggest that the level of extra events required to confer the strong defect in CO interference observed in zip1Δ is very high (L.Z. unpublished). Thus, this effect may contribute to, but not be the sole basis for, absence of CO interference in zip1Δ.
Localization of Zip3 along yeast chromosomes has been evaluated molecularly by ChIP analysis57. This analysis identifies peaks and valleys of Zip3 abundance, genome wide, at different times of meiosis, and relates the positions of those peaks to peaks of Rec8 and Red1 (markers for chromosome axes at mid-prophase) and to peaks corresponding to DSB sites (marked by ssDNA in a dmc1Δ strain). Zip3 is initially most prominent at centromere regions. This localization, which corresponds to the early leptotene Zip1 centromere association seen cytologically; is independent of DSB formation; is prominent at t=3h, about the time of DSB formation; and mostly disappears by t=5h, the time of pachytene when Zip3 foci are assayed here. Correspondingly, we find no tendency for Zip3 foci to occur at centromeres in pachytene (L.Z. unpublished). At t=4 and 5 hours, Zip3 appears in colocalization with chromosome axis markers and DNA DSB sites. Axis-localization slightly precedes DSB site localization and remains high while DSB site localization increases prominently, apparently in correlation with post-CO-designation CO-specific events. It is very difficult to make any relationship between ChIP results and cytological focus analysis for several reasons. (i) ChIP analysis looks at a population average localization, not a per-nucleus localization. (ii) At t=4 hours, most cells are in leptotene/zygotene, which we do not examine cytologcially. Moreover, even at t=5h, only ~50% of cells are in pachytene. Thus, ChIP data include significant signals from irrelevant stages. (iii) The resolution of ChiP analysis is ~1–5kb, with axis-association sites tending to alternate with DSB sites at separations of 5–10kb11, 57. In contrast, Zip3 foci extend ~300nm along the chromosome (0.3±0.06 μm; N = 320), which corresponds to ~90kb in the present study (average for chromosomes III, IV and XV). Thus, a single Zip3 focus can encompass multiple axis association and DNA DSB sites. Correspondingly, ChIP analysis may well be detecting sub-focus level alterations within a CO-designated region that reflect changes in the intimate molecular crosslinkability of Zip3 molecules to different types of DNA segments without any change in the position of the associated Zip3 focus. For example, the finding of more prominent ChIP localization to DSB sites in mutants that progress farther into recombination may reflect the extent to which those sequences are no longer buried within earlier recombination complexes. (iv) To further complicate matters, it is clear cytologically that a low level of Zip3 localizes all along pachytene chromosome axes beyond that present in prominent foci. This general background will be detected in ChIP analysis but not by Zip3 focus analysis.
Visualization and Definition of SC lengths and Zip3 focus positions (additional details in ref. 8)
Meiotic time courses and sample preparation
Appropriately pre-grown cell cultures were taken through synchronous meiosis by the SPS method58, 59, with meiosis initiated by transfer of cells to sporulation medium (t=0). Cells were harvested at t= ~ 4–5 hours, the time at which pachytene cells are most abundant (comprising ~50% of all cells). Harvested cells were spheroplasted to remove the cell wall and then resuspended in MES wash (1 M sorbitol, 0.1 M MES, 1 mM EDTA, 0.5 mM MgCl2 pH 6.5). Cells were then lysed and spread on a glass microscope slide with 1% Lipsol (LIP Ltd., Shipley England) and fixed by 3% w/v paraformaldehyde with 3.4% w/v sucrose as described by Loidl et al.60.
Fluorescence visualization
Glass slides with spread nuclei were incubated at room temperature for 15 minutes in 1 x TBS buffer (25 mM Tris-Cl, pH 8, 136 mM NaCl, 3 mM KCl) then blocked with 1 x TBS buffer with 1% w/v Bovine serum albumin (BSA) for 10 minutes. Chromosomes in spread nuclei were then stained with appropriate antibodies. Primary antibodies were mouse monoclonal anti-myc (for detection of Zip3-Myc), goat polyclonal anti-Zip1 (Santa Cruz) and rabbit polyclonal anti-GFP, were diluted 1:1000 in 1 x TBS- 1% BSA. Secondary antibodies were anti-mouse, anti-goat and anti-rabbit IgG were labeled with Alexa488, Alexa594 or Alexa555 (Molecular Probes), respectively; all were diluted 1:1000 in 1 x TBS- 1% BSA. Slides were mounted in Prolong Gold antifade (Molecular Probes). For condensin mutants and spo11 hypomorphs with very low DSB levels, Zip1 staining was less bright than in WT, so axes were usually visualized by immunostaining of Rec8-3HA with rat anti-HA primary antibody and anti-rat labeled with Alexa 647 or 594 secondary antibody. Control experiments confirm that the same SC lengths and Zip3 focus numbers/distributions/CoC relationships are obtained with either Zip1 staining or Rec8 staining. Stained chromosome spreads were visualized on an Axioplan IEmot microscope (Zeiss) using appropriate filters. Images were collected using Metamorph (Molecular Devices) image acquisition.
Defining Zip3 focus positions and SC lengths
Images for Zip3, Zip1 (or Rec8) and LacO/LacI-GFP staining (text Fig. 1ab) were merged and aligned. The GFP-marked chromosome was analyzed in nuclei where it was unambiguously separated from other chromosomes. The segmented line tracing tool of Image J software (NIH) was used. Each trace was initiated at the center of the GFP focus which typically falls beyond the end of the SC (white line in Figure 1B). The trace was continued following the path of the Zip1 (Rec8) signal for the entire length of the chromosome. As the trace encountered a position judged (by eye) to be the center of a Zip3 focus, that position was annotated using the “mark position” function (control M). By application of the “zoom” function, the annotated position of each Zip3 focus could be defined at the 1 pixel level (~0.067 μm under our microscope). The distal end of the Zip1 (Rec8) signal was also annotated. SC length is given by the annotated position mark at the end of the trace. Importantly, by this approach, each Zip3 focus (and the value for total SC length) was subject to its own positioning error (evaluated below) with no accumulation of error along the trace.
Accuracy of Zip3 focus (SC length) positions
The accuracy of the results obtained by the above approach was evaluated in several ways. (1) CoC curves are highly reproducible in multiple experiments of the same strain as shown by the correspondence of CoC values among different chromosomes (Fig. 1d) and for four independent analyses of a single chromosome8. (2) The intensity of Zip3 can be determined quantitatively along the trace and the positions of intensity peaks compared with the positions of foci defined by eye. The two methods give virtually identical results except that the eye can distinguish a significant number (~5%) of foci that are not, or less, obvious in the trace (e.g. as shoulders on major peaks). (3) To determine the precision with which each focus position (or each SC length) is defined in a given trace, chromosome XV was traced six times in each of four nuclei. The four bivalents exhibited four Zip3 foci (one case) or five Zip3 foci (three cases). The variation in the absolute position of a given focus (or SC length) among a set of six duplicate traces ranged from 0 to 0.14 μm with an average of 0.08 μm (80nm). Furthermore, for each focus among six traces, the SD of this variation ranged from 0.02–0.04 μm. In summary: the absolute position of each Zip3 focus (or total SC length) for a given traced bivalent is specified with an accuracy of approximately one pixel (67nm).
We also carried out reconstruction experiments to assess the possible effects of one-pixel accuracy on CoC curves. For four WT and two pCLB2-TOP2 experimental data sets, independently, Zip3 focus positions were subjected to computational “adjustment”, with the position of each focus moved by one pixel in one direction or the other, randomly for different foci. The CoC curve was then re-calculated. The values of LCoC were not changed (0.3±0.01 μm before and after “adjustment”; further discussion of accuracy of CoC curves below). There were very subtle changes in the shape of the CoC curve. However, the nature of these changes in fact suggests that the relationships from the position-randomized data set represent a degradation of the more robust interference relationships observed in the primary data. (i) At smaller inter-interval distances (<0.2 μm) CoC values are slightly higher. This is expected by the fact that randomized movement will artificially increase the fraction of closer-together focus pairs. (ii) At larger inter-interval distances, CoC values fail to rise above one. This is expected because randomized movement will reduce the tendency for the inter-focus position to exhibit a node at the most likely inter-CO position(s) (further explanation in next section).
Analysis of Zip3 focus (CO) patterns: CoC and MCoC relationships
CoC relationships (e.g. Fig. 1d)
The Coefficient of Coincidence (CoC) analysis is the classical indicator of CO interference61. If carried out correctly (with a sufficiently large number of intervals) with a sufficiently large data set, CoC curves provide a highly accurate description of CO patterns (discussion in ref. 8). We note that, in contrast, mathematical analysis of “evenness” by application of the gamma distribution, while “model-independent”, can give a misleading impression with respect to mutant phenotypes or other types of variation (discussion in ref. 8). For example: either a defect in maturation of COs after their positions have been designated has no effect on interference and thus does not affect CoC relationships but significantly alters the value of the gamma “evenness” parameter. CoC curves for Zip3 foci were obtained using the “Analyze CO data” feature of the BF program, using as an input the experimentally-defined positions of Zip3 foci in a given experiment8. For this purpose, chromosomes are divided into a number of intervals with equal size (detailed discussions in ref. 8 Protocol S1). For each interval the total frequency of Zip3 foci in the set of chromosomes examined is determined. Then, for each pair of intervals, the observed frequency of chromosomes exhibiting a Zip3 focus in both intervals (referred to for convenience as “double COs”) is determined. This value defines the frequency of “observed double COs”. If COs (Zip3 foci) arise independently in each interval, the predicted frequency of double COs for a given pair of intervals should be the product of the frequencies of COs (Zip3 foci) in the two intervals considered individually. This product is the frequency of “expected double COs”. The Coefficient of Coincidence for that particular pair of intervals is the ratio of these two frequencies, i.e. observed/expected for that interval pair. A CoC curve is obtained by considering all possible pairs of intervals, with the CoC value for each pair plotted as a function of the distance between (the midpoints of) the two corresponding intervals. For a classical CoC curve, at very small inter-interval distance, the CoC is close to zero, indicating very strong CO interference. As the inter-interval distance increases, the CoC also gradually increases, indicating that CO interference decreases with increased inter-interval distance. Eventually, the CoC value reaches one, implying that, at the corresponding inter-interval distance, CO interference no longer has any influence. At certain specific larger inter-interval distances, the CoC value tends to be greater than one, implying that, at these distances, there is a higher probability of double COs than predicted on the basis of independent occurrence. Nodes of CoC > 1 tend to occur at inter-interval distances that correspond approximately to the average inter-CO distance and multiples thereof (see ref. 8 for more examples). This pattern reflects the fact that operation of CO interference tends to create an evenly-spaced array of COs (Zip3 foci, in this analysis).
For convenience, the inter-interval distance at which the CoC = 0.5 is defined as LCoC and can be used as a measurement for “CO interference strength”, by which is meant the effective distance over which CO interference acts. Importantly, at a mechanistic level, variations in LCoC can result from variations in features other than the distance over which the interference signal spreads (e.g. as discussed for BF simulations below). Values of LCoC are highly reproducible from one experiment to another. For the three analyzed chromosomes in WT meiosis, values for individual experiments and the average and standard deviations are as follows: Chromosome XV: 0.31, 0.3, 0.32, 0.32 (0.31 ± 0.01; N=4). Chromosome III: 0.31, 0.32, 0.3 (0.31 ± 0.01; N=3). Chromosome IV: 0.31, 0.32 (0.32 ± 0.1; N=2). Further documentation is in ref. 8.
Modified CoC analysis (Fig. 1e)
As an alternative approach to evaluating the effective interference distance, we adapted the “modified CoC” approach previously described for analysis of genetic CO data21. For the present purpose, each interval is used as a reference (Ref; Fig. 1e top left). Chromosomes are then divided into two groups, those with or without a CO (Zip3 focus) in this reference interval (CO+R or CO−R). Another nearby interval is then selected as a test (Test (T)). For each reference group (CO+R or CO−R), the numbers of chromosomes with and without a CO in this test interval is determined (CO+T and CO−T). If CO levels are lower in the CO+R group than in the CO−R group, the presence of a CO in the reference interval has reduced the probability of a CO in the Test interval; that is, interference emanating from the reference interval has been felt in that Test interval. When this evaluation is performed for all intervals in the vicinity of a given reference interval, it reveals the distance over which interference extends outward from that interval, giving LMCoC for that reference interval (Fig. 1e top right). Determination of LMCoC values for all intervals along each of the three analyzed chromosomes gives an average LMCoC for that chromosome (Fig. 1e bottom right).
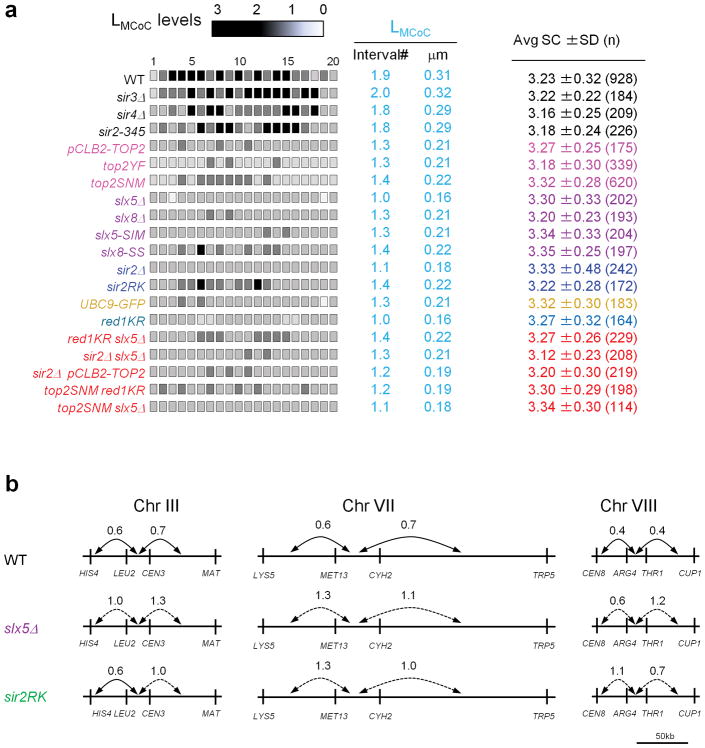
This analysis requires an evaluation, for each comparison between a reference interval and a test interval, of whether the relative frequencies of CO+T and CO−T chromosomes are the same for the CO+R and CO−R groups or different (i.e. lower in the CO+R group). For this purpose, Fisher’s exact test was applied. Since interference is stronger (and thus more likely to be statistically significant) at shorter distances, the more stringent the probability specified by Fisher’s exact test, the shorter the inferred “interference distance”. The standard criterion for significance by this method is p < 0.05. By this criterion, LMCoC for the three analyzed chromosomes in WT meiosis was 0.3μm, which is the same as LCoC as defined above. With a more stringent criterion, p < 0.01, LMCoC is slightly shorter (0.25μm). Importantly, mutants with decreased interference distance always showed decreased LMCoC compared with WT regardless of whether the standard, or more stringent, criterion was applied. Thus: when p < 0.05, LMCoC in top2 mutants versus WT was 1.3 intervals vs 1.9 intervals (i.e. 0.2μm vs 0.3μm); when p < 0.01, LMCoC in top2 mutants versus WT was 1.0 versus 1.5 in WT (i.e. 0.16μm vs 0.25μm). Given that p < 0.05 is the standard value applied for Fisher’s exact test plus the fact that LCoC and LMCoC correspond at p < 0.05, we have adopted this level of stringency to describe LMCoC in the present analysis (Fig. 1, 2 and 4; Extended Data Fig. 3).
BF simulations
The BF model and the program used for simulations are described in detail in refs. 4 and 8. The BF program was recently rewritten in MATLAB (R2010a), which is downloadable with the link: https://app.box.com/s/hv91q2nrtq0cp9n8iy9m.
Outline of the beam-film model
An array of precursor interactions comes under global stress which causes a first (most sensitive) precursor to go critical, undergoing a stress-promoted change that commits it to becoming a CO (“CO designation”). The intrinsic effect of this change will be a local reduction in the level of stress at the site of the change. To even out distribution of stress along the chromosome, the initial local reduction in stress then redistributes outward in both directions, thus reducing the probability that any subsequent CO-designation(s) will occur in the affected region. This effect comprises CO interference. Assuming that the system does not comprise a single elastic component, the extent of stress reduction will dissipate with increasing distance away from the nucleation site, becoming negligible over a characteristic distance (corresponding to the “interference distance”. A second CO-designation may then occur. If so, that CO will occur preferentially at a position that retains a high stress level and thus preferentially at some distance away from the position of the prior CO-designation. This second CO-designation will again result in local stress relief and redistribution (and thus interference), giving a new stress landscape along the chromosome. If/as additional events occur, they will tend to fill in the holes between prior events, thus giving an evenly-spaced array. The BF model predicts the number and array of COs that will occur in particular system with particular mechanical properties that are analogous to a known system in the physical world (the “beam-film system”). In this particular system, the magnitude of the stress reduction decreases exponentially with distance away from its nucleation point.
BF best-fit simulations
In BF simulation analysis, parameters of the BF model are varied so as to define the constellation of parameter values at which the predicted array of CO events best matches that observed experimentally for a particular data set8. As described in detail elsewhere8, the parameters to be specified fall into three categories that describe, respectively: (i) the array of precursor interactions upon which CO patterning acts; (ii) the nature of the patterning process per se; and (iii) the probability that a CO-designated interaction will actually mature to an experimentally-detectable CO or CO marker, i.e. a Zip3 focus.
For purposes of modeling, the level of global stress is progressively increased up to a maximum specified level (Smax). As the level of stress increases, precursors will undergo CO-designation sequentially in relation to their relative local stress levels at that moment in the sequence of events (differently for different bivalents according to their specific histories). Each CO designation triggers reduction in stress, in both directions, over a characteristic length given by a specific parameter (L). The value of (L) for a particular simulation is directly reflected in the resultant CoC relationships and turns out to correspond very closely to the inter-interval distance at which CoC = 0.5, defined here as LBF. A third patterning parameter (“A”) describes precursor reactivity, i.e. the way in which the probability of CO-designation varies as a function of the local stress level at the corresponding position. A fourth patterning parameter (“clamping”) permits adjustment of CO probabilities near chromosome ends.
Parameter values for BF best-fit simulations of COs (Zip3 foci) along wild type yeast chromosomes are described in ref. 8. The best-fit simulations for mutant patterns presented in the text Figs. 2a, 3abc, 4a and 4b (except mutants with altered axis lengths) were obtained using these same parameter values except that the value of (L) was appropriately reduced, from ~0.3μm to ~0.2 μm, resulting in a commensurate reduction in LBF. Best-fit simulations in situations with altered DSB levels (Fig. 2d) also involved changes in the number of precursors (N) as discussed below (“CO homeostasis”) and in Extended Data Fig. 4. Best-fit simulations in mutants with altered axis lengths also involved changes in the number of precursors (N) as discussed in Extended Data Fig. 9.
CO homeostasis analysis
CO homeostasis is a non-linear relationship between the number of DSBs and the number of COs8, 24. The existence and magnitude of CO homeostasis is dependent upon the existence and strength of CO interference (text; ref. 8).
BF simulations of CO homeostasis
A BF best-fit simulation predicts the number of COs that will occur if CO-designation and interference occur according to a specific set of values for involved parameters. To get a simulated CO homeostasis curve under a particular set of conditions, multiple BF simulations were carried out at different values of the precursor number (N), which were varied over a desired range, and with the values of all other parameters held constant. The average numbers of COs predicted for each evaluated value of (N) are then plotted as a function of (N). Such curves are then obtained analogously at different values for the interference distance (L) (ref. 8; Fig. 2d).
Experimental evaluation of CO homeostasis by Zip3 focus analysis
The positions of Zip3 foci were determined along specific marked chromosomes (XV and III) in a series of strain backgrounds known to give varying levels of DSBs, in both a TOP2 and a pCLB2-TOP2 background. CoC relationships and the numbers and distributions of Zip3 foci per bivalent for all strains are given in text Fig. 1 and 2 and Extended Data Fig. 2 and 4. Average Zip3 focus numbers per chromosome (average ± SD) are shown in text Fig. 2d and listed in the legend to Extended Data Fig. 4.
DSB levels were decreased below WT levels by a previously described series of hypomorphic spo11 alleles (spo11HA, spo11YFHA, spo11DAHA; ref.24). DSB levels were increased above WT levels using a tel1Δ mutation, alone and in combination with a spo11 hypomorph (tel1Δ spo11 HA). The average numbers of Zip3 foci per bivalent in the different strains were then plotted as a function of BF precursor or DSB level (discussion below). Such analysis was carried out in strain backgrounds that were also either (i) WT for CO interference (TOP2) or (ii) carried the pCLB2-TOP2 construct that results in meiotic depletion of Topoisomerase II (text).
The number of DSBs per bivalent in a TOP2 strain with WT DSB formation can be accurately determined based on comprehensive evaluation results from DSBs mapping (e.g. ref. 12), microarray (e.g. ref. 45) and classical genetic measurements (http://www.yeastgenome.org). The number of DSBs on chromosome III, IV and XV are thus defined as 6, 19, and 13 respectively. The relative levels of DSBs in strains carrying spo11 mutations has been evaluated in a TOP2 background by gel electrophoresis in a rad50S background24 (where DSBs do not turn over). In the tel1Δ mutant, DSBs are increased by ~50% at HIS4LEU2 locus in a rad50S background without significantly altering CO interference8, 62 (Extended data Fig. 7; unpublished).
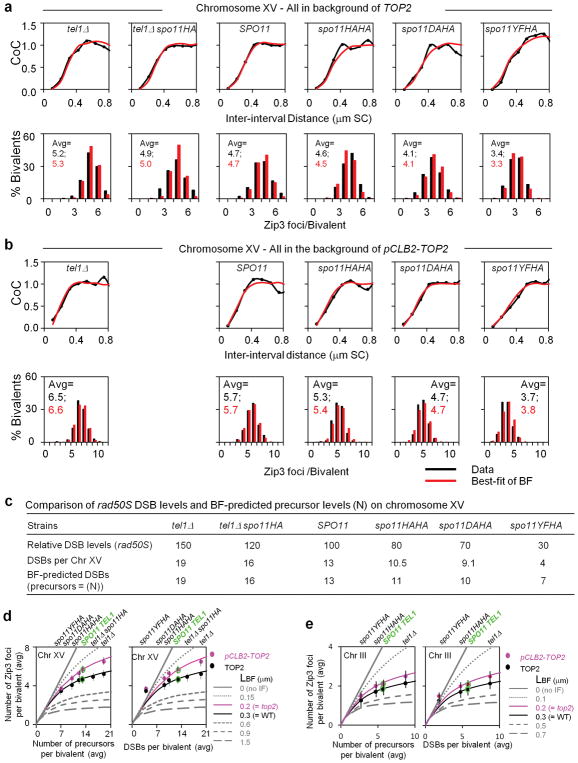
However, in some regions and circumstances, rad50S DSB levels are known to be lower than the level of DSBs in RAD50 meiosis (e.g. refs 11, 12). Furthermore, rad50S analysis of spo11/tel1Δ alleles in a pCLB2-TOP2 background has not been performed. We therefore also evaluated DSB levels by application of BF analysis. For all strains analyzed for Zip3 focus patterns, both TOP2 and pCLB2-TOP2, best-fit BF simulations were defined8 (text Fig. 2–4, Extended Data Fig. 2 and 4). For each strain, all parameter values were held constant at those defined for the two SPO11 TEL1 cases (text) except that the average number of precursors per bivalent (N) was varied to determine the value that gives the optimal match between observed and predicted CO patterns for that strain. BF-predicted DSB/precursor levels are the same for the TOP2 and pCLB2-TOP2 versions of all strains (Fig. 2–4, Extended Data Fig. 4c). This prediction matches the experimental finding that TOP2 and pCLB2-TOP2 strains exhibit the same level of total inter-homolog events (CO+NCO) at HIS4LEU2 in a RAD50 SPO11 TEL1 background (Extended Data Fig. 8). Furthermore, for TOP2 strains, DSB/precursor values obtained by BF simulations are very similar to those obtained based on rad50S analysis (Extended Data Fig. 4c). Correspondingly, CO homeostasis relationships are very similar regardless of whether DSBs or BF-predicted precursors are used as the metric (Fig. 2d; Extended Data Fig. 4d).
Interestingly, experimentally-determined rad50S DSB levels tend to be slightly lower than those predicted by BF analysis, especially at lower DSB levels (Extended Data Fig. 4). Moreover, experimental data match BF-predicted CO homeostasis relationships somewhat more accurately when the metric of DSB level is the BF-predicted precursor level, especially at lower DSB/precursor levels (Extended Data Fig. 4d). This correspondence suggests that BF-predicted values may be more accurate than rad50S experimental values. Data of Martini et al.24 support this conclusion: at HIS4LEU2, a spo11HA/HA strain exhibits 50% the SPO11 level of rad50S DSBs but 62% the level of inter-homolog recombination products (CO+NCO), implying a deficit of 20% by rad50S analysis. Similarly, a spo11HA/DA strain exhibits 20% the SPO11 level of rad50S DSBs but 27% the level of inter-homolog recombination products, a deficit of 26%.
These analyses also provide further evidence (in addition to that presented in Extended Data Fig. 7) that the increased number of Zip3 foci seen in top2 mutants as compared to TOP2 strains cannot be explained as increased DSBs.
Extended Data
Extended Data Figure 1. Top2 protein level and localization on chromosomes in three top2 mutants.
a, Top2 protein levels shown as a function of time after entry into meiosis (t=0). Top2 levels are severely reduced in pCLB2-TOP2 (middle panel) and are the same as WT in pCLB2-TOP2 top2YF (± 20% relative to anti-Pgk1 control). Western blot analysis was performed with anti-Top2 antibody (TopoGEN Cat#2014) and anti-Pgk1 antibody (Abcam Cat#ab113687). b, Immunostaining of Top2 on meiotic chromosomes with the same antibody used for Western blot analysis in (a): at pachytene (shown) and also at leptotene (data not shown). Top2 is undetectable on chromosomes in pCLB2-TOP2 and is present at similar levels to WT in pCLB2-TOP2 top2YF and top2SNM. Chromosomes were concomitantly immunostained for Zip1 (Santa Cruz, SC-48716) as in text Fig. 1. Scale bars, 3 μm.
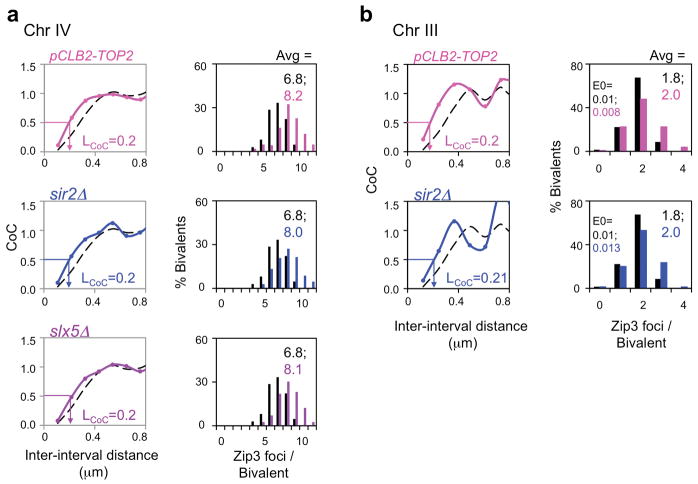
Extended Data Figure 2. Decreased CO interference in pCLB2-TOP2 and sir2Δ, slx5Δ is confirmed on other chromosomes.
a, b, The same decreases in CO interference (LCoC = ~0.2 μm vs ~0.3 μm in WT) and corresponding increases CO number observed for the indicated mutants on Chromosome XV (text Figs 2, 3) are also observed on chromosomes IV and III in pCLB2-TOP2 and sir2Δ, and on chromosome IV in slx5Δ. Data for WT in black.
Extended Data Figure 3. Decreased CO interference as revealed by modified CoC and tetrad analysis using the method of ref. 21, but SC length is the same as in WT.
a, By Modified CoC analysis (text Fig. 1; Methods), CO interference can extend to ~2 intervals on either side of the reference interval (LMCoC = ~0.3 μm) in WT and in three sir2 mutants that exhibit WT CO patterning by other criteria (LCoC = ~0.3 μm; text Fig. 3; Extended Data Figure 2). In contrast, in all examined single and double mutants where CO interference is defective (LCoC = ~0.2μm; text Figs 2–4), CO interference extends only ~1.3 intervals (LMCoC = ~0.2 μm) (for top2 mutants, see also text Fig. 2). Right column shows SC lengths for each of the analyzed strains (average ± SD). There is no significant difference between strains exhibiting WT interference (average of averages is 3.25 ± 0.06 μm) and strains defective in the top2 interference pathway (average of averages is 3.27 ± 0.07 μm). b, Decreased CO interference in slx5Δ and sir2RK as revealed by tetrad analysis. Each pair of intervals was tested, reciprocally, for the ratio of the map distances in one interval with and without COs in the other interval. Each number shows the average of the ratios for the two reciprocal cases. A value less than one indicates CO interference. Solid and dotted lines indicate whether the level of interference is statistically (p<0.05 by G-test) significant or not, respectively. Genetic CO interference is greatly decreased in slx5Δ, and sir2RK relative to WT on each of three chromosomes. Tetrad data upon which this analysis is based are given in Supplementary Table 2.
Extended Data Figure 4. Additional aspects of CO homeostasis analysis.
a, b, CO patterns along chromosome XV in TOP2 strains (a, black) and pCLB2-TOP2 strains (b, black) with WT or altered DSB levels as conferred by the indicated spo11/tel1 genotypes (for CO homeostasis analysis; text Fig. 2d and Methods). All experimental data sets were also subjected to BF simulation analysis (panels a, b red). In all cases (panels a, b red), best-fit simulations were obtained by using the same parameters as those that give the best-fit for SPO11 TEL1 meiosis (ref. 8; text Fig. 2a) except that number of precursors (given by parameter N) was altered to account for alterations in DSB levels in the different strain backgrounds (LBF = 0.3 μm in TOP2 background vs 0.2 μm in PCLB2-TOP2 background; Methods; below). For each spo11/tel1 genotype, the best-fit value of (N) is the same in pCLB2-TOP2 as in TOP2, thus confirming that the only change in various pCLB2-TOP2strains examined is a change in precursor number, with no change in interference. The same results are seen also for BF simulations of analogous data for chromosome III (not shown). These results further illustrate the accuracy with which BF simulations can describe diverse CO patterns. c, Comparison of rad50S DSB levels and BF-predicted precursor levels (N) for chromosome XV among strains with varying DSB levels due to different SPO11 TEL1 or carrying spo11 and/or tel1 mutant alleles. Top line: number of DSBs genome-wide, relative to WT = 100, as defined by rad50S analysis in TOP2 strains, either SPO11 TEL1 or carrying spo11 and/or tel1 mutant alleles (details in Methods). Middle line: number of DSBs predicted for chromosome XV. Number of DSBs in TOP2 SPO11 TEL1 was defined by several approaches (details in Methods). DSBs per chromosome XV as predicted for spo11/tel1 mutant strains by comparison of rad50S DSB levels relative to SPO11 TEl1 (top line). Bottom line: number of precursors predicted to be present by BF best-fit simulation analysis (given by parameter (N), above). Predicted values are the same for TOP2 and pCLB-TOP2 strain series (from simulations in panels a, b). Note that in strains with lower total DSB levels, rad50S analysis gives lower DSB/precursor levels than BF simulations (discussion in Methods). Analogous results are obtained for chromosome III, as follows: (i) The predicted values of (N) are the same for both TOP2 and pCLB2-TOP2 strain series: N=9 for tel1Δ, 6 for TEL1 SPO11; 5 for spo11-HA/spo11HA; 3 for spo11-HA/spo11YF. (ii) These predicted values of (N) correspond well to DSB values predicted from rad50S analysis except at the lowest DSB levels: predicted DSBs = 9 for tel1Δ, 6 for TEL1 SPO11; 5 for spo11-HA/spo11HA; 2 for spo11-HA/spo11YF. d, Experimentally-determined numbers of Zip3 foci from the analyses of Chromosome XV in a, b are plotted as a function of either the number of precursors predicted by BF simulation analysis (left) or the number of DSBs predicted by rad50S DSB analysis (right) (values from panel c). e, Same as d, except that analysis was performed for Chromosome III. A slightly better match of experimental data to BF simulation predictions is obtained when the x-axis metric is predicted precursor number than when it is rad50S predicted DSB levels, suggesting that BF simulations are more accurate than rad50S DSB analysis, which is known to underestimate DSBs in several situations.
Note: for each strain and chromosome, Zip3 foci were analyzed in 200–300 cells. The average numbers of foci per bivalent ± SD as presented in panels d and e were as follows:
TOP2 Chr. XV (panel d): tel1Δ 5.21 ± 0.93; tel1Δ spo11HA 4.92 ± 1.12; TEL1 SPO11 4.67 ± 1.16; spo11HA/spo11HA 4.11 ± 0.97; spo11HA/spo1DA 4.07 ± 1.07; spo11HA/spo11YF 3.51 ± 0.88.
pCLB2-TOP2 Chr. XV (panel d): tel1Δ 6.46 ± 1.13; TEL1 SPO11 5.96 ± 1.1; spo11HA/spo11HA 5.29 ± 0.99; spo11HA/spo11DA 4.76 ± 0.94; spo11HA/spo11YF 3.71 ± 0.98.
TOP2 Chr. III (panel e): tel1Δ 2.16 ± 0.59; TEL1 SPO11 1.82 ± 0.55; spo11HA/spo11HA 1.7 ± 0.62; spo11HA/spo11YF 1.31 ± 0.66.
pCLB2-TOP2 Chr. III (panel e): tel1Δ 2.49 ± 0.82; TEL1 SPO11 2.1 ± 0.87; spo11HA/spo11HA 2.07 ± 0.75; spo11HA/spo11YF 1.51 ± 0.69.
Extended Data Figure 5. Increased level of SUMO-protein conjugates in slx5Δ.
a, Western blots for whole protein extracts in WT and slx5Δ probed with anti-Smt3 antibody (Santa Cruz, SC-28649) and anti-Pgk1 antibody (Abcam Cat#ab113687) as a function of time after entry into meiosis (t=0). Abundance of SUMO conjugates is increased in the mutant, especially in high molecular weight regions. b, Quantification of the gel in a.
Extended Data Figure 6. The role of Sir2 in CO interference is specific to its interaction with Slx5.
WT CO interference is seen in diverse sir2 non-null mutants affecting specific sub-functions (other than sir2RK; text Fig. 3) and in mutants deleted for various interaction partners. sir2-345 is defective in histone deacetylase activity63; sir2ΔC500 lacks a Sir2 cohesion role64. sir3Δ, sir4Δ, esc2Δ and esc8Δ eliminate Sir2 interaction partners involved in silencing43, 65, hst1Δ eliminates a Sir2 homolog66.
Extended Data Figure 7. Mutant CoC and CO number phenotypes cannot be explained by increased DSBs or by prolongation of the CO-designation stage.
Mutants in the described CO interference pathway all confer coordinate changes in CO interference, which is reduced, and the total number of COs, which is increased, by about 20% on Chromosome XV. There are the expected consequences of a single defect in CO interference, as illustrated by corresponding BF simulations which quantitatively explain these results by a change in a single parameter, the interference length (LBF) (text Fig. 2, 3). This interference defect could comprise a defect in generation and spreading of the inhibitory signal and/or of the ability of unreacted precursors to respond to that signal (text; Methods - “BF simulations”). An increase in the number of COs can also occur as the result of either (i) prolongation of the CO-designation period or (ii) an increase in the number of DSBs8. Neither of these effects can explain the mutant phenotypes described in the text.
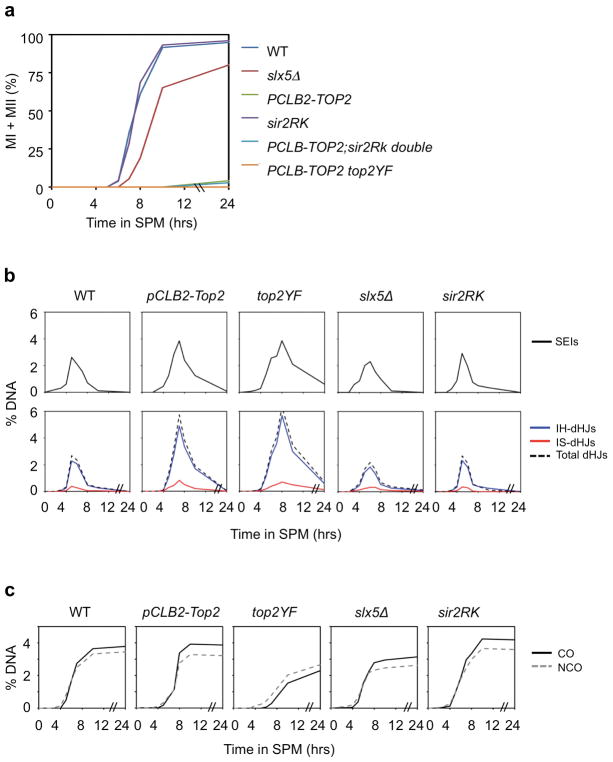
(i) CO-designation precedes SC formation and thus the pachytene stage14. Time course analysis of representative mutant strains reveals that, in sir2 mutants and in top2SNM, meiosis proceeds through pachytene and the two meiotic divisions normally (Extended data Fig. 8a; ref. 14; data not shown). slx5/8 mutants and PCLB2-TOP2 mutants show no delay in progressing through prophase to pachytene (not shown) but show a delay in meiosis I (slx5) or pachytene arrest (PCLB2-TOP2) (Extended data Fig. 8a; not shown). The pCLB2-TOP2 top2YF mutant does show a delay in achieving pachytene, as well as pachytene arrest, but exhibits the same CO patterning phenotype as all other mutants, which show no pre-pachytene delay. Thus, prolonged CO-designation is not the basis for these phenotypes.
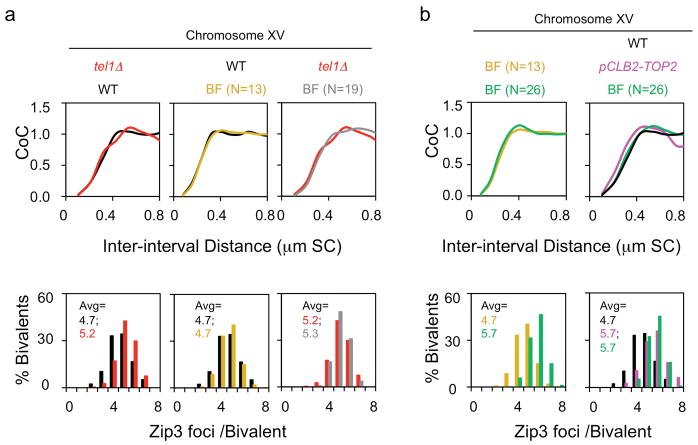
(ii) An increase in DSBs, without any change in CO interference, does increase the number of COs; but has very little effect on CO interference relationships (CoC curves) in budding yeast8. Correspondingly, two lines of evidence show that the mutant defects described here cannot be attributed to an increase in DSBs. a, A tel1Δ mutant exhibits increased DSBs but no change in CoC relationships. TEL1 encodes the yeast homolog of ATM. Absence of Tel1 confers a 50% increase in DSBs62 and a 10% increase in number of Zip3 foci (in ref. 8 Figure S7; reproduced in Extended Data Fig. 7a left, red color). However: (i) there is no change in CoC relationships relative to WT (Extended Data Fig. 7a left); (ii) the increase in COs is precisely that predicted on the basis of CO homeostasis (ref. 8; text Fig. 2d, filled black circle at 19 DSBs/precursors per Chr XV); and BF simulation accurately describes the tel1Δ phenotype, relative to WT, by a change in a single parameter: the level of DSBs (N=19, grey, vs 13, gold, in WT). The latter point is documented in Extended Data Fig. 7a middle and right. The middle panel shows the BF best-fit simulation for WT Chromosome XV, where N=13 (gold), compared to the experimental CoC curve (black; from text Fig. 1); the right panel shows the BF best-fit simulation for tel1Δ Chromosome XV, where N = 19 (grey) and all other parameters are the same as for WT, compared to the experimental CoC curve (red) from the left panel. b, BF simulations predict no/little change in CoC with increasing DSBs for yeast Chromosome XV (not shown). More specifically: in order to explain the increased number of COs observed in the analyzed mutants, e.g. pCLB2-TOP2, the value of N required for BF simulations of Chromosome XV would be 26 (double the WT value of N=13). If BF simulations are carried out under the same parameter values used for WT except that N=26 instead of N=13, the predicted CoC curve is unchanged as compared to that predicted for WT (left panel, compare gold for N=13 vs green for N=26). Correspondingly, the CoC curve predicted for N=26 (green) matches the WT CoC curve (black) and is unlike the CoC curve for the mutant (pink) (right panel).
Additional evidence that DSB number is not altered in pCLB2-TOP2 versus TOP2 is presented in Extended Data Fig. 4 and 8.
Extended Figure 8. Progression of meiosis and of recombination in interference-defective mutants.
Representative mutants were examined for progression of meiotic divisions and for recombination at the previously-characterized HIS4LEU2 locus (ref. 67; strains in Extended Data Table 1). a, Meiotic divisions. The first meiotic division occurs normally in sir2RK (defective in interaction with Slx5); is delayed in slx5Δ and is completely absent in PCLB2-TOP2 and PCLB-TOP2 top2YF due to arrest at pachytene (ref. 23; L.Z. unpublished). b, c, DNA events. The HIS4LEU2 locus likely provides a direct readout of DNA events independent of the effects of interference. HIS4LEU2 does not exhibit CO homeostasis24, which implies that is not sensitive to CO interference8. This feature presumably reflects the fact that this locus is a very strong DSB hot spot. A DSB occurs at this site in virtually every nucleus with a concomitant reduction in DSBs (and thus CO precursors) at other positions in its vicinity (unpublished results). This locus may also undergo early CO-designation, thus also dominating CO interference patterns per se. Importantly: Zip3 foci are used for diagnosis of CO interference relationships (text; ref. 8). Zip3 foci form as a specific consequence of programmed CO-designation; they do not mark the sites of non-interfering COs, which exhibit an entirely different pattern along the chromosomes8. Furthermore, formation of Zip3 foci is upstream of, and thus insensitive to, defects in later events, including: (i) major perturbations in the kinetics of recombination or the fidelity with which initiated events (CO-fated and/or NCO-fated) proceed to their assigned fates (e.g. ref. 14) or (ii) the potential occurrence of additional DSBs due to delayed SC formation (discussion in refs. 8 and 56). Thus, none of the recombination aberrancies detected by physical analysis of recombination in the analyzed mutants (below) is relevant to their CO interference phenotypes. Correspondingly, while all mutants give exactly the same CO patterns (interference and CO number) as defined by Zip3 foci, the mutants vary widely with respect to DNA recombination phenotypes. The below results can be summarized to say that (i) Absence of Slx5/8-Sir2 STUbL activity has little, or only subtle, effect(s) on recombination whereas (ii) absence of TopoII or TopoII catalytic activity confers delays and aberrancies. b, DSBs, SEIs and dHJs. Progression through recombination is very similar to WT in sir2RK and slx5Δ. Both PCLB2-TOP2 and PCLB-TOP2 top2YF exhibit a phenotype corresponding to delayed progression beyond the point of CO-designation: DSBs appear on time; however, DSBs, SEIs and dHJs all accumulate to higher than normal levels at later than normal times, implying delayed progression of CO-designated DSBs to single-end invasions (SEIs) and of SEIs to double Holliday junctions (dHJs), where SEIs and dHJs are both CO-specific intermediates14. There is no significant alteration in homolog-versus-sister bias in any of the four mutants, with inter-homolog dHJs predominating over inter-sister dHJs similarly to WT in all cases. c, Inter-homolog crossover (CO) and noncrossover (NCO) products. Inter-homolog CO and NCO levels are very similar to WT in PCLB2-TOP2 and show variations relative to WT in the other mutants. A differential deficit of COs versus NCOs in PCLB2-TOP2 top2YF suggests a specific defect in CO maturation in this mutant.
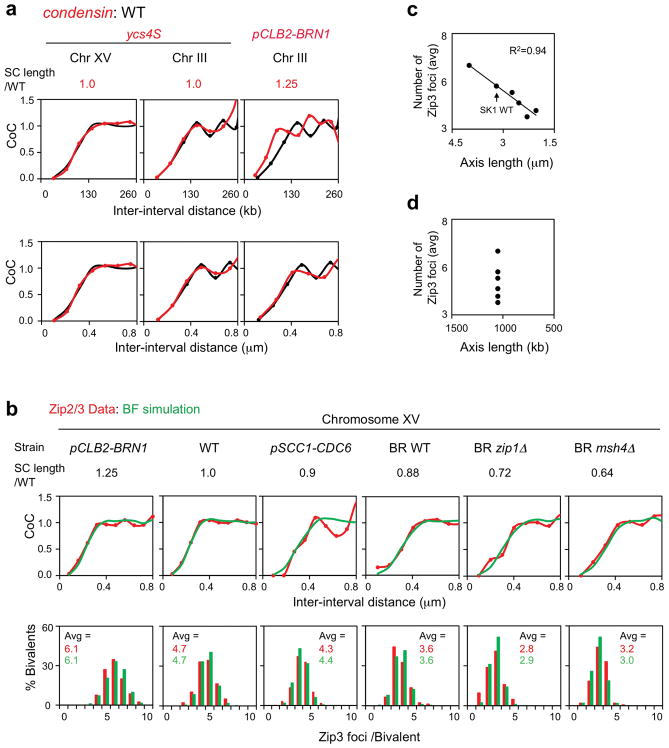
Extended Data Figure 9. The metric of CO interference is physical axis length (μm).
a, This study considered two different condensin mutants, ycs4S and pCLB2-BRN1. Axis length is normal in ycs4S and longer than normal in pCLB2-BRN1. Analysis presented for Chromosome XV in pCLB2-BRN1 (text Fig. 5) was also carried out on Chromosome III in that mutant background (right column), confirming that CoC relationships are WT when the metric is physical chromosome length but not when the metric is genomic distance. Such analysis was also carried out for Chromosomes III and XV in the ycs4S background (left and middle columns), confirming WT CoC relationships by both metrics. b, Zip3 focus analysis for chromosome XV in the indicated strains (red; from text Fig. 5) and BF simulation analysis (green). Best-fit simulations could be obtained for all strains using the same parameter values as for WT meiosis, including interference distance (LBF = ~0.3 μm), except that the number of precursors (N) had to be varied linearly with axis length. For the indicted strains, from left to right, (N) = 17, 13, 12, 10, 9 and 8. This result implies direct interplay between physical chromosome length (μm SC) and DSB probability, as will be discussed elsewhere. c, d, For the mutant cases described in panel b, experimentally-observed average numbers of Zip3 foci vary linearly with axis length (c). In contrast, different numbers of Zip3 foci are observed for the different strains despite the fact that Chromosome XV has the same genomic length in all cases (d). We also note that the best fit simulation for BR zip1Δ had to include a 10% decrease in the “efficiency of maturation of CO-designated interactions” which, in the present context, implies that in a zip1Δ background, there is a 10% reduction in either (a) the stability of a Zip3 focus under cytological spreading conditions at the absence of SC or (b) the probability that a CO-designation will give a Zip3 focus.
Extended Data Table 1. Strains used in this study.
All strains are isogenic derivatives of SK1 with ho::hisG, leu2 and ura3.
| Strains | Genotype |
|---|---|
| NKY4146 | HMR::LacO-URA3/”, URA3::CYC1p-Lacl-GFP/”, ZIP3-13myc::Hygromycin |
| NKY4147 | URA3::CYC1p-Lacl-GFP/”, scp1(Ch XV telomere)::LacO-LEU2/”, ZIP3-13myc::Hygromycin |
| NKY4148 | leu2::Lacl-GFP::Clonat/”, tel4::226xLacO::Kan/”, ZIP3-13myc::Hygromycin |
| LZY1842 | as NKY4146, except pCLB2-TOP2:KanMX/” |
| LZY1570 | as NKY4147, except pCLB2-TOP2:KanMX/” |
| LZY1845 | as NKY4148, except pCLB2-TOP2:KanMX/” |
| LZY2306 | as NKY4147, except top2-SNM::KanMX/” |
| LZY2190 | as NKY4147, except pCLB2-TOP2:KanMX/”, top2(Y782F):URA3 |
| LZY2237 | as NKY4147, except ubc9-GFP::KanMX/” |
| LZY2207 | as NKY4147, except red1::kanMX6/”, LEU2::pYI-red1KR |
| LZY2262 | as NKY4147, except pCLB2-TOP2:KanMX/”, tel1D::KanMX/” |
| LZY2194 | as NKY4147, except pCLB2-TOP2:KanMX/”, spo11-HA3His6::KanMX4/” |
| LZY2187 | as NKY4147, except pCLB2-TOP2:KanMX/”, spo11-HA3His6::KanMX4/spo11(D290A)-HA3His6::KAnMX4 |
| LZY2266 | as NKY4147, except pCLB2-TOP2:KanMX/”, spo11-HA3His6::KanMX4/spo11-(Y135F)-HA3His6::KanMX |
| LZY2054 | as NKY4147, except slx5D::natMX/” |
| LZY2418 | as NKY4148, except slx5D::natMX/” |
| LZY1983 | as NKY4147, except as slx8D::natMX/” |
| LZY2325 | as NKY4147, except slx5D::nat1::slx5-sim(1-4)::KanMX/” |
| LZY2319 | asNKY4147, except slx8-SS::natMX/” |
| LZY1572 | as NKY4147, except sir2D:KanMX/” |
| LZY1667 | as NKY4146, except sir2D:KanMX/” |
| LZY2166 | as NKY4148, except sir2D:KanMX/” |
| LZY2012 | as NKY4147, except sir2D::KanMX4::Sir2-R139K::natMX/” |
| LZY1756 | as NKY4147, except sir2-345:: natMX/” |
| LZY1702 | asNKY4147, except sir2-DC500::KanMX/sir2-DC500::natNT2 |
| LZY1516 | as NKY4147, except sir3D::LEU2/” |
| LZY1723 | as NKY4147, except sir4D::KanMX/sir4::natNT2 |
| LZY2146 | as NKY4147, except esc2D::KanMX/” |
| LZY1718 | as NKY4147, except esc8D::KanMX/” |
| LZY1451 | as NKY4147, except hst1D::KanMX/” |
| LZY1201 | as NKY4147, except ndj1D::KanMX/” |
| LZY1446 | as NKY4147, except hta1-S128A/”, hta2-S128A/” |
| LZY1986 | as NKY4147, except pCLB2-NSE2::KanMX/” |
| LZY932 | as NKY4147, except dot1D::KanMX/” |
| LZY2006 | as NKY4147, except smc6-9::NAT/” |
| LZY1163 | as NKY4147, except ndt80D::LEU2/”, REC8-3HA::URA3/+, pCLB2BRN1::KANMX4/” |
| LZY1325 | as NKY4146, except ndt80D::LEU2/”, REC8-3HA::URA3/+, pCLB2BRN1::KANMX4/” |
| LZY1261 | as NKY4147, except ndt80D::KanMX/”, REC8-3HA::URA3/+, ycs4S/” |
| LZY1364 | as NKY4146, except ndt80D::KanMX/”, REC8-3HA::URA3/+, ycs4S/” |
| LZY1471 | as NKY4146, except pch2D::KanMX/” |
| LZY1488 | as NKY4148, except pch2D::KanMX/” |
| LZY1472 | as NKY4147, except pch2D::KanMX/” |
| LZY773 | as NKY4147, except cdc6::kanMX6::PSCC1:3-HA-CDC6/”, ndt80::LEU2/” |
| LZY1317 | as NKY4147, except mlh1D::KanMX/” |
| LZY1386 | as NKY4147, except mlh3D::KanMX/” |
| LZY1318 | as NKY4147, except mms4D::KanMX/” |
| LZY1504 | as NKY4147, except msh2::LEU2/” |
| LZY2018 | as NKY4147, except sir2D::KanMX4::Sir2-R139K::nat/”, pCLB2-TOP2::KanMX/” |
| LZY2080 | as NKY4147, except sir2D::KanMX4::Sir2-R139K::nat/”, slx5D::natMX/” |
| LZY2313 | as NKY4147, except slx5D::natMX/”, red1::kanMX6/”, LEU2::pYI-red1KR, |
| LZY2430 | as NKY4147, except slx5D::natMX/”, top2-SNM::KanMX/” |
| LZY2341 | as NKY4147, except top2-SNM::KanMX, red1::KanMX, LEU2-red1KR |
| LZY446 | ho::hisG leu2 ura3 nuc1::hygroB HIS4::LEU2-(BamHI+ori), MAT alpha |
| LZY447 | ho::hisG leu2 ura3 nuc1::hygroB his4-x::LEU2-(NgoMIV+ori)--URA3, MAT a |
| LZY1614 | as LZY446, except pCLB2-TOP2::KanMX |
| LZY1617 | as LZY447, except pCLB2-TOP2::KanMX |
| LZY2413 | as LZY446, except pCLB2-TOP2::KanMX, URA3::top2(Y782F) |
| LZY2414 | as LZY447, except pCLB2-TOP2::KanMX, URA3::top2(Y782F) |
| LZY2261 | as LZY446, except slx5D::natMX |
| LZY2255 | as LZY447, except slx5D::natMX |
| LZY2198 | as LZY447, except sir2D::KanMX4::Sir2-R139K::nat |
| LZY2199 | as LZY447, except sir2D::KanMX4::Sir2-R139K::nat |
Supplementary Material
Acknowledgments
We thank M. Hochstrasser, J. Bachant, S. Jentsch, L. Pillus and M. Weinreich for plasmids, J. Fung for Zip2 focus data, members of the Kleckner laboratory and D. Zickler for advice and discussions. This research, L.Z., S.W., S.Y. and N.K. were supported by a grant to N.K. from the National Institutes of Health: RO1 GM044794; S.H. and K.P.K. were supported by the NRF of Korea funded by the Ministry of Science, ICT & Future Planning: 2012-M3A9C6050367.
Footnotes
Supplementary Information is linked to the online version of the paper at www.nature.com/nature.
Author contributions L.Z. and N.K. conceived and designed experiments, analyzed data and wrote the paper. L.Z., S.W., Y.S., S.H., and K.P.K. performed experiments.
Reprints and permissions information is available at www.nature.com/reprints.
The authors declare no competing financial interests.
Readers are welcome to comment on the online version of the paper.
References
- 1.Kleckner N, Zhang L, Weiner B, Zickler D. In: Meiotic chromosome dynamics in Genome Organization And Function In The Cell Nucleus. Rippe Karsten., editor. John Wiley and Sons; New York: 2011. pp. 487–533. [Google Scholar]
- 2.Zickler D, Kleckner N. The leptotene-zygotene transition of meiosis. Annu Rev Genet. 1998;32:619–697. doi: 10.1146/annurev.genet.32.1.619. [DOI] [PubMed] [Google Scholar]
- 3.Jones GH, Franklin FC. Meiotic crossing-over: obligation and interference. Cell. 2006;126:246–248. doi: 10.1016/j.cell.2006.07.010. [DOI] [PubMed] [Google Scholar]
- 4.Kleckner N, et al. A mechanical basis for chromosome function. Proc Natl Acad Sci US A. 2004;101:12592–12597. doi: 10.1073/pnas.0402724101. [DOI] [PMC free article] [PubMed] [Google Scholar]
- 5.Muller HJ. The mechanism of crossing over. Am Nat. 1916;50:193–434. [Google Scholar]
- 6.Sturtevant AH. The behavior of the chromosomes as studied through linkage. Z indukt Abstamm-u VererbLehre. 1915;13:234–287. [Google Scholar]
- 7.Hillers KJ, Villeneuve AM. Chromosome-wide control of meiotic crossing over in C. elegans. Curr Biol. 2003;13:1641–1647. doi: 10.1016/j.cub.2003.08.026. [DOI] [PubMed] [Google Scholar]
- 8.Zhang L, Liang Z, Hutchinson J, Kleckner N. Crossover patterning by the Beam-Film model: analysis and implications. PLoS Genet. 2014;10:e1004042. doi: 10.1371/journal.pgen.1004042. [DOI] [PMC free article] [PubMed] [Google Scholar]
- 9.King JS, Mortimer RK. A polymerization model of chiasma interference and corresponding computer simulation. Genetics. 1990;126:1127–1138. doi: 10.1093/genetics/126.4.1127. [DOI] [PMC free article] [PubMed] [Google Scholar]
- 10.Vecchiarelli AG, Hwang LC, Mizuuchi K. Cell-free study of F plasmid partition provides evidence for cargo transport by a diffusion-ratchet mechanism. Proc Natl Acad Sci USA. 2013;110:E1390–1397. doi: 10.1073/pnas.1302745110. [DOI] [PMC free article] [PubMed] [Google Scholar]
- 11.Blat Y, Protacio RU, Hunter N, Kleckner N. Physical and functional interactions among basic chromosome organizational features govern early steps of meiotic chiasma formation. Cell. 2002;111:791–802. doi: 10.1016/s0092-8674(02)01167-4. [DOI] [PubMed] [Google Scholar]
- 12.Pan J, et al. A hierarchical combination of factors shapes the genome-wide topography of yeast meiotic recombination initiation. Cell. 2011;144:719–731. doi: 10.1016/j.cell.2011.02.009. [DOI] [PMC free article] [PubMed] [Google Scholar]
- 13.Storlazzi A, et al. Recombination proteins mediate meiotic spatial chromosome organization and pairing. Cell. 2010;141:94–106. doi: 10.1016/j.cell.2010.02.041. [DOI] [PMC free article] [PubMed] [Google Scholar]
- 14.Borner GV, Kleckner N, Hunter N. Crossover/noncrossover differentiation, synaptonemal complex formation, and regulatory surveillance at the leptotene/zygotene transition of meiosis. Cell. 2004;117:29–45. doi: 10.1016/s0092-8674(04)00292-2. [DOI] [PubMed] [Google Scholar]
- 15.Hunter N. Meiotic Recombination. In: Aguilera A, Rothstein R, editors. Molecular Genetics of Recombination, Topics in Current Genetics. Springer-Verlag; Heidelberg: 2006. pp. 381–442. [Google Scholar]
- 16.Henderson KA, Keeney S. Synaptonemal complex formation: where does it start? Bioessays. 2005;27:995–998. doi: 10.1002/bies.20310. [DOI] [PubMed] [Google Scholar]
- 17.Bishop DK, Zickler D. Early decision; meiotic crossover interference prior to stable strand exchange and synapsis. Cell. 2004;117:9–15. doi: 10.1016/s0092-8674(04)00297-1. [DOI] [PubMed] [Google Scholar]
- 18.Fung JC, Rockmill B, Odell M, Roeder GS. Imposition of crossover interference through the nonrandom distribution of synapsis initiation complexes. Cell. 2004;116:795–802. doi: 10.1016/s0092-8674(04)00249-1. [DOI] [PubMed] [Google Scholar]
- 19.Agarwal S, Roeder GS. Zip3 provides a link between recombination enzymes and synaptonemal complex proteins. Cell. 2000;102:245–255. doi: 10.1016/s0092-8674(00)00029-5. [DOI] [PubMed] [Google Scholar]
- 20.Cheng CH, et al. SUMO modifications control assembly of synaptonemal complex and polycomplex in meiosis of Saccharomyces cerevisiae. Genes Dev. 2006;20:2067–2081. doi: 10.1101/gad.1430406. [DOI] [PMC free article] [PubMed] [Google Scholar]
- 21.Malkova A, et al. Gene conversion and crossing over along the 405-kb left arm of Saccharomyces cerevisiae chromosome VII. Genetics. 2004;168:49–63. doi: 10.1534/genetics.104.027961. [DOI] [PMC free article] [PubMed] [Google Scholar]
- 22.Bachant J, Alcasabas A, Blat Y, Kleckner N, Elledge SJ. The SUMO-1 isopeptidase Smt4 is linked to centromeric cohesion through SUMO-1 modification of DNA topoisomerase II. Mol Cell. 2002;9:1169–1182. doi: 10.1016/s1097-2765(02)00543-9. [DOI] [PubMed] [Google Scholar]
- 23.Rose D, Holm C. Meiosis-specific arrest revealed in DNA topoisomerase II mutants. Mol Cellular Biol. 1993;13:3445–3455. doi: 10.1128/mcb.13.6.3445. [DOI] [PMC free article] [PubMed] [Google Scholar]
- 24.Martini E, Diaz RL, Hunter N, Keeney S. Crossover homeostasis in yeast meiosis. Cell. 2006;126:285–295. doi: 10.1016/j.cell.2006.05.044. [DOI] [PMC free article] [PubMed] [Google Scholar]
- 25.Baldwin M, Bachant J. Top2 SUMO conjugation in yeast cell lysates. Methods Mol Biol. 2009;582:209–219. doi: 10.1007/978-1-60761-340-4_16. [DOI] [PubMed] [Google Scholar]
- 26.Eichinger CS, Jentsch S. Synaptonemal complex formation and meiotic checkpoint signaling are linked to the lateral element protein Red1. Proc Natl Acad Sci U S A. 2010;107:11370–11375. doi: 10.1073/pnas.1004248107. [DOI] [PMC free article] [PubMed] [Google Scholar]
- 27.Hooker GW, Roeder GS. A Role for SUMO in meiotic chromosome synapsis. Curr Biol. 2006;16:1238–1243. doi: 10.1016/j.cub.2006.04.045. [DOI] [PubMed] [Google Scholar]
- 28.Nagai S, Davoodi N, Gasser SM. Nuclear organization in genome stability: SUMO connections. Cell Res. 2011;21:474–485. doi: 10.1038/cr.2011.31. [DOI] [PMC free article] [PubMed] [Google Scholar]
- 29.Darst RP, Garcia SN, Koch MR, Pillus L. Slx5 promotes transcriptional silencing and is required for robust growth in the absence of Sir2. Mol Cell Biol. 2008;28:1361–1372. doi: 10.1128/MCB.01291-07. [DOI] [PMC free article] [PubMed] [Google Scholar]
- 30.Drouaud J, et al. Sex-specific crossover distributions and variations in interference level along Arabidopsis thaliana chromosome 4. PLoS Genet. 2007;3:e106. doi: 10.1371/journal.pgen.0030106. [DOI] [PMC free article] [PubMed] [Google Scholar]
- 31.Petkov PM, Broman KW, Szatkiewicz JP, Paigen K. Crossover interference underlies sex differences in recombination rates. Trends Genet. 2007;23:539–542. doi: 10.1016/j.tig.2007.08.015. [DOI] [PubMed] [Google Scholar]
- 32.Hou Y, et al. Genome analyses of single human oocytes. Cell. 2013;155:1492–1506. doi: 10.1016/j.cell.2013.11.040. [DOI] [PubMed] [Google Scholar]
- 33.Kleckner N. Chiasma formation: chromatin/axis interplay and the role(s) of the synaptonemal complex. Chromosoma. 2006;115:175–194. doi: 10.1007/s00412-006-0055-7. [DOI] [PubMed] [Google Scholar]
- 34.Novak I, et al. Cohesin Smc1beta determines meiotic chromatin axis loop organization. J Cell Biol. 2008;180:83–90. doi: 10.1083/jcb.200706136. [DOI] [PMC free article] [PubMed] [Google Scholar]
- 35.Klein F, et al. Localization of RAP1 and topoisomerase II in nuclei and meiotic chromosomes of yeast. J Cell Biol. 1992;117:935–948. doi: 10.1083/jcb.117.5.935. [DOI] [PMC free article] [PubMed] [Google Scholar]
- 36.Moens PB, Earnshaw WC. Anti-topoisomerase II recognizes meiotic chromosome cores. Chromosoma. 1989;98:317–22. doi: 10.1007/BF00292383. [DOI] [PubMed] [Google Scholar]
- 37.Kleckner N, Zickler D, Witz G. Chromosome capture brings it all together. Science. 2013;342:940–941. doi: 10.1126/science.1247514. [DOI] [PMC free article] [PubMed] [Google Scholar]
- 38.Agostinho M, et al. Conjugation of human Topoisomerase 2α with small ubiquitin-like modifiers 2/3 in response to Topoisomerase inhibitors: cell cycle stage and chromosome domain specificity. Cancer Research. 2008;68:2409–2418. doi: 10.1158/0008-5472.CAN-07-2092. [DOI] [PubMed] [Google Scholar]
- 39.Lee MT, Bachant J. SUMO modification of DNA topoisomerase II: trying to get a CENse of it all. DNA Repair. 2009;8:557–568. doi: 10.1016/j.dnarep.2009.01.004. [DOI] [PMC free article] [PubMed] [Google Scholar]
- 40.Kawamura R, et al. Mitotic chromosomes are constrained by topoisomerase II-sensitive DNA entanglements. J Cell Biol. 2010;188:653–663. doi: 10.1083/jcb.200910085. [DOI] [PMC free article] [PubMed] [Google Scholar]
- 41.Pope LH, Xiong C, Marko JF. Proteolysis of mitotic chromosomes induces gradual and anisotropic decondensation correlated with a reduction of elastic modulus and structural sensitivity to rarely cutting restriction enzymes. Mol Biol Cell. 2006;17:104–113. doi: 10.1091/mbc.E05-04-0321. [DOI] [PMC free article] [PubMed] [Google Scholar]
- 42.Libuda DE, Uzawa S, Meyer BJ, Villeneuve AM. Meiotic chromosome structures constrain and respond to designation of crossover sites. Nature. 2013;502:703–706. doi: 10.1038/nature12577. [DOI] [PMC free article] [PubMed] [Google Scholar]
- 43.Warsi TH. PhD Thesis. University of California; Riverside: 2009. Centromeric functions and dynamics of DNA Topoisomerase II in S. cerevisiae; pp. 130–187. [Google Scholar]
- 44.Chen SY, et al. Global analysis of the meiotic crossover landscape. Dev Cell. 2008;15:401–415. doi: 10.1016/j.devcel.2008.07.006. [DOI] [PMC free article] [PubMed] [Google Scholar]
- 45.Mancera E, Bourgon R, Brozzi A, Huber W, Steinmetz LM. High-resolution mapping of meiotic crossovers and non-crossovers in yeast. Cell. 2008;454:479–485. doi: 10.1038/nature07135. [DOI] [PMC free article] [PubMed] [Google Scholar]
- 46.Cherry JM, et al. Genetic and physical maps of Saccharomyces cerevisiae. Nature. 1997;387:67–73. [PMC free article] [PubMed] [Google Scholar]
- 47.Argueso JL, Wanat J, Gemici Z, Alani E. Competing crossover pathways act during meiosis in Saccharomyces cerevisiae. Genetics. 2004;168:1805–1816. doi: 10.1534/genetics.104.032912. [DOI] [PMC free article] [PubMed] [Google Scholar]
- 48.de los Santos T, et al. The Mus81/Mms4 endonuclease acts independently of double-Holliday junction resolution to promote a distinct subset of crossovers during meiosis in budding yeast. Genetics. 2003;164:81–94. doi: 10.1093/genetics/164.1.81. [DOI] [PMC free article] [PubMed] [Google Scholar]
- 49.Hollingsworth NM, Ponte L, Halsey C. MSH5, a novel MutS homolog, facilitates meiotic reciprocal recombination between homologs in Saccharomyces cerevisiae but not mismatch repair. Genes Dev. 1995;9:1728–1739. doi: 10.1101/gad.9.14.1728. [DOI] [PubMed] [Google Scholar]
- 50.Chua PR, Roeder GS. Zip2, a meiosis-specific protein required for the initiation of chromosome synapsis. Cell. 1998;93:349–359. doi: 10.1016/s0092-8674(00)81164-2. [DOI] [PubMed] [Google Scholar]
- 51.Shinohara M, Oh SD, Hunter N, Shinohara A. Crossover assurance and crossover interference are distinctly regulated by the ZMM proteins during yeast meiosis. Nat genet. 2008;40:299–309. doi: 10.1038/ng.83. [DOI] [PubMed] [Google Scholar]
- 52.Jessop L, Rockmill B, Roeder GS, Lichten M. Meiotic chromosome synapsis-promoting proteins antagonize the anti-crossover activity of sgs1. PLoS Genet. 2:e155. doi: 10.1371/journal.pgen.0020155. [DOI] [PMC free article] [PubMed] [Google Scholar]
- 53.Henderson KA, Keeney S. Tying synaptonemal complex initiation to the formation and programmed repair of DNA double-strand breaks. Proc Natl Acad Sci USA. 2004;101:4519–4524. doi: 10.1073/pnas.0400843101. [DOI] [PMC free article] [PubMed] [Google Scholar]
- 54.Sym M, Roeder GS. Crossover interference is abolished in the absence of a synaptonemal complex protein. Cell. 1994;79:283–292. doi: 10.1016/0092-8674(94)90197-x. [DOI] [PubMed] [Google Scholar]
- 55.Nishant KT, et al. The baker’s yeast diploid genome is remarkably stable in vegetative growth and meiosis. PLoS Genet. 2010;6:e1001109. doi: 10.1371/journal.pgen.1001109. [DOI] [PMC free article] [PubMed] [Google Scholar]
- 56.Kauppi L, et al. Numerical constraints and feedback control of double-strand breaks in mouse meiosis. Genes Dev. 2013;27:873–886. doi: 10.1101/gad.213652.113. [DOI] [PMC free article] [PubMed] [Google Scholar]
- 57.Serrentino ME, Chaplais E, Sommermeyer V, Borde V. Differential association of the conserved SUMO ligase Zip3 with meiotic double-strand break sites reveals regional variations in the outcome of meiotic recombination. PLoS Genet. 2013;9:e1003416. doi: 10.1371/journal.pgen.1003416. [DOI] [PMC free article] [PubMed] [Google Scholar]
- 58.Kim KP, et al. Sister cohesion and structural axis components mediate homolog bias of meiotic recombination. Cell. 2010;143:924–937. doi: 10.1016/j.cell.2010.11.015. [DOI] [PMC free article] [PubMed] [Google Scholar]
- 59.Koszul R, Kleckner N. Dynamic chromosome movements during meiosis: a way to eliminate unwanted connections? Trends Cell Biol. 2009;19:716–724. doi: 10.1016/j.tcb.2009.09.007. [DOI] [PMC free article] [PubMed] [Google Scholar]
- 60.Loidl J, Klein F, Engebrecht J. Genetic and morphological approaches for the analysis of meiotic chromosomes in yeast. Methods Cell Biol. 1998;53:257–285. doi: 10.1016/s0091-679x(08)60882-1. [DOI] [PubMed] [Google Scholar]
- 61.Charles DR. The spatial distribution of cross-overs in X-chromosome tetrads of Drosophila melanogaster. J Genetics. 1938;36:103–126. [Google Scholar]
- 62.Zhang L, Kim KP, Kleckner NE, Storlazzi A. Meiotic double-strand breaks occur once per pair of (sister) chromatids and, via Mec1/ATR and Tel1/ATM, once per quartet of chromatids. Proc Natl Acad Sci U S A. 2011;108:20036–20041. doi: 10.1073/pnas.1117937108. [DOI] [PMC free article] [PubMed] [Google Scholar]
- 63.Imai S, Armstrong CM, Kaeberlein M, Guarente L. Transcriptional silencing and longevity protein Sir2 is an NAD-dependent histone deacetylase. Nature. 2000;403:795–800. doi: 10.1038/35001622. [DOI] [PubMed] [Google Scholar]
- 64.Wu CS, Chen YF, Gartenberg MR. Targeted sister chromatid cohesion by Sir2. PLoS Genet. 2011;7:e1002000. doi: 10.1371/journal.pgen.1002000. [DOI] [PMC free article] [PubMed] [Google Scholar]
- 65.Dhillon N, Kamakaka RT. A histone variant, Htz1p, and a Sir1p-like protein, Esc2p, mediate silencing at HMR. Mol Cell. 2000;6:769–80. doi: 10.1016/s1097-2765(00)00076-9. [DOI] [PubMed] [Google Scholar]
- 66.Derbyshire MK, Weinstock KG, Strathern JN. HST1, a new member of the SIR2 family of genes. Yeast. 1996;12:631–640. doi: 10.1002/(SICI)1097-0061(19960615)12:7%3C631::AID-YEA960%3E3.0.CO;2-8. [DOI] [PubMed] [Google Scholar]
- 67.Hong S, et al. The logic and mechanism of homologous recombination partner choice. Mol Cell. 2013;51:440–453. doi: 10.1016/j.molcel.2013.08.008. [DOI] [PMC free article] [PubMed] [Google Scholar]
Associated Data
This section collects any data citations, data availability statements, or supplementary materials included in this article.


