Abstract
This paper presents an endoscopic configuration for measurements of tissue autofluorescence using two–photon excitation and time–correlated single photon counting detection through a double–clad photonic crystal fiber (DC–PCF) without pre-chirping of laser pulses. The instrument performance was evaluated by measurements of fluorescent standard dyes, biological fluorophores (collagen and elastin), and tissue specimens (muscle, cartilage, tendon). Current results demonstrate the ability of this system to accurately retrieve the fluorescence decay profile and lifetime of these samples. This simple setup, which offers larger penetration depth than one-photon-based techniques, may be combined with morphology-yielding techniques such as photoacoustic and ultrasound imaging.
Keywords: fluorescence lifetime, autofluorescence, double-clad photonic crystal fiber, endoscopy
Fluorescence lifetime measurements of endogenous fluorescence have great potential for in vivo optical characterization of tissues and diagnosis of diseases such as cancer or atherosclerosis [1, 2]. Recent studies demonstrate the potential of fluorescence lifetime contrast for in vivo optical biopsy with applications to image-guided surgery of brain tumors and diagnosis of oral carcinoma [3, 4]. However, the penetration depth of the instruments using one-photon excitation is limited to a shallow layer of up to 250 µm as it requires typically UV light for an efficient excitation of endogenous fluorophores. To address this problem, multi-photon techniques have been developed with significant advantages in terms of penetration depth, reduced phototoxicity and photobleaching, as well as intrinsic sectioning ability [5, 6]. In addition, optical fibers can be used in endoscopic setups to enable remote access of sites of interest. Several fiber-based imaging modalities have been demonstrated [7, 8], including linear and nonlinear excitation [8–10]. Nevertheless nonlinear effects and group velocity dispersion in fibers can make their implementation difficult. The broad spectral width of ultra short laser pulses results in a temporal pulse elongation due to dispersion. To compensate for linear dispersion effects pulses can be pre-chirped by a combination of two prisms or gratings [11]. It has also been shown that hollow core photonic crystal fibers can compensate for pulse broadening and self-phase-modulation of the excitation light in the fiber [8]. More recently, a novel dual-clad photonic crystal fiber has shown great promise in applications to nonlinear excitation of the fluorophores [12]. Its large single-mode diameter reduces undesired nonlinear contributions such as self-phase modulation. This fiber allows, in combination with GRadient INdex (GRIN) lenses, for tight focusing of the excitation light through the single-mode inner core and efficient light collection through the multimode, high numerical aperture (NA) outer core of the fiber [10, 12, 13]. In this way, a single fiber can be used for both laser excitation and signal collection. This paper presents and characterizes for the first time a novel application of this fiber to measure the fluorescence lifetime excited by a two-photon absorption process. It is demonstrated that reliable lifetime values can be extracted in a simple configuration without pre-chirping of the ultra-short laser pulses. At first, the experimental setup is described, and then measurements of various fluorophores lifetime standards, samples of biological fluorophores, and ex vivo tissue specimens are presented. In addition, the accurate reconstruction of fluorescence lifetime by applying a numerical Laguerre deconvolution for data analysis (which is valuable for situations in which the composition of the tissue is not known) is demonstrated.
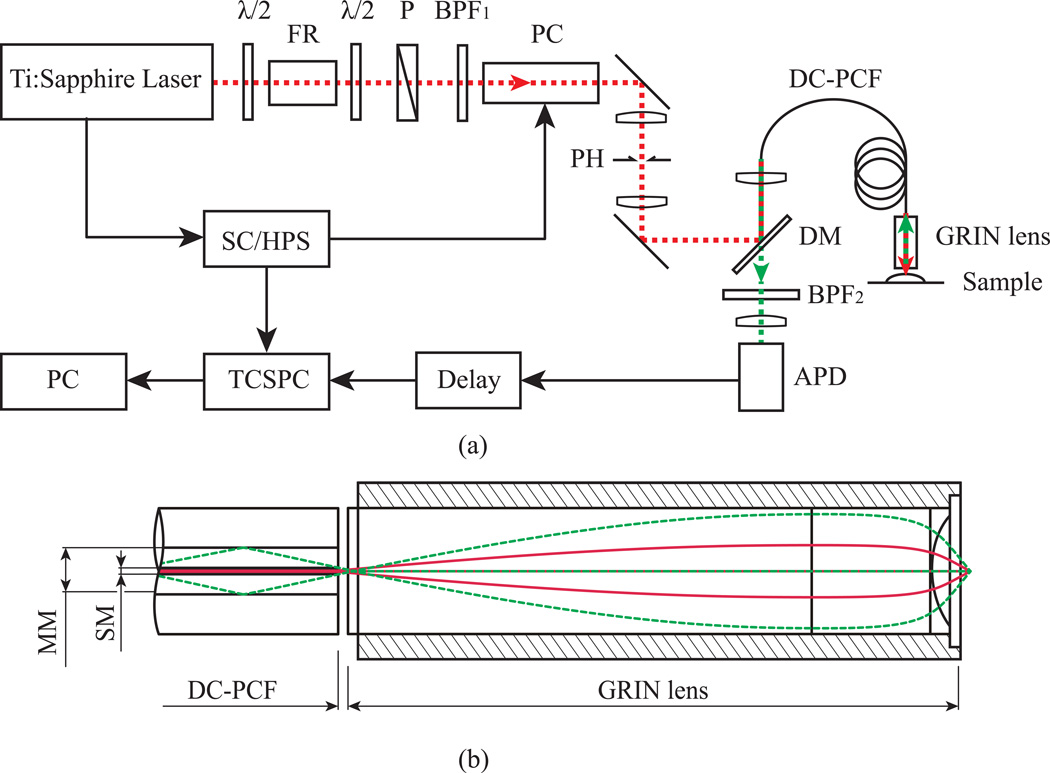
The experimental setup (Fig. 1) for endoscopic two-photon excited fluorescence measurements consisted of a wavelength tunable Ti:Sapphire laser excitation source (Chamelon, Coherent, 690–1040 nm tuning range, average power of up to 2.5 W, ~140 fs pulse duration, 80 MHz repetition rate); a Faraday isolator to prevent back-reflected light from various reflective surfaces to couple back into the laser cavity; a 713 ± 8 nm bandpass filter (BPF1); and a Pockels cell (Model 25D Pulse Picker and Model 305–16 Synchronous Countdown, Conoptics Inc., Danbury, CT) placed into the beam path to reduce the pulse repetition rate tenfold. The resulting 8 MHz pulse train ensures that the number of detectable photons per laser pulse on the single photon counting avalanche photodiode (APD, SPCM-AQR 14, Perkin- Elmer, Waltham, MA) is kept low to avoid artefacts in the recorded lifetime histogram distribution. The lower repetition rate corresponds to an inter-pulse time of 0.1 µs, which enhances the effective photon harvest from the sample due to longer recovery time for the detector. In this way, the peak power can be increased to more effectively generate the fluorescence signal. Furthermore, the lower repetition rates have been shown to prevent photobleaching and allow for more effective fluorescence measurements [14]. The excitation beam profile was spatially filtered with a combination of two achromatic lenses (75 mm focal length) and a pinhole (d = 50 µm) to improve the quality of the excitation beam profile. A dichroic mirror (650dcspxr, Chroma Technology Corp., VT, 400–625 nm transmission window) steered the beam onto a one meter long DC-PCF (DC165 16, Crystal Fibre, Denmark) that was used to guide the light to the sample in an endoscopic arrangement. This fiber comprises of a single-mode inner fiber core with a diameter of 16 ± 2 µm that has a fairly small numerical aperture (NA) of ~ 0.04, whereby the surrounding multimode outer core fiber region of the PCF has a high NA of ~ 0.65 and a diameter of d = 163 ± 5 µm. A 25 mm focal length lens focuses the laser beam into the single mode core of the PCF mounted on a three-axis differential micrometer positioning stage (MBT616, Thorlabs, NJ), allowing a coupling efficiency of about 50%. The laser light emerging from the PCF fiber was focused onto the specimen by a GRIN lens (GRIN, GT M0-080-018-810, GRINTECH GmbH, Germany). This high NA GRIN lens was chosen to minimize the beam waist of the excitation beam at the sample plane. Following Gaussian beam theory for 714 nm radiation and applying the effective NA for the GRIN lens, the beam waist at focal region was calculated to be about 5 µm. The lens was placed with the low NA of ~ 0.18 facing the fiber end face and while the high NA side focused the excitation light onto the sample. The emerging fluorescence signal was collected by exploiting the full NA of about 0.8 of the GRIN lens [see Fig. 1(b)]. Assuming chromatic aberrations in the GRIN lens to be present, it is expected that fluorescence light was mainly guided through the multimode region of the DC-PCF [15]. Residual excitation light and potential second harmonic signal generated by highly regular structures within the sample was attenuated with a 512 ± 100 nm bandpass filter (BPF2, E625SP, Chroma Technology Corp., VT).
Figure 1.
The detection consisted of a time-correlated single photon counting electronic board (TCSPC, TimeHarp200, PicoQuant GmbH, Berlin, Germany) operating in reversed start-stop mode. In this configuration, the lifetime detection is started when a photon is detected with the APD and stopped when the next electronic pulse comes from the synchronous countdown device. An electronic delay allows position adjustment of the rising edge of the fluorescence decay curve along the abscissa. All arrival times are stored on a personal computer (PC) and computed in a histogram that allows for the evaluation of fluorescence lifetimes. Since a photon arrival histogram needs to be generated, acquisition times on the order of 1 s were required.
Fluorescence lifetimes were computed by numerical deconvolution using a Laguerre expansion algorithm. This methods proved useful in the characterization of fluorescence decay obtained from biological tissues where the number of fluorescent components are not a priori known [16]. Due to the counting nature of photon detection, it is assumed that photon counts y(ti), at all arrival times ti are independent and follow Poisson distribution with expected counts y(ti), i.e., y(ti) ~ Poisson(y(ti)) for i = 1,…, N. The expected photon count y(ti) is considered as a convolution of discrete time fluorescence impulse response function (FIRF) h(ti) and instrument response function (IRF) If(ti), i.e. . The FIRF h(ti) was expanded onto a set of orthonormal Laguerre (LG) basis: where bl are the discrete time LGs for l = 1,…, L and α is a scale parameter. Thus, the FIRF is parameterized by the set of LG expansion coefficients, c = [c1, c2,…, cL]T. A Levenberg-Marquart type optimization algorithm was used to find the maximum likelihood estimator ĉMLE for fixed L and fixed α. In the current study, we found five LG functions are sufficient to represent the FIRF. In addition, for each time response measurement, an optimization procedure was carried out over a range of α values. The set of LG basis functions with α value that has minimal deviance is considered optimal and the corresponding FIRF was calculated as, The averaged lifetime can then be computed as, . To verify the results obtained with the Laguerre method the data was also fitted with either single- or multi-exponentials (SymPhoTime, PicoQuant GmbH, Berlin, Germany), and the results are presented in Table 1.
Table 1.
Summary of two-photon excited fluorescence lifetimes
| Sample | A1 [%] |
τ1 [ns] |
A2 [%] |
τ2 [ns] |
Exponential τav [ns] |
Laguerre τav [ns] |
Literature τav [ns] |
Ref. | Power [mW] |
|---|---|---|---|---|---|---|---|---|---|
| Rh6G | 1.00 | – | – | – | 3.36 ± 0.23 | 3.35 ± 0.09 | 3.99 | [17] | 2.9 |
| RhB | 1.00 | – | – | – | 2.48 ± 0.11 | 2.34 ± 0.03 | 2.45 | [17] | 2.5 |
| C30 | 1.00 | – | – | – | 1.64 ± 0.05 | 1.57 ± 0.03 | 1.67 | [18] | 5.5 |
| Elastin | 0.75 | 1.97 ± 0.10 | 0.25 | 7.16 ± 0.25 | 4.81 ± 0.10 | 4.57 ± 0.15 | 2.3 | [19] | 5.3 |
| Collagen | 0.67 | 1.71 ± 0.28 | 0.33 | 7.27 ± 0.89 | 5.45 ± 0.71 | 5.00 ± 0.70 | 5.3 | [19] | 6.0 |
| MT | 0.79 | 0.96 ± 0.18 | 0.21 | 3.14 ± 0.46 | 1.93 ± 0.11 | 1.69 ± 0.02 | 0.4 – 5.0 | [20] | 4.0 |
| Tendon | 0.97 | 2.32 ± 0.26 | 0.29 | 8.39 ± 0.20 | 5.91 ± 0.24 | 5.32 ± 0.28 | 9.7 | ||
| Cartilage | 0.74 | 1.67 ± 0.31 | 0.26 | 6.83 ± 0.82 | 5.46 ± 0.44 | 5.68 ± 0.35 | 1.3 | ||
Abbreviations: Rhodamine 6G (Rh6G), Rhodamine B (RhB), Coumarin 30 (C30) and Muscle Tissue (MT).
To validate the experimental method, fluorescence emission pulses were recorded from three sample categories: 1) standard fluorescence dye solutions (0.1 mM solution) of Rhodamine 6G and Rhodamine B in ethanol, and Coumarin 30 in methanol placed in quartz cuvette; 2) endogenous tissue fluorophores (dry powder form) of collagen type 1 and elastin from Sigma Aldrich; 3) fresh tissues specimens of pig tendon, pig cartilage, and muscle tissue. All measurements were performed by placing the samples into the focal plane of the GRIN lens. The measurements were conducted at an excitation wavelength of 714 nm corresponding to a single-photon excitation at 357 nm, matching the absorption spectra of major endogenous fluorophores and fluorescence lifetime standard dyes.
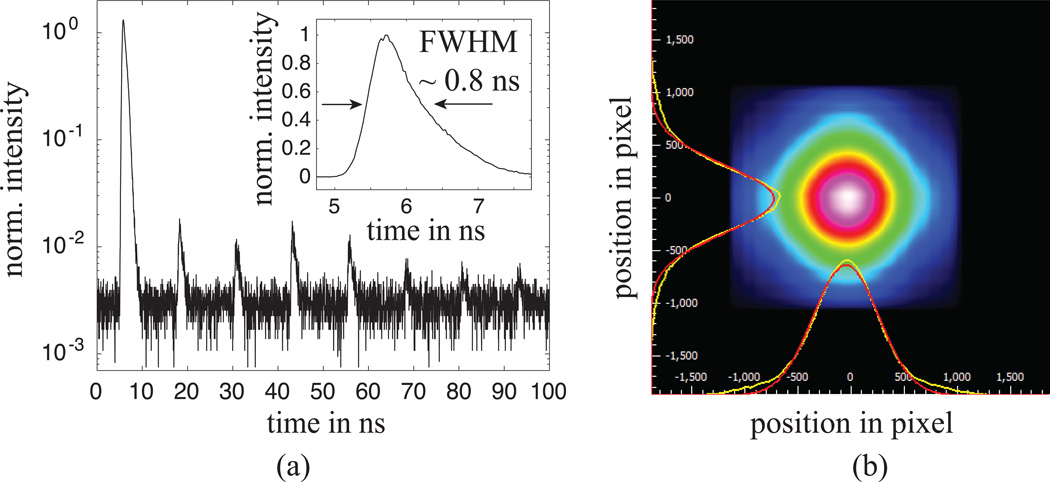
The temporal pulse width of the excitation light was measured at the distal end of the PCF using an autocorrelator (Levante, PulseCheck, APE GmbH, Germany). The pulse width changes from initial ~ 140 fs at the laser aperture to approximately 1 ps at the focal plain of the GRIN lens. Spectral analysis of the excitation beam after propagation through the fiber showed no additional components to the spectrum that could have been generated in the fiber (e.g. fluorescence or Raman peaks). Furthermore, meaningful measurements were realized without the need of a pre-chirping system. To obtain the instrument response function, the excitation light at 714 nm was back reflected through the PCF from the sample plane. For this step the power was reduced and the bandpass filter 2 [see Fig. 1(a)] was removed. The additional peaks in Fig. 2(a) are the attenuated pulses that leak through the Pockels cell (note logarithmic scale). A response function with a FWHM of approximately 0.8 ns was measured [see Fig. 2(a) inset], suggesting that the response time of the electronics (in particular the detector) is the limiting factor in this case.
Figure 2.
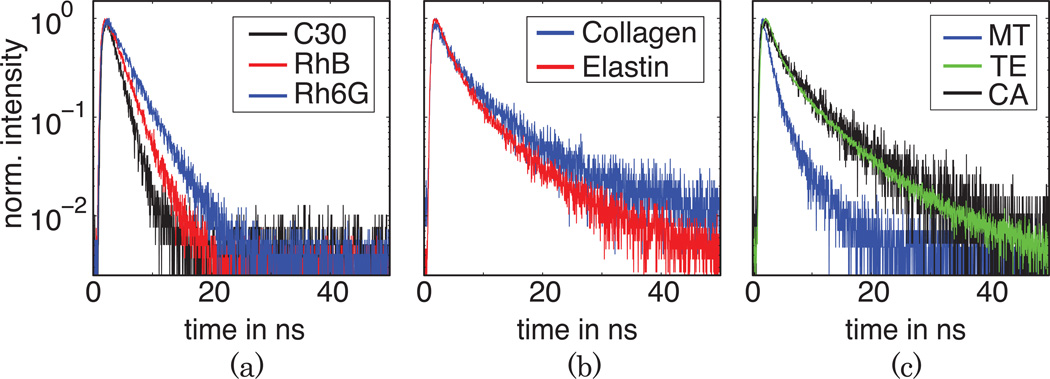
The measured fluorescence decay curves are presented in Fig. 3. The fluorescence decay parameters (time decay, amplitude contribution, and average lifetime) of the samples obtained based on both one- or multi-exponential fitting as well as Laguerre expansion are given in Table 1 and compared with values reported in literature. For RhB, Rh6G, and C30 the fluorescence decay was clearly mono-exponential and the lifetime values compare very well with data previously reported, with a slight variation for Rh6G, which can be explained by concentration variation of the dye in solution and/or different excitation wavelength [17]. The standard deviation for the fluorescence lifetime was calculated from six independent measurements.
Figure 3.
All other samples exhibit a non mono-exponential behaviour, with values dependent on the micro-environment such as pH, temperature, or water content. Figure 2(b) shows the fluorescence decay curves of powder collagen and elastin. The extracted average lifetime for elastin is 4.8 ns, slightly longer than previously reported values of 2.3 ns. The collagen average lifetime of 5.5 ns is in agreement to previously reported values.
Additional measurements were performed ex vivo on fresh muscle tissue, cartilage, and tendon sample [see Fig. 3(c)]. The fluorescence decay again displays a multi-exponential behaviour, as expected for tissue containing multiple intrinsic fluorophores. Muscle tissue is a complex structure that consists, for example NADH (τ = 0.6 ns) and flavins (τ = 2.3–5 ns) [1], with its fluorescence lifetime being a convolution of all components. It is well known that the main fluorescence component in both tendon and cartilage tissues is collagen. Here we determined with Laguerre and bi-exponential models that these tissues exhibit a complex dynamics in agreement with collagen fluorescence dynamics (~5 ns).
In conclusion, this paper demonstrates for the first time the use of a double-clad photonic crystal fiber for the measurement of two-photon excited fluorescence lifetime of biological specimens. Coupled with a GRIN lens for excitation and Laguerre fluorescence lifetime analysis, this instrument may become useful for biomedical research involving tissue characterization at molecular level. For this proof-of-concept work, a scanning scheme was not implemented and rather a point spectroscopy was demonstrated. Reliable fluorescence lifetime detection with acquisition times as short as 1 second were presented and underline the potential of this setup for future in vivo studies. We believe that this technique can be combined with ultrasound and photoacoustic detection, which can provide additional morphological information.
Acknowledgments
This work has been supported by NIH-NCRR (5R21RR025818), NSF (IDBR-0852891) and NSF (Center for Biophotonics Science and Technology PHY0120999).
References
- 1.Berezin MY, Achilefu S. Chem Rev. 2010;110:2641–2684. doi: 10.1021/cr900343z. [DOI] [PMC free article] [PubMed] [Google Scholar]
- 2.Marcu L. J Biomed Opt. 2010;15:011106. doi: 10.1117/1.3327279. [DOI] [PMC free article] [PubMed] [Google Scholar]
- 3.Sun Y, Phipps J, Elson DS, Stoy H, Tinling S, Meier J, Poirier B, Chuang FS, Farwell DG, Marcu L. Opt Lett. 2009;34:2081–2083. doi: 10.1364/ol.34.002081. [DOI] [PMC free article] [PubMed] [Google Scholar]
- 4.Sun Y, Hatami N, Yee M, Phipps J, Elson DS, Gorin F, Schrot RJ, Marcu L. J Biomed Opt. 2010;15:056022. doi: 10.1117/1.3486612. [DOI] [PMC free article] [PubMed] [Google Scholar]
- 5.Helmchen F, Denk W. Nat Methods. 2005;2:932–940. doi: 10.1038/nmeth818. [DOI] [PubMed] [Google Scholar]
- 6.Konig K. J Biophotonics. 2008;1:13–23. doi: 10.1002/jbio.200710022. [DOI] [PubMed] [Google Scholar]
- 7.Flusberg BA, Cocker ED, Piyawattanametha W, Jung JC, Cheung ELM, Schnitzer MJ. Nat Methods. 2005;2:941–950. doi: 10.1038/nmeth820. [DOI] [PMC free article] [PubMed] [Google Scholar]
- 8.Engelbrecht CJ, Johnston RS, Seibel EJ, Helmchen F. Opt Express. 2008;16:5556–5564. doi: 10.1364/oe.16.005556. [DOI] [PubMed] [Google Scholar]
- 9.Kennedy GT, Manning HB, Elson DS, Neil MAA, Stamp GW, Viellerobe B, Lacombe F, Dunsby C, French PMW. J Biophotonics. 2010;3:103–107. doi: 10.1002/jbio.200910065. [DOI] [PubMed] [Google Scholar]
- 10.Fu L, Gu M. J Microsc. 2007;226:195–206. doi: 10.1111/j.1365-2818.2007.01777.x. [DOI] [PubMed] [Google Scholar]
- 11.Martinez OE. JOSA B. 1986;3:929–934. [Google Scholar]
- 12.Fu L, Jain A, Xie H, Cranfield C, Gu M. Opt Express. 2006;14:1027–1032. doi: 10.1364/oe.14.001027. [DOI] [PubMed] [Google Scholar]
- 13.Bao H, Ryu SY, Lee BH, Tao W, Gu M. Opt Lett. 2010;35:995–997. doi: 10.1364/OL.35.000995. [DOI] [PubMed] [Google Scholar]
- 14.Donnert G, Eggeling C, Hell SW. Nat Methods. 2007;4:81–86. doi: 10.1038/nmeth986. [DOI] [PubMed] [Google Scholar]
- 15.Ye J, Thomas T, Majoros I, Koltyar A, Baker J, Wadsworth W, Bouwmans G, Knight J, Russell P, Norris T. Proc. SPIE. 2005:23–27. [Google Scholar]
- 16.Jo JA, Fang Q, Papaioannou T, Baker JD, Dorafshar AH, Reil T, Qiao JH, Fishbein MC, Freischlag JA, Marcu L. J Biomed Opt. 2006;11:021004. doi: 10.1117/1.2186045. [DOI] [PMC free article] [PubMed] [Google Scholar]
- 17.Magde D, Rojas GE, Seybold PG. Photochem Photobiol. 1999;70:737–744. [Google Scholar]
- 18.Dutt G, Raman S. J Chem Phys. 2001;114:6702. [Google Scholar]
- 19.Maarek JMI, Marcu L, Snyder WJ, Grundfest WS. Photochem Photobiol. 2000;71:178–187. doi: 10.1562/0031-8655(2000)071<0178:trfsoa>2.0.co;2. [DOI] [PubMed] [Google Scholar]
- 20.Pfeifer L, Stein K, Fink U, Welker A, Wetzl B, Bastian P, Wolfbeis OS. J Fluoresc. 2005;15:423–432. doi: 10.1007/s10895-005-2634-z. [DOI] [PubMed] [Google Scholar]


