

Abstract
“Pre-leukemic” mutations are thought to promote clonal expansion of haematopoietic stem cells (HSCs) by increasing self-renewal and competitiveness1; however, mutations that increase HSC proliferation tend to reduce competitiveness and self-renewal potential, raising the question of how a mutant HSC can sustainably outcompete wild-type HSCs. Activating mutations in NRAS are prevalent in human myeloproliferative neoplasms and leukemia2. Here we show that a single allele of oncogenic NrasG12D increases HSC proliferation but also increases reconstituting and self-renewal potential upon serial transplantation in irradiated mice, all prior to leukemia initiation. NrasG12D also confers long-term self-renewal potential upon multipotent progenitors. To explore the mechanism by which NrasG12D promotes HSC proliferation and self-renewal we assessed cell cycle kinetics using H2B-GFP label retention and BrdU incorporation. NrasG12D had a bimodal effect on HSCs, increasing the rate at which some HSCs divide and reducing the rate at which others divide. This mirrored bimodal effects on reconstituting potential as rarely dividing NrasG12D HSCs outcompeted wild-type HSCs while frequently dividing NrasG12D HSCs did not. NrasG12D had these effects by promoting STAT5 signaling, inducing different transcriptional responses in different subsets of HSCs. One signal can therefore increase HSC proliferation, competitiveness, and self-renewal through bimodal effects on HSC gene expression, cycling, and reconstituting potential.
To gain a durable competitive advantage, mutant HSCs must sustainably self-renew more frequently than wild-type HSCs. Yet increased HSC division is almost always associated with reduced self-renewal potential and HSC depletion3–5. Many oncogenic mutations increase HSC proliferation but deplete HSCs, preventing clonal expansion6. Some oncogenic mutations do increase HSC self-renewal, including over-expression of Ezh27 or Csf3r truncation8, and deletion of p18INK4C 9, Tet210, Dnmt3a 11 or Lnk 12,13. However, it remains uncertain whether these mutations can account for pre-leukemic expansion.
Human leukemias commonly have mutations that increase Ras signaling, including NRAS or KRAS2 point mutations2. Mouse models with conditional expression of oncogenic KrasG12D develop a rapid onset, aggressive myeloproliferative neoplasm (MPN) 14,15. KrasG12D drives HSCs into cycle and reduces HSC frequency 14,15. NrasG12D knock-in mice, on the other hand, develop an indolent MPN with delayed onset and prolonged survival 16,17. NF1 inactivation18 or NrasG12D expression17,19 allow bone marrow cells to out-compete wild-type cells in transplantation assays but it remains unclear whether they promote sustained pre-leukemic expansion, or how that might occur.
To conditionally activate a single allele of NrasG12D in HSCs we generated Mx-1-Cre; NrasG12D/+ mice in which the oncogenic G12D mutation was knocked into the endogenous Nras locus along with a floxed stop cassette20. To induce NrasG12D expression, mice were administered poly-inosine:poly-cytosine (pIpC) at 6-10 weeks after birth (Extended data Figure 1). At 2 weeks and 3 months after pIpC treatment, more than twice as many NrasG12D/+ CD150+CD48−Lineage−Sca-1+c-kit+ (CD150+CD48−LSK) HSCs21 incorporated a 24-hour pulse of bromo-deoxyuridine (BrdU) as compared to control HSCs (p<0.01; Figure 1a). Consistent with this, twice as many NrasG12D/+ HSCs were in G1 phase of the cell cycle as compared to control HSCs (Extended data Figure 1b). This increase in HSC proliferation did not significantly affect the number of HSCs or multipotent progenitors (MPPs) two weeks after NrasG12D activation (Figure 1c). However, Mx-1-Cre; NrasG12D/+ mice had significantly more LSK cells in the bone marrow and spleen (Figure 1c). We also observed a two-fold increase in BrdU incorporation in HSCs as well as an expansion of LSK cells in Vav1-Cre; NrasG12D/+ mice as compared to controls (Figure 1b; Extended data Figure 2a). Thus NrasG12D increased HSC division and expanded the pool of primitive hematopoietic progenitors.
Figure 1. NrasG12D/+ increased HSC proliferation and competitiveness.

a) A 24-hour pulse of BrdU was administered to Mx1-cre; NrasG12D/+ (G12D/+) and littermate control (con) mice at 2 weeks and 3 months after pIpC treatment (n=3 mice/treatment). b) BrdU incorporation by CD150+CD48−LSK HSCs from Vav1-Cre; NrasG12D/+ mice (G12D/+) or littermate controls (con) at 6-10 weeks of age (n=3). c) The total number of CD150+CD48−LSK HSCs, CD150−CD48−LSK MPPs, and LSK cells in the bone marrow and spleens of Mx1-cre; NrasG12D/+ (G12D/+) and littermate control (con) mice at 2 weeks after pIpC treatment (n=5 mice/treatment). d) 5×10⁵ donor bone marrow cells from Mx1-cre; NrasG12D/+ (G12D/+) or littermate control (con) mice at 2 weeks after pIpC treatment (n=3 donors/genotype) were transplanted into irradiated recipient mice (n=15 recipients/genotype) along with 5×10⁵ recipient bone marrow cells. Donor cell reconstitution in the myeloid (Mac-1+ cells), B (B220+), and T (CD3+) cell lineages for 4 to 20 weeks after transplantation. e) Recipients of Mx1-cre; NrasG12D/+ (G12D/+) bone marrow cells (n=5) had significantly (p<0.05) higher proportions of donor-derived HSCs, MPPs and LSK cells compared to recipients of control bone marrow cells (con). f) 10 donor HSCs from Mx1-cre; NrasG12D/+ (G12D/+) or littermate control (con) mice at 2 weeks after pIpC treatment (n=3 donors/genotype) were transplanted into irradiated recipient mice (n=14 recipients/genotype) along with 3×10⁵ recipient bone marrow cells. Data represent mean±s.d.. Two-tailed student's t-tests were used to assess statistical significance. *P<0.05, **P<0.01, ***P<0.001.
To test competitiveness we transplanted 5×10⁵ whole bone marrow cells from Mx-1-Cre; NrasG12D/+ or control donors into irradiated wild-type recipients along with 5×10⁵ recipient bone marrow cells. The NrasG12D/+ cells gave significantly higher levels of reconstitution than control cells in all lineages for at least 20 weeks after transplantation (Figure 1d). In recipients of control donor cells, 69±13% of HSCs, 47±12% of MPPs, and 44±12% of LSK cells were donor-derived (Figure 1e); however, in recipients of NrasG12D/+ donor cells 93±8% of HSCs, 90±8% of MPPs, and 85±15% of LSK cells were donor-derived (Figure 1e). NrasG12D/+ HSCs therefore outcompeted wild-type HSCs.
To further test whether NrasG12D/+ HSCs could outcompete wild-type HSCs we transplanted 10 CD150+CD48−LSK donor HSCs from the bone marrow of Mx-1-Cre; NrasG12D/+ or littermate control mice (2 weeks after finishing pIpC) into irradiated wild-type recipients along with 3×10⁵ recipient bone marrow cells. The NrasG12D/+ HSCs gave significantly higher levels of reconstitution compared to control donor HSCs in all lineages for at least 20 weeks after transplantation (Figure 1f).
To assess self-renewal potential we serially transplanted 3×10⁶ whole bone marrow cells from three or four recipients per treatment into 2–5 irradiated mice per recipient (depending on the number of bone marrow cells we recovered) during each round of transplantation. In secondary, tertiary, and quaternary recipient mice we continued to observe significantly higher levels of reconstitution from the NrasG12D/+ donor cells than from control donor cells in all lineages (Figure 2a–c). In tertiary recipient mice the control cells gave only transient multilineage reconstitution as they appeared to exhaust their self-renewal potential. In contrast, the NrasG12D/+ HSCs gave high levels of long-term multilineage reconstitution in all 9 tertiary recipients, suggesting increased self-renewal potential. In quaternary recipient mice NrasG12D/+ donor cells continued to give long-term multilineage reconstitution in most recipients while control donor cells gave only low levels of transient lymphoid reconstitution (Figure 2c). NrasG12D thus increased the self-renewal potential of HSCs in addition to increasing their rate of division (Figure 1a) and their ability to compete with wild-type HSCs (Figure 1d, f).
Figure 2. NrasG12D/+ increased HSC and MPP self-renewal.

a) Secondary transplantation (n=19 recipients/genotype) of 3×10⁶ bone marrow cells from primary recipient mice in Figure 1c (n=4 donors/genotype). Donor cell reconstitution in the myeloid (Mac-1+), B (B220+), and T (CD3+) cell lineages for 4 to 20 weeks after transplantation b) Transplantation of 3×10⁶ bone marrow cells from secondary recipient mice in Figure 2a (n=3 donors/genotype) into tertiary recipient mice (n=8 recipients for control and 9 recipients for NrasG12D/+) c) Transplantation of 3×10⁶ bone marrow cells from tertiary recipient mice (n=3 donors for control and 4 donors for NrasG12D/+) in Figure 2b into quaternary recipient mice (n=7 recipients for control and 17 for NrasG12D/+). Each serial transplant was performed at 20 weeks after the prior round of transplantation. Data represent mean±s.d.. Two-tailed student's t-tests were used to assess statistical significance. *P<0.05, **P<0.01, ***P<0.001.
A fifth round of transplantation from four quaternary recipients of NrasG12D/+ cells did not yield any multilineage reconstitution by donor cells in the recipient mice (Extended data Figure 3). NrasG12D/+ HSCs, therefore, eventually exhausted their self-renewal potential despite self-renewing more than control cells. Serial transplantation of Vav1-Cre; NrasG12D/+ whole bone marrow cells showed that NrasG12D/+ significantly increased HSC competitiveness in this genetic background as well (Extended data Figure 2b and 2c).
To test whether NrasG12D expression influenced the reconstituting potential of MPPs we transplanted 10 donor CD150−CD48−LSK cells22 from the bone marrow of Mx-1-Cre; NrasG12D/+ or littermate control mice (2 weeks after finishing pIpC) into irradiated recipients along with 3×10⁵ recipient bone marrow cells. Only one of 14 recipients of control MPPs exhibited long-term multilineage reconstitution by donor cells (Extended data Figure 4a). In contrast, 8 of 17 recipients of NrasG12D/+ MPPs were long-term multilineage reconstituted by donor cells. NrasG12D/+ MPPs were thus significantly (p<0.01 across three independent experiments) more likely to give long-term multilineage reconstitution than control MPPs.
NrasG12D did not detectably affect the reconstituting potential of 25 CD150+CD48+LSK cells or 100 CD150−CD48+LSK cells (which contain restricted myeloid progenitors22) upon transplantation into irradiated mice (Extended data Figure 4b and 4c). NrasG12D/+ thus increases the self-renewal potentials of HSCs and MPPs but not necessarily other progenitors.
We did not detect any evidence of leukemia or MPN in any of the recipient mice from the first, second, third, or fourth rounds of serial transplantation in terms of blood cell counts (Extended data Figure 5) or histology (data not shown). Only two recipients of NrasG12D/+ cells and two recipients of control cells died spontaneously in these experiments. The effects of NrasG12D/+ on HSC function therefore occurred in the absence of leukemogenesis.
To assess the effect of NrasG12D/+ on HSC cycling over time we mated the Mx1-cre; NrasG12D/+ mice with Col1A1-H2B-GFP; Rosa26-M2-rtTA double transgenic mice 4. These mice allowed us to label HSCs with H2B-GFP during a 6 week period of doxycycline administration and then to follow the division history of all cells in the HSC pool as they diluted H2B-GFP with each round of division during a subsequent 12–15 week chase without doxycycline.
Two weeks after pIpC treatment, Mx1-cre; NrasG12D/+; Col1A1-H2B-GFP; Rosa26-M2-rtTA mice and NrasG12D/+; Col1A1-H2B-GFP; Rosa26-M2-rtTA controls (lacking Cre) exhibited similar background levels of GFP fluorescence (Figure 3a). After treating the mice with doxycycline for 6 weeks, all HSCs were strongly GFP+ (Figure 3a). Mx1-cre; NrasG12D/+ and control HSCs exhibited indistinguishable levels of H2B-GFP labeling immediately after doxycycline treatment (Figure 3a). After a 12-week chase without doxycycline, the NrasG12D and control HSCs exhibited a wide range of GFP expression levels (Figure 3b). In contrast, most bone marrow cells from Mx1-cre; NrasG12D/+ and control mice exhibited GFP levels similar to background (Extended data Figure 6a). To assess the frequencies of HSCs that were most infrequently cycling, most frequently cycling, and moderately cycling we determined the frequencies of H2B-GFPhi HSCs (with GFP levels similar to freshly labeled cells, see Figure 3a), H2B-GFP− HSCs (with little or no GFP expression above background, see Figure 3a), and H2B-GFPlo HSCs (with intermediate levels of GFP), respectively. In eight independent experiments, NrasG12D significantly (p<0.05 by two-way ANOVA) increased the frequencies of both the H2B-GFP− frequently cycling HSCs and the H2B-GFPhi infrequently cycling HSCs in every pair of mice we examined (n=8) (Figure 3b). There was a corresponding significant decrease in the frequency of H2B-GFPlo HSCs in NrasG12D mice.
Figure 3. NrasG12D/+ has a bimodal effect on HSC cycling.

a) GFP expression in HSCs from Mx1-cre; NrasG12D/+; Col1A1-H2B-GFP; Rosa26-M2-rtTA mice (G12D/+) and littermate controls (control) without doxycycline treatment (n=3, left), or after 6 weeks of doxycycline treatment (n=3, right). b) GFP expression in HSCs from age and sex-matched pairs of NrasG12D/+ and control mice after labeling followed by 12 weeks of chase without doxycycline (n=8 pairs of mice from 8 independent experiments; p<0.05 by two-way ANOVA and posthoc pairwise t-tests). Despite overlapping standard deviations, differences were statistically significant in pairwise t-tests because the frequencies of H2B-GFP− HSCs and H2B-GFPhi HSCs were always higher in the NrasG12D/+ mice. c) GFP expression in HSCs from pairs of age and sex-matched NrasG12D/+ and control mice after 15 weeks of chase without doxycycline (n=7 mice from 5 independent experiments). NrasG12D/+ mice always had higher frequencies of H2B-GFPhi HSCs (p<0.05 by pairwise t-tests). d) We transplanted 15 CD150+CD48−LSK H2B-GFPhi HSCs, 50 H2B-GFPlo HSCs, or 75 H2B-GFP− HSCs from NrasG12D/+ or littermate control mice after 12 weeks of chase into irradiated wild-type recipients along with 3×10⁵ recipient bone marrow cells (2 independent experiments with a total of 7 recipients/genotype). Data represent mean±s.d.. Unless otherwise stated, two-tailed student's t-tests were used to assess statistical significance. *P<0.05, **P<0.01, ***P<0.001.
The median level of GFP fluorescence in H2B-GFP− HSCs was significantly lower in NrasG12D/+ as compared to control mice (Extended data Figure 6b), suggesting that H2B-GFP− NrasG12D/+ HSCs underwent more rounds of division on average. In contrast, the median level of GFP fluorescence in H2B-GFPhi HSCs was significantly higher in NrasG12D/+ as compared to control mice (Extended data Figure 6b), suggesting that H2B-GFPhi NrasG12D/+ HSCs tended to divide less than control H2B-GFPhi HSCs on average. NrasG12D/+ thus had a bimodal effect, increasing the division of some HSCs and reducing the division of other HSCs.
We followed another cohort of age and sex-matched pairs of Mx1-cre; NrasG12D/+ and control mice for 15 weeks after doxycycline removal. In five independent experiments, NrasG12D significantly increased the frequency of H2B-GFPhi HSCs in every pair of mice we examined (n=7; p<0.05) (Figure 3c). We observed increased frequencies of H2B-GFP− HSCs in the NrasG12D/+ mice from some pairs but not others, and overall the effect was not statistically significant (Figure 3c). Since the rapidly dividing subset of NrasG12D/+ HSCs differentiates more quickly than control HSCs (Figure 3d), prolonged periods of chase after H2B-GFP labeling may not be appropriate to quantify the frequency of these cells. NrasG12D/+ significantly increased the rate at which MPPs divided (Extended data Figure 6c).
To test the relationship between division history and competitiveness we transplanted 15 CD150+CD48−LSK H2B-GFPhi HSCs, 50 H2B-GFPlo moderately cycling HSCs, or 75 H2B-GFP− frequently cycling HSCs from NrasG12D/+ or control donor mice after 12 weeks of chase into irradiated wild-type recipients along with 3×10⁵ recipient bone marrow cells. The NrasG12D/+ H2B-GFP− frequently cycling HSCs gave significantly lower levels of donor cell reconstitution, at least in the myeloid lineages, as compared to control H2B-GFP− HSCs (Figure 3d). In contrast, the NrasG12D/+ H2B-GFPlo and H2B-GFPhi HSCs gave significantly (p<0.05) higher levels of donor cell reconstitution in all lineages than the control H2B-GFPlo and H2B-GFPhi HSCs (Figure 3d). NrasG12D/+ thus reduced the division and increased the competitiveness of some HSCs while increasing the division and reducing the competitiveness of other HSCs.
We continuously administered BrdU to Mx1-cre; NrasG12D/+ versus control mice beginning two weeks after pIpC treatment. We assessed the frequency of BrdU+ HSCs after 4, 10, 20, and 30 days of BrdU treatment (Extended data Figure 6d). Relative to control HSCs, significantly more Mx1-cre; NrasG12D/+ HSCs incorporated BrdU after 4 (32±0.1% versus 24±1.2%, p<0.01) and 10 (64±5.9% versus 45±3.6%, p<0.02) days of BrdU administration. In contrast, significantly fewer Mx1-cre; NrasG12D/+ HSCs incorporated BrdU after 20 (78±4.7% versus 86±0.7%, p<0.05) and 30 (86±3.4% versus 92±4.8%, p<0.02) days of BrdU administration. These data are consistent with the H2B-GFP label retention data in demonstrating that some NrasG12D/+ HSCs divide more frequently while other NrasG12D/+ HSCs divide less frequently than control HSCs.
We detected the activation of the canonical Ras effector, ERK, in bone marrow cells from Mx1-cre; NrasG12D/+ and Mx1-cre; NrasG12D/G12D mice but not in LSK stem/progenitor cells or Lineage−c-kit+Sca-1− myeloid progenitors (Extended data Figure 8a). We treated Mx1-cre; NrasG12D/+ or control mice with the MEK inhibitors, PD0325901 (5mg/kg/day) or AZD6244 (25mg/kg/day), and assessed the effects on BrdU incorporation in CD150+CD48−LSK HSCs. After eight days of treatment, splenocytes from PD0325901-treated mice of both genotypes showed reduced pERK levels (Extended data Figure 8b), but this did not affect the increased rate of BrdU incorporation by NrasG12D/+ HSCs (Extended data Figure 8c). In contrast, when we performed the same experiments with AZD6244, pERK activation was completely blocked in bone marrow and spleen (Extended data Figure 8d) and the increased cycling of NrasG12D/+ HSCs was abolished (Supplementary figure 8e). These data suggest that the more stringent inhibition of pERK activation by AZD6244 blocks the effect of NrasG12D/+ on HSC cycling.
We did not detect increased Akt (Extended data Figure 8f), S6, or p38 (Figure 4a) phosphorylation in whole bone marrow cells, CD48−LSK cells (HSCs and MPPs) or CD48+LSK cells (mainly restricted progenitors22) from Mx1-cre; NrasG12D/+ mice.
Figure 4. Increased STAT5 activation mediates the effect of NrasG12D/+ on HSCs.
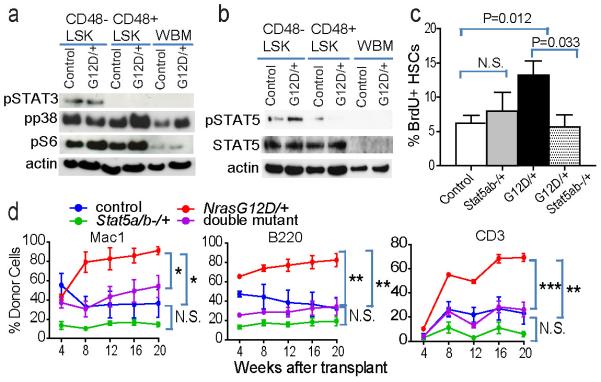
Western blots for pSTAT3, pp38, pS6, and ß-actin (a) and pSTAT5, total STAT5 and ß-actin (b) (two additional experiments are shown in Supplementary figure 8j). Cells were stimulated in culture with SCF and TPO for 30 minutes before protein extraction. c) The frequency of BrdU+CD150+CD48−LSK HSCs after a 24-hour pulse of BrdU to Mx1-cre; Stat5abfl/+ (Stat5ab−/+) mice, Mx1-cre; NrasG12D/+ (G12D/+) mice, Mx1-cre; NrasG12D/+; Stat5abfl/+ (G12D/+; Stat5ab−/+) compound mutant mice, or control mice (n=4). d) 5×10⁵ donor bone marrow cells from mice of each genotype were transplanted into irradiated recipients along with 5×10⁵ recipient bone marrow cells (2 independent experiments with a total of 8 recipients/genotype). Data represent mean±s.d.. Two-tailed student's t-tests were used to assess statistical significance.
We performed gene expression profiling of H2B-GFP− and H2B-GFPhi CD150+CD48−LSK HSCs from 3 pairs of Mx1-cre; NrasG12D/+; Col1A1-H2B-GFP; Rosa26-M2-rtTA mice and littermate controls 12 weeks after removal of doxycycline. Gene set enrichment analysis (GSEA) revealed that cell cycle genes were significantly enriched in H2B-GFP− NrasG12D/+ HSCs as compared to H2B-GFP− control HSCs (p<0.0001) but not in H2B-GFPhi NrasG12D/+ HSCs as compared to H2B-GFPhi control HSCs (Extended data Figure 7d). DNA replication genes and RNA polymerase genes were significantly enriched in H2B-GFP− NrasG12D/+ HSCs as compared to H2B-GFP− control HSCs (p<0.05) but were significantly depleted in H2B-GFPhi NrasG12D/+ HSCs as compared to H2B-GFPhi control HSCs (p<0.01; Extended data Figure 7e, 7f). These data demonstrate different transcriptional responses to Nras activation in H2B-GFP− as compared to H2B-GFPhi HSCs: genes associated with cell cycling were induced by Nras activation in the H2B-GFP− HSCs but repressed by Nras activation in the H2B-GFPhi HSCs.
Only two genes showed a similar change in expression with Nras activation in all of the multipotent cells we studied (p≤0.05 and fold change≥2; Extended data Figure 7a–c). One of these, Suppressor of cytokine signaling 2 (Socs2), was significantly reduced in expression in NrasG12D/+ as compared to control cells by microarray and qRT-PCR (Extended data Figure 7c and 8g–i). SOCS2 negatively regulates STAT signaling in hematopoietic cells 23,24. We observed an increase in phosphorylated STAT5, but not STAT3, levels in NrasG12D/+ as compared to control CD48−LSK cells, without affecting total STAT5 levels (Figure 4a, 4b, and Extended data Figure 8j).
To test whether the increased STAT5 phosphorylation in NrasG12D/+ CD48−LSK cells increased HSC proliferation and self-renewal we mated Stat5abfl/+ mice 25 with Mx1-cre; NrasG12D/+ mice. Two weeks after finishing pIpC treatment, western blot of sorted CD48−LSK cells confirmed that deletion of one allele of Stat5ab in NrasG12D/+ HSCs reduced the levels of pSTAT5 and total STAT5 (Extended data Figure 8k). Stat5ab−/+ HSCs exhibited normal BrdU incorporation and NrasG12D/+ HSCs exhibited increased proliferation relative to control HSCs (Figure 4c). Deletion of one allele of Stat5ab in NrasG12D/+ HSCs significantly reduced the rate of BrdU incorporation (p<0.05). A reduction in STAT5 levels thus rescued the effects of NrasG12D on HSC cycling. Neither deletion of Stat5ab nor activation of NrasG12D/+ significantly affected BrdU incorporation by the myeloid progenitors we examined (Extended data Figure 8l).
We next transplanted 5×10⁵ whole bone marrow cells from control, Mx-1-Cre; NrasG12D/+ (NrasG12D/+), Mx-1-Cre; Stat5a/b−/+ (Stat5ab−/+), or Mx-1-Cre; NrasG12D/+; Stat5a/b−/+ (double mutant) donors (2 weeks after finishing pIpC treatment) into irradiated wild-type recipients along with 5×10⁵ recipient bone marrow cells. NrasG12D/+ cells gave significantly higher levels of reconstitution than control cells in all lineages for at least 20 weeks after transplantation (Figure 4d). Loss of one Stat5ab allele (Stat5ab+/−) reduced the level of reconstitution by donor cells relative to control cells but the difference was not statistically significant. In contrast, loss of a single allele of Stat5ab in the NrasG12D/+ background completely blocked the increased reconstitution by NrasG12D/+ cells such that levels of donor cell reconstitution were indistinguishable from control cells (Figure 4d). An increase in STAT5 signaling is therefore required for increased competitiveness by NrasG12D HSCs.
NrasG12D is likely an early mutation in some leukemias as it is widely observed in both MPN and myeloid leukemias2 and NrasG12D mutations in mice lead only to a late onset MPN with prolonged survival16,17. NRAS and KRAS mutations are frequently among the first mutations observed in pre-leukemic clones that precede CMML26. Some JMML patients undergo remission, with or without therapy, yet continue to carry NRAS mutations in their hematopoietic cells27,28. Germline NRAS mutations have also been reported in JMML patients 29, or patients with Noonan syndrome that develop JMML30. The evidence that NRAS mutations can be found in normal hematopoietic cells, despite predisposing for the development of neoplasms, is consistent with our conclusion that they promote pre-leukemic clonal expansion.
Our data provide a molecular explanation for how pre-leukemic clonal expansion may occur. NrasG12D/+ has a bimodal effect on HSCs, increasing self-renewal potential and reducing division in one subset of HSCs while increasing division and reducing self-renewal in another subset of HSCs. Short-lived but rapidly dividing NrasG12D/+ HSCs presumably outcompete wild-type HSCs and are replenished over time by quiescent NrasG12D/+ HSCs that are slowly recruited into cycle. It will be interesting to determine whether the ability to induce bimodal responses in stem cell pools is a common feature of mutations that promote pre-malignant clonal expansion.
EXTENDED DATA
METHODS
Mice
All mice were housed in the Unit for Laboratory Animal Medicine at the University of Michigan and protocols were approved by the University of Michigan Committee on the Use and Care of Animals. NrasG12D/+ 20, Stat5ab+/− 25, Col1A1-H2B-GFP; Rosa26-M2-rtTA4, Vav1-Cre, and Mx-1-Cre mice were backcrossed for at least 10 generations onto a C57BL/Ka-CD45.2:Thy-1.1 background. Recipients in reconstitution assays were adult C57BL/Ka-CD45.1:Thy-1.2 mice, at least 8 weeks old at the time of irradiation. pIpC (Amersham) was reconstituted in PBS and administered at 0.5 μg/gram body mass/day by intraperitoneal injection. BrdU (Sigma) was administered as a single dose of 200mg/kg body mass by intraperitoneal injection followed by 1mg/ml BrdU in the drinking water. For long term BrdU administration, BrdU water was changed every 3 days. Doxycycline (Research Products International Corporation) was added to the water at a concentration of 0.2% (m/v) along with 1% sucrose (Fisher).
Statistical Methods
Multiple independent experiments were performed to verify the reproducibility of all experimental findings. Group data always represents mean±standard deviation. Unless otherwise indicated, two-tailed Student's t-tests were used to assess statistical significance. No randomization or blinding was used in any experiments. Experimental mice were not excluded in any experiments. In the case of measurements in which variation among experiments tends to be low (e.g. HSC frequency) we generally examined 3–6 mice. In the case of measurements in which variation among experiments tends to be higher (e.g. reconstitution assays) we examined larger numbers of mice (7–20).
PCR of genomic DNA for genotyping
To assess the degree of NrasG12D recombination in HSCs from Mx1-cre; NrasG12D/+ mice after pIpC treatment, bone marrow cells were harvested and stained for surface markers as described above. Single HSCs (CD150+CD48−LSK cells) were sorted into 96 well plates containing methylcellulose medium (M3434, Stem Cell Technologies) and incubated for 14 days at 37°C. Cells from each colony were re-suspended in PBS then incubated with alkaline lysis buffer (25 mM NaOH, 0.2 mM EDTA), boiled, then neutralized by addition of an equal volume of neutralizing buffer (40 mM Tris-HCl). The neutralized extract was used for PCR with the following primers: F2: 5' - aga cgc gga gac ttg gcg agc - 3'; R1: 5' - gct gga tcg tca agg cgc ttt tcc - 3'. To genotype mouse tail DNA for the presence of the NrasG12D allele, primers R1 and F2 were used in addition to primer SD5', 5' - agc tag cca cca tgg ctt gag taa gtc tgc a - 3'. To genotype for the presence of the Mx1-cre transgene, primers F1 and R1 were used: F1 5'-att gct gtc act tgg tcg tgg c-3', R1 5'-gaa aat gct tct gtc cgt ttg c-3'. To check the presence of the Rosa26-M2-rtTA transgene, the following primers were used: 5' Aaa gtc gct ctg agt tgt tat 3'; 5' Gcg aag agt ttg tcc tca acc 3'; and 5' Gga gcg gga gaa atg gat atg 3'. To genotype mice for the presence of the Col1A1-H2B-GFP transgene, the following primers were used: 5' ctg aag ttc atc tgc acc acc 3', 5' gaa gtt gta ctc cag ctt gtg c 3'. To genotype mice for the deletion of Stat5ab, the following primers were used: 5' gaa agc agc atg aaa ggg ttg gag 3'; 5' agc agc aac cag agg act ac 3'; and 5' aag tta tct cga gtt agt cag g 3'.
Flow cytometry and HSC isolation
Bone marrow cells were flushed from the long bones (tibias and femurs) with Hank's buffered salt solution without calcium or magnesium, supplemented with 2% heat-inactivated calf serum (HBSS; Invitrogen). Cells were triturated and filtered through nylon screen (70 mm; Sefar America) to obtain a single-cell suspension. CD150+CD48−Lin−Sca1+c-kit+ HSCs and CD150−CD48−Lin−Sca1+c-kit+ MPPs were isolated as previously described21,22. For isolation of HSCs, whole bone marrow cells were incubated with antibodies to lineage (Lin) markers including B220 (6B2), CD3 (KT31.1), CD5 (53-7.3), CD8 (53-6.7), Gr-1 (8C5), CD41 (MWReg30) and Ter119 (Ter-119) that were conjugated to FITC, anti-CD150 antibody (TC15-12F12.2) conjugated to PE, anti-CD48 antibody (HM48-1) conjugated to PE-Cy7, anti-c-kit antibody (2B8) conjugated to APC, and anti-Sca1 antibody (D7) conjugated to PerCP/Cy5.5 (all antibodies were purchased from Biolegend). After washing, cells were incubated with anti-APC conjugated to paramagnetic microbeads (Miltenyi Biotec). The microbead bound (c-kit+) cells were then enriched using LS columns (Miltenyi Biotec). To identify CD45.2+ HSCs, antibodies against CD45.2 (104-FITC; BioLegend) and CD45.1 (A20-APC780, BioLegend) were used. Non-viable cells were excluded from sorts and analyses using the viability dye 4′,6-diamidino-2-phenylindole (DAPI) (1 μg/ml). BrdU incorporation in vivo was measured by flow cytometry using the APC BrdU Flow Kit (BD Biosciences). To perform Pyronin Y and DAPI staining, CD150+CD48–LSK HSCs were sorted into 100% Ethanol and placed in the cold room overnight. The cells were then washed with PBS and stained with Pyronin Y (1ug/ml) and DAPI (10ug/ml) for 30 minutes before flow cytometric analysis
Long-term competitive repopulation assay
Adult recipient mice (CD45.1) were irradiated with an Orthovoltage X-ray source delivering approximately 300 rad min−1 in two equal doses of 540 rad, delivered at least 2 h apart. Cells were injected into the retro-orbital venous sinus of anaesthetized recipients. Beginning 4 weeks after transplantation and continuing for at least 16 weeks, blood was obtained from the tail veins of recipient mice, subjected to ammonium-chloride potassium red cell lysis, and stained with directly conjugated antibodies to CD45.2 (104), CD45.1 (A20), B220 (6B2), Mac-1 (M1/70), CD3 (KT31.1) and Gr-1 (8C5) to monitor engraftment.
BrdU incorporation by myeloid progenitors
Two and a half hours after BrdU administration, whole bone marrow cells were incubated first with anti-ckit antibody conjugated to biotin (2B8) then with antibodies to lineage (Lin) markers including B220 (6B2), CD3 (KT31.1), CD5 (53-7.3), CD8 (53-6.7), Gr-1 (8C5), CD41 (MWReg30) and Ter119 (Ter-119) that were conjugated to phycoerythrin (PE), anti-CD34 antibody (eBioscience, RAM34) conjugated to FITC, anti-CD16/CD32 antibody (93) conjugated to PE-Cy7, streptavidin conjugated to Alexa700 (Invitrogen S21383), and anti-Sca1 antibody (D7) conjugated to PerCP/Cy5.5 (all antibodies were purchased from Biolegend unless otherwise stated). BrdU incorporation was measured by flow cytometry using the APC BrdU Flow Kit (BD Biosciences).
Western blotting
The same number of cells (30,000 cells for CD48−LSK cells or CD48+LSK cells; 100,000 cells for LSK or Lineage−ckit+Sca-1− cells) from each population to be analysed were sorted into HBSS with 2% FCS. The cells were then washed and incubated with 100ng/ml TPO and 100ng/ml SCF at 37°C for 30 minutes. The cells then were washed with PBS and precipitated with trichloroacetic acid (TCA) at a final concentration of 10% TCA. Extracts were incubated on ice for 15 min and spun down for 10 min at 16,100g at 4 °C. The supernatant was removed and the pellets were washed with acetone twice then dried. The protein pellets were solubilized with solubilization buffer (9 M urea, 2% Triton X-100, 1% DTT) before adding LDS loading buffer (Invitrogen). Proteins were separated on a Bis-Tris polyacrylamide gel (Invitrogen) and transferred to a PVDF membrane (Millipore). All antibodies were purchased from Cell Signaling technology. These include anti-pERK (T202/Y204), anti-pAkt (T308), anti-pS6 (S240/244), anti-pStat5 (Y694), anti-Stat3 (Y705), anti-ERK (137F5), anti-Stat5 (3H7), anti-pp38 (T180/Y182) and anti-β-actin (8H10D10).
Gene expression profiling
CD150+CD48−LSK HSCs and CD150−CD48−LSK MPPs were isolated by flow cytometry. Total RNA was isolated using Trizol (Invitrogen) followed by Qiagen RNeasy Micro kit purification according to the manufacturer's protocols. For microarray analysis, reverse transcription and linear amplification was performed on total RNA using the NuGen Ovation pico WTA system version 2 and then purified with the Qiaquick PCR purification kit (Qiagen). Six micrograms of amplified cDNAs were labeled with biotin using the Encore Biotin Module (NuGen) and submitted to the Microarray Core Facility of the University of Michigan Comprehensive Cancer Center for hybridization to Affymetrix Mouse Genome 430 2.0 Arrays. Statistical analyses were performed using R33 version 2.15.2 and Bioconductor version 2.1134. Gene expression signals were normalized to the trimmed average of 500 using the Affymetrix MAS 5.0 algorithm. MAS5 signals less than 2 were set to 2 before log2 transformation. Probe sets with MAS5 absent calls for all samples were excluded. Differential expression analysis was performed by limma35 with estimation of fold change. Probe sets with limma p-value<0.05 and fold change>2 were considered differentially expressed. Gene Set Enrichment Analysis36 was used to assess pathway enrichment. Gene expression data have been deposited to the Gene Expression Omnibus (http://www.ncbi.nlm.nih.gov/geo/; accession number GSE45194).
Quantitative RT-PCR
Total RNA was collected as described above and reverse transcription was performed with the High Capacity cDNA reverse transcription kit (Applied Biosystems). Real time PCR was performed with Absolute Sybr Green Rox mix (Thermo Scientific) using an ABI 7300 PCR machine. RNA from 100 cells was used for each reaction. Transcript levels were normalized to β-actin.
Extended data Figure 1.

a) The NrasG12D allele was recombined in all HSCs after 3 doses (every other day) of pIpC. Two weeks after the last dose of pIpC was administered to Mx1-cre; NrasG12D/+ mice, the mice were sacrificed and individual CD150+CD48−LSK HSCs were sorted into methylcellulose cultures in 96 well plates. The cells were cultured for 14 days then DNA was extracted from individual colonies and genotyped by PCR. The size of the recombined NrasG12D allele (G12D) was 550bp and the Nras+ allele (WT) was 500bp. Nras recombination was observed in 22 of 22 HSC colonies examined. Blot is representative of three independent experiments. b) Cell cycle analysis of HSCs by pyronin Y and DAPI staining. CD150+CD48−LSK HSCs were sorted from Mx1-cre; NrasG12D/+ mice and littermate controls into 100% ethanol and stained with pyronin Y and DAPI to identify cells in G0 (left lower quadrant), G1 (left upper quadrant) and S/G2/M (right upper and lower quadrants). Data represent mean±s.d.. Statistical analysis was performed with a two-way ANOVA (P<0.01, n=4) followed by pairwise posthoc t-tests.
Extended data Figure 2. HSC competitiveness is increased in Vav1-Cre; NrasG12D/+ mice.

a) Frequencies of CD150+CD48−LSK HSCs, CD150−CD48−LSK MPPs, and LSK cells in the bone marrow (BM, top row) and spleen (sp, bottom row) of Vav1-cre; NrasG12D/+ (G12D/+) or littermate control (con) mice (n=4) at 6-10 weeks of age. b) 5×10⁵ donor bone marrow cells from Vav1-cre; NrasG12D/+ (G12D/+) or littermate control (con) mice at 6-10 weeks of age were transplanted into irradiated recipient mice along with 5×10⁵ recipient bone marrow cells (3 donors/genotype were each transplanted into 4 recipients/donor). c) Secondary transplantation of 3×10⁶ bone marrow cells from primary recipient mice in Extended data Figure 2b at 20 weeks after transplantation (2 primary recipients/genotype were each transplanted into 4 secondary recipients/primary recipient). Data represent mean±s.d.. Two-tailed student's t-tests were used to assess statistical significance. *P<0.05, **P<0.01, ***P<0.001.
Extended data Figure 3. HSCs from Mx1-cre; NrasG12D/+ mice were not immortalized.
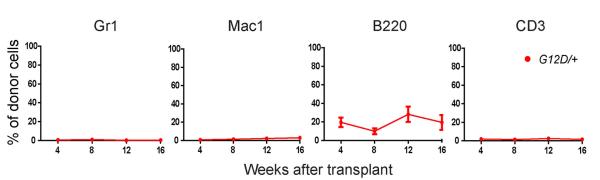
A fifth round of serial transplantation of 3×10⁶ bone marrow cells from the quaternary recipients of NrasG12D/+ (G12D/+) bone marrow cells shown in Figure 2c showed that the NrasG12D/+ HSCs eventually exhausted all of their HSCs and MPPs and were able to only give low levels of lymphoid reconstitution. Four donor mice from Figure 2c were transplanted 20 weeks after the fourth round of transplantation into 4 recipients per quaternary donor. The data represent mean±s.d. for donor blood cells in the myeloid (Gr-1+ or Mac-1+ cells), B (B220+), and T (CD3+) cell lineages.
Extended data Figure 4. NrasG12D (G12D/+) expression increased the reconstituting potential of CD150−CD48+LSK MPPs but did not affect the reconstituting potential of CD150+CD48+LSK, or CD150−CD48+LSK progenitors in irradiated mice.

a) 10 donor MPPs, b) 25 CD150+CD48+LSK progenitors, or c) 100 CD150−CD48+LSK progenitors from Mx1-cre; NrasG12D/+ (G12D/+) or littermate control (con) mice at 2 weeks after pIpC treatment were transplanted into irradiated recipient mice along with 3×10⁵ recipient bone marrow cells. Data represent mean±s.d. for donor blood cells in the myeloid (Gr-1+ or Mac-1+ cells), B (B220+), and T (CD3+) cell lineages. Two-tailed student's t-tests were used to assess statistical significance. None of the time points were significantly different between treatments. The data represent two independent experiments with 4 recipient mice per donor
Extended data Figure 5. NrasG12D-induced changes in HSC function were not associated with the development of leukemia.

White blood counts (WBC), hemoglobulin (Hb) levels, platelet counts, and spleen masses for recipient mice from primary transplants (a; from Figure 1d), secondary transplants (b; from Figure 2a), tertiary transplants (c; from Figure 2b) and quaternary transplants (d; from Figure 2c). In all cases, these blood cell counts were collected from mice after the analysis of blood cell reconstitution was complete (at least 20 weeks after transplantation). The transplanted mice were observed for a median time of 260 (162–315) days for primary recipient mice, 194 (122–264) days for secondary recipient mice, 224 (176–336) days for tertiary recipient mice, and 280 (279–280) days for quaternary recipient mice. We never observed evidence of leukemia or MPN by histology in these mice. Across all of the experiments, only two recipients of NrasG12D/+ cells and two recipients of control cells died spontaneously. Data represent mean±s.d.. Two-tailed student's t-tests were used to assess statistical significance and none of the comparisons showed significant difference.
Extended data Figure 6. NrasG12D/+ had a bimodal effect on HSC cycling but increased the rate at which MPPs divide.

a) Flow cytometric analysis of GFP expression in whole bone marrow cells from NrasG12D/+ or littermate control mice after 12 weeks of chase without doxycycline. b) Median GFP fluorescence intensity of H2B-GFP−, H2B-GFPlo and H2B-GFPhi HSCs from wild type and NrasG12D/+ mice (n=8 mice/genotype). GFP levels in control HSCs were set to one for comparison to relative levels in NrasG12D/+ HSCs. c) NrasG12D increased the rate of division by MPPs. Flow cytometric analysis of GFP expression in CD150−CD48−LSK MPPs from Mx1-cre; NrasG12D/+; Col1A1-H2B-GFP; Rosa26-M2-rtTA mice (G12D/+) and littermate controls (con) after 12 weeks of chase(n=8 mice/genotype). Relative to control MPPs, NrasG12D/+ MPPs included significantly more H2B-GFP− frequently cycling cells and significantly fewer H2B-GFPlo MPPs (p<0.05 by two-way ANOVA and posthoc pairwise t-tests). d) We continuously administered BrdU to Mx1-cre; NrasG12D/+ versus control mice for 1 to 30 days and determined the frequency of BrdU+ HSCs (1 day BrdU data are from Figure 1a). Data represent mean±s.d.. Two-tailed student's t-tests were used to assess statistical significance unless stated otherwise. *P<0.05, **P<0.01, ***P<0.001.
Extended data Figure 7. Gene expression profiling demonstrates different transcriptional responses to Nras activation in quiescent as compared to frequently dividing HSCs.

a) CD150+CD48−LSK HSCs and CD150−CD48−LSK MPPs were isolated from three pairs of Mx1-cre; NrasG12D/+ and littermate controls and gene expression profiling was performed with Affymetrix mouse genome 430 2.0 microarrays. The Venn diagram shows the number of genes that were differentially expressed between NrasG12D/+ and controls cells within each cell population (fold change≥2). b) Venn diagram of genes that were differentially expressed between NrasG12D/+ and control GFP− HSCs and GFPhigh HSCs isolated from 3 pairs of Mx1-cre; NrasG12D/+; Col1A1-H2B-GFP; Rosa26-M2-rtTA mice and littermate controls (fold change ≥and p value ≤0.05). c) Genes that were consistently increased or decreased in expression in response to Nras activation in HSCs, MPPs, GFP− HSCs, and GFPhigh HSCs (fold change≥2 and p≤0.05 in each cell population). d, e, f) Gene set enrichment analysis (GSEA) of cell cycle genes d), DNA replication genes e) and RNA polymerase genes f).
Extended data Figure 8. Nras activation increases STAT5 phosphorylation.

a) Western blot for phosphorylated ERK (pERK) in LSK stem/progenitor cells, Lin−c-kit+Sca1− progenitor cells, or whole bone marrow (WBM) cells from Mx1-cre; NrasG12D/+ (G12D/+) mice, Mx1-cre; NrasG12D/G12D (G12D/G12D) mice, or littermate controls 2 weeks after pIpC treatment b) Western blot of pERK and total ERK in 106 uncultured splenocytes from Mx1-cre; NrasG12D/+ (G12D/+) or control mice after 8 days treatment with PD0325901 MEK inhibitor or vehicle (blot is representative of four independent experiments). c) The frequency of BrdU+ CD150+CD48−LSK HSCs after a 24-hour pulse of BrdU to Mx1-cre; NrasG12D/+ (G12D/+) or control mice after 7 days of PD0325901 MEK inhibitor or vehicle (mean±s.d. from four experiments). d) Western blot of pERK and total ERK in 106 uncultured bone marrow cells from Mx1-cre; NrasG12D/+ (G12D/+) or control mice after 8 days of AZD6244 MEK inhibitor or vehicle (blot is representative of four independent experiments). e) The frequency of BrdU+ CD150+CD48−LSK HSCs after a 24-hour pulse of BrdU to Mx1-cre; NrasG12D/+ (G12D/+) or control mice after 7 days of AZD6244 MEK inhibitor or vehicle (mean±s.d. from four experiments). f) Western blot for phosphorylated Akt (pAkt) in CD48−LSK HSCs/MPPs, CD48+LSK progenitors, or WBM cells from Mx1-cre; NrasG12D/+ (G12D/+) mice, Mx1-cre; Ptenfl/fl (Pten−/−) mice, or littermate controls 2 weeks after pIpC treatment. g) Socs2 transcript levels in HSCs and MPPs from Mx1-cre; NrasG12D/+ (G12D/+) or control mice by microarray analysis (top, n=3) and qRT-PCR (bottom, n=7). h, i) Socs2 transcript levels in GFP− and GFPhigh HSCs from Mx1-cre; NrasG12D/+; Col1A1-H2B-GFP; Rosa26-M2-rtTA mice and littermate controls by microarray (h, n=3) and qRT-PCR (, n=3). j) Western blotting showed that pSTAT5 levels were significantly increased in CD48−LSK HSCs/MPPs from Mx1-cre; NrasG12D/+ mice as compared to control mice. Left panel shows western blots of pSTAT5 and total STAT5 from two independent experiments. Right panel shows quantification of pSTAT5 levels from western blots from three independent experiments (signals were quantitated using NIH ImageJ software). Blot 1 was shown in Figure 4e. k) Western blot showed that STAT5 levels were reduced in CD48−LSK HSCs/MPPs from Mx1-cre; Stat5ab−/+ or Mx1-cre; NrasG12D/+; Stat5ab−/+ mice as compared to control and Mx1-cre; NrasG12D/+ mice (blot is representative of four independent experiments). l) BrdU incorporation into common myeloid progenitors (CMPs; Lin−Sca1−ckit+CD34+CD16/32−), granulocyte macrophage progenitors (GMPs; Lin−Sca1−ckit+CD34+CD16/32+), and megakaryocyte erythroid progenitors (MEPs; Lin−Sca1−ckit+CD34−CD16/32−) from control, Mx1-cre; Stat5ab−/+, Mx1-cre; NrasG12D/+, or Mx1-cre; NrasG12D/+; Stat5ab−/+ mice after a 2.5 hour pulse of BrdU (n=4 mice/treatment). Data represent mean±s.d.. Two-tailed student's t-tests were used to assess statistical significance.
EXTENDED DATA REFERENCES
- 31.Yilmaz OH, et al. Pten dependence distinguishes haematopoietic stem cells from leukaemia-initiating cells. Nature. 2006;441:475–482. doi: 10.1038/nature04703. [DOI] [PubMed] [Google Scholar]
- 32.Lee JY, et al. mTOR activation induces tumor suppressors that inhibit leukemogenesis and deplete hematopoietic stem cells after Pten deletion. Cell stem cell. 2010;7:593–605. doi: 10.1016/j.stem.2010.09.015. [DOI] [PMC free article] [PubMed] [Google Scholar]
- 33.R Development Core Team R: A language and environment for statistical computing. 2009 http://www.R-project.org.
- 34.Gentleman RC, et al. Bioconductor: open software development for computational biology and bioinformatics. Genome Biol. 2004;5:R80. doi: 10.1186/gb-2004-5-10-r80. [DOI] [PMC free article] [PubMed] [Google Scholar]
- 35.Smyth GK. Linear models and empirical bayes methods for assessing differential expression in microarray experiments. Stat Appl Genet Mol Biol. 2004;3 doi: 10.2202/1544-6115.1027. Article3. [DOI] [PubMed] [Google Scholar]
- 36.Subramanian A, et al. Gene set enrichment analysis: a knowledge-based approach for interpreting genome-wide expression profiles. Proceedings of the National Academy of Sciences of the United States of America. 2005;102:15545–15550. doi: 10.1073/pnas.0506580102. [DOI] [PMC free article] [PubMed] [Google Scholar]
ACKNOWLEDGEMENTS
SJM is a Howard Hughes Medical Institute Investigator and the Mary McDermott Cook Chair in Pediatric Genetics. This work was supported by the Cancer Prevention and Research Institute of Texas. Q.L. was supported by NIH K08-CA-134649 and V Foundation V Scholar award. Thanks to Drs. Lothar Hennighausen, Kevin Haigis, and Hanno Hock for generously providing Stat5abfl, NrasG12D, and Col1A1-H2B-GFP; Rosa26-M2-rtTA mice. Thanks to Maggie Heeren and Kritika Rajan for help with genotyping and to Rose Coolon and Nathan Vanderveen for mouse colony management.
Footnotes
AUTHOR CONTRIBUTIONS Q.L performed most of the experiments. N.B., T.W. and V.N. performed some of the experiments with help from Q.L. J.M. performed the western analysis of Pten mutant cells. S.C performed statistical analysis of microarrays. Q.L., K.S., and S.J.M. conceived the project, designed experiments, interpreted results, and wrote the manuscript.
COMPETING INTERESTS The authors declare no competing financial interests.
REFERENCES
- 1.Rossi DJ, Jamieson CH, Weissman IL. Stems cells and the pathways to aging and cancer. Cell. 2008;132:681–696. doi: 10.1016/j.cell.2008.01.036. [DOI] [PubMed] [Google Scholar]
- 2.Ward AF, Braun BS, Shannon KM. Targeting oncogenic Ras signaling in hematologic malignancies. Blood. 2012;120:3397–3406. doi: 10.1182/blood-2012-05-378596. [DOI] [PMC free article] [PubMed] [Google Scholar]
- 3.Essers MA, et al. IFNalpha activates dormant haematopoietic stem cells in vivo. Nature. 2009;458:904–908. doi: 10.1038/nature07815. [DOI] [PubMed] [Google Scholar]
- 4.Foudi A, et al. Analysis of histone 2B-GFP retention reveals slowly cycling hematopoietic stem cells. Nat Biotechnol. 2009;27:84–90. doi: 10.1038/nbt.1517. [DOI] [PMC free article] [PubMed] [Google Scholar]
- 5.Wilson A, et al. Hematopoietic stem cells reversibly switch from dormancy to self-renewal during homeostasis and repair. Cell. 2008;135:1118–1129. doi: 10.1016/j.cell.2008.10.048. [DOI] [PubMed] [Google Scholar]
- 6.Rossi L, et al. Less is more: unveiling the functional core of hematopoietic stem cells through knockout mice. Cell stem cell. 2012;11:302–317. doi: 10.1016/j.stem.2012.08.006. [DOI] [PMC free article] [PubMed] [Google Scholar]
- 7.Kamminga LM, et al. The Polycomb group gene Ezh2 prevents hematopoietic stem cell exhaustion. Blood. 2006;107:2170–2179. doi: 10.1182/blood-2005-09-3585. [DOI] [PMC free article] [PubMed] [Google Scholar]
- 8.Liu F, et al. Csf3r mutations in mice confer a strong clonal HSC advantage via activation of Stat5. J Clin Invest. 2008;118:946–955. doi: 10.1172/JCI32704. [DOI] [PMC free article] [PubMed] [Google Scholar]
- 9.Yuan Y, Shen H, Franklin DS, Scadden DT, Cheng T. In vivo self-renewing divisions of haematopoietic stem cells are increased in the absence of the early G1-phase inhibitor, p18INK4C. Nat Cell Biol. 2004;6:436–442. doi: 10.1038/ncb1126. [DOI] [PubMed] [Google Scholar]
- 10.Moran-Crusio K, et al. Tet2 loss leads to increased hematopoietic stem cell self-renewal and myeloid transformation. Cancer cell. 2011;20:11–24. doi: 10.1016/j.ccr.2011.06.001. [DOI] [PMC free article] [PubMed] [Google Scholar]
- 11.Challen GA, et al. Dnmt3a is essential for hematopoietic stem cell differentiation. Nat Genet. 2012;44:23–31. doi: 10.1038/ng.1009. [DOI] [PMC free article] [PubMed] [Google Scholar]
- 12.Takizawa H, et al. Enhanced engraftment of hematopoietic stem/progenitor cells by the transient inhibition of an adaptor protein, Lnk. Blood. 2006;107:2968–2975. doi: 10.1182/blood-2005-05-2138. [DOI] [PubMed] [Google Scholar]
- 13.Buza-Vidas N, et al. Cytokines regulate postnatal hematopoietic stem cell expansion: opposing roles of thrombopoietin and LNK. Genes Dev. 2006;20:2018–2023. doi: 10.1101/gad.385606. [DOI] [PMC free article] [PubMed] [Google Scholar]
- 14.Braun BS, et al. Somatic activation of oncogenic Kras in hematopoietic cells initiates a rapidly fatal myeloproliferative disorder. Proceedings of the National Academy of Sciences of the United States of America. 2004;101:597–602. doi: 10.1073/pnas.0307203101. [DOI] [PMC free article] [PubMed] [Google Scholar]
- 15.Sabnis AJ, et al. Oncogenic Kras initiates leukemia in hematopoietic stem cells. PLoS Biol. 2009;7:e59. doi: 10.1371/journal.pbio.1000059. [DOI] [PMC free article] [PubMed] [Google Scholar]
- 16.Li Q, et al. Hematopoiesis and leukemogenesis in mice expressing oncogenic NrasG12D from the endogenous locus. Blood. 2011;117:2022–2032. doi: 10.1182/blood-2010-04-280750. [DOI] [PMC free article] [PubMed] [Google Scholar]
- 17.Wang J, et al. Endogenous oncogenic Nras mutation promotes aberrant GM-CSF signaling in granulocytic/monocytic precursors in a murine model of chronic myelomonocytic leukemia. Blood. 2010;116:5991–6002. doi: 10.1182/blood-2010-04-281527. [DOI] [PMC free article] [PubMed] [Google Scholar]
- 18.Zhang Y, Taylor BR, Shannon K, Clapp DW. Quantitative effects of Nf1 inactivation on in vivo hematopoiesis. J Clin Invest. 2001;108:709–715. doi: 10.1172/JCI12758. [DOI] [PMC free article] [PubMed] [Google Scholar]
- 19.Wang J, et al. NrasG12D/+ promotes leukemogenesis by aberrantly regulating hematopoietic stem cell functions. Blood. 2013;121:5203–5207. doi: 10.1182/blood-2012-12-475863. [DOI] [PMC free article] [PubMed] [Google Scholar]
- 20.Haigis KM, et al. Differential effects of oncogenic K-Ras and N-Ras on proliferation, differentiation and tumor progression in the colon. Nat Genet. 2008;40:600–608. doi: 10.1038/ngXXXX. [DOI] [PMC free article] [PubMed] [Google Scholar]
- 21.Kiel MJ, Yilmaz OH, Iwashita T, Terhorst C, Morrison SJ. SLAM Family Receptors Distinguish Hematopoietic Stem and Progenitor Cells and Reveal Endothelial Niches for Stem Cells. Cell. 2005;121:1109–1121. doi: 10.1016/j.cell.2005.05.026. [DOI] [PubMed] [Google Scholar]
- 22.Oguro H, Ding L, Morrison SJ. SLAM Family Markers Resolve Functionally Distinct Subpopulations of Hematopoietic Stem Cells and Multipotent Progenitors. Cell stem cell. 2013;13:102–116. doi: 10.1016/j.stem.2013.05.014. [DOI] [PMC free article] [PubMed] [Google Scholar]
- 23.Krebs DL, Hilton DJ. SOCS proteins: negative regulators of cytokine signaling. Stem Cells. 2001;19:378–387. doi: 10.1634/stemcells.19-5-378. [DOI] [PubMed] [Google Scholar]
- 24.Li LX, Goetz CA, Katerndahl CD, Sakaguchi N, Farrar MA. A Flt3- and Ras-dependent pathway primes B cell development by inducing a state of IL-7 responsiveness. J Immunol. 2010;184:1728–1736. doi: 10.4049/jimmunol.0903023. [DOI] [PMC free article] [PubMed] [Google Scholar]
- 25.Cui Y, et al. Inactivation of Stat5 in mouse mammary epithelium during pregnancy reveals distinct functions in cell proliferation, survival, and differentiation. Mol Cell Biol. 2004;24:8037–8047. doi: 10.1128/MCB.24.18.8037-8047.2004. [DOI] [PMC free article] [PubMed] [Google Scholar]
- 26.Itzykson R, et al. Clonal architecture of chronic myelomonocytic leukemias. Blood. 2013;121:2186–2198. doi: 10.1182/blood-2012-06-440347. [DOI] [PubMed] [Google Scholar]
- 27.Kotecha N, et al. Single-cell profiling identifies aberrant STAT5 activation in myeloid malignancies with specific clinical and biologic correlates. Cancer Cell. 2008;14:335–343. doi: 10.1016/j.ccr.2008.08.014. [DOI] [PMC free article] [PubMed] [Google Scholar]
- 28.Matsuda K, et al. Spontaneous improvement of hematologic abnormalities in patients having juvenile myelomonocytic leukemia with specific RAS mutations. Blood. 2007;109:5477–5480. doi: 10.1182/blood-2006-09-046649. [DOI] [PubMed] [Google Scholar]
- 29.De Filippi P, et al. Germ-line mutation of the NRAS gene may be responsible for the development of juvenile myelomonocytic leukaemia. Br J Haematol. 2009;147:706–709. doi: 10.1111/j.1365-2141.2009.07894.x. [DOI] [PubMed] [Google Scholar]
- 30.Kraoua L, et al. Constitutional NRAS mutations are rare among patients with Noonan syndrome or juvenile myelomonocytic leukemia. Am J Med Genet A. 2012;158A:2407–2411. doi: 10.1002/ajmg.a.35513. [DOI] [PubMed] [Google Scholar]