Abstract
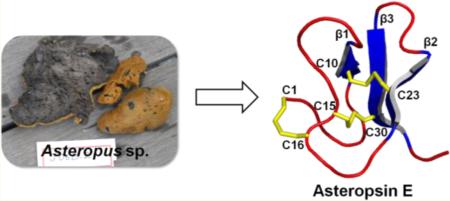
A novel cystine knot peptide, asteropsin E (ASPE), was isolated from an Asteropus sp. marine sponge. The primary, secondary, and tertiary structures of ASPE were determined by high-resolution 2D NMR spectroscopy (900 MHz). With the exception of an N-terminal modification, ASPE shares properties with the previously reported steropsins A–D, that is, the absence of basic residues, a highly acidic nature, conserved structurally important residues (including two cis-prolines), and a highly conserved tertiary structural framework. ASPE was found to be remarkably stable to gastrointestinal tract enzymes (chymotrypsin, elastase, pepsin, and trypsin) and to human plasma.
Despite the attractive advantages of potent pharmacological activity and high target specificity, the therapeutic use of peptides is often limited by their short in vivo half-lives.1 In particular, oral delivery of peptides presents a considerable challenge because peptide-based pharmaceuticals are rapidly degraded by enzymes in the gastrointestinal tract. Knottin peptides, which share a rigid molecular disulfide arrangement (III–VI through I–IV, II–V; also called a “cystine knot”) and a triple-stranded antiparallel β-sheet fold, have attracted considerable interest as novel scaffolds for oral peptide drugs due to their extraordinary proteolytic resistance and relatively straightforward chemical or recombinant syntheses.2
To date, development of knottin-based peptide scaffolds for oral drug delivery has focused mainly on cyclotides (head-to-tail cyclized knottins).3 The plant cyclotide kalata B1 has been popularly used as a scaffold for the development of stable peptide ligands for in vivo applications, but its oral bioavailability is dramatically decreased when the backbone is in a linear form.4 Most linear knottins are unsuitable for oral peptide drug delivery due to their instabilities to gastrointestinal proteases,5-7 although they do have the advantage of an easier synthesis than cyclotides because backbone cyclization is not required. Of the linear knottins investigated to date, the marine sponge-derived asteropsins A–D are the only linear knottin family members with characteristics that make them suitable for oral peptide delivery. In particular, asteropsins A–D exhibit notable stabilities in the gastrointestinal tract and in human plasma.8,9 Peptides of the knottin family have been reported from a diverse variety of organisms, but few marine-derived knottins have been discovered other than those from the cone snail family. Asteropine A (APA) was first reported in Asteropus simplex (a marine sponge) as a bacterial sialidase inhibitor.10 Our recent identification of asteropsins A–D (ASPA, ASPB, ASPC, and ASPD) in a sponge of the genus Asteropus suggests that the Porifera provide a source for an unusual variety of knottin-like peptides. The unique properties of asteropsins A–D, that is, a blocked N-terminus, a highly acidic nature, conserved structurally important residues, including two cis-prolines, and distinct bioactivities, distinguish them from other reported knottins.8,9
In the current study, we report a novel knottin-like peptide, asteropsin E (ASPE), which was isolated from an Asteropus sp. sponge. Solution NMR peptide structure elucidation is often limited to sequence-defined peptides, as determined by Edman degradation or MS/MS analyses. Here, we describe the primary, secondary, and tertiary structures of ASPE, which were elucidated solely by independent high-resolution 2D NMR spectroscopy (900 MHz). Its lack of basic residues makes ASPE inherently stable in the presence of trypsin, and it also showed remarkable stability in the presence of other enzymes of the gastrointestinal (GI) tract (including chymotrypsin, elastase, and pepsin) and in human plasma.
RESULTS AND DISCUSSION
Sequence Identification by High-Resolution 2D NMR (900 MHz)
ASPE was isolated from the MeOH extract of an Asteropus sp. by solvent partition and reversed-phase HPLC. The MALDI-TOF MS spectrum of ASPE exhibited a monoisotopic protonated molecule peak at m/z 3539.5 [M + H]+. Its 1H NMR spectrum (900 MHz), which was recorded in CD3OH, exhibited dispersed amide and aliphatic signals, indicative of a peptidic nature. Amino acid composition analysis showed that ASPE was composed of common amino acids and contained several disulfide bonds [(Asp + Asn) : (Glu + Gln ) : Gly : Thr : Pro : Tyr : Val : Cys : Ile : Leu : Phe = 3.0:4.0:3.7:0.9:6.0:1.0:0.8:3.0:2.8:0.9:1.0] (Table 1). To determine the number of disulfide bonds in ASPE, reduction and alkylation reactions (using dithiothreitol and iodoacetamide, respectively) were performed. However, the reduction was incomplete when we used the same reaction conditions used during our previous studies on asteropsins A–D,8,9 and several difficult to separate peaks were observed after further HPLC purification. We ultimately obtained a hexacarboxamidomethyl derivative (m/z 3909.5 [M + Na]+) after repeated purification and found that ASPE has three intramolecular disulfide bonds.
Table 1.
Amino Acid Composition Analysis of ASPE
| amino acid | mol (%) | residues/mol |
|---|---|---|
| Asp + Asn | 11.14 | 3.0 |
| Glu + Gln | 14.67 | 4.0 |
| Ser | NDa | |
| Gly | 13.72 | 3.7 |
| His | ND | |
| Arg | ND | |
| Thr | 3.40 | 0.9 |
| Ala | ND | |
| Pro | 22.10 | 6.0 |
| Tyr | 3.76 | 1.0 |
| Val | 3.08 | 0.8 |
| Met | ND | |
| Cys | 11.08 | 3.0 |
| Ile | 10.27 | 2.8 |
| Leu | 3.27 | 0.9 |
| Phe | 3.51 | 1.0 |
| Trp | ND | |
| Lys | ND |
ND: not detected.
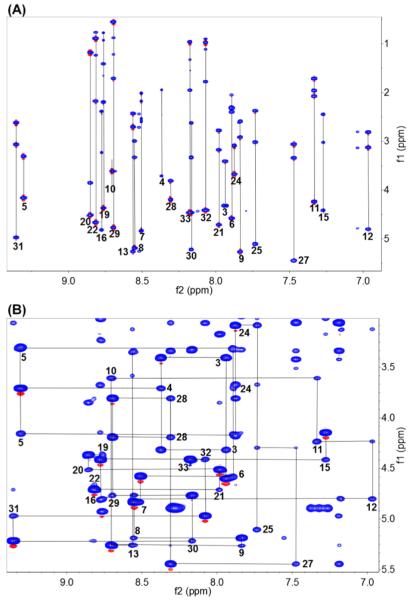
Due to the initial difficulty experienced obtaining the completely reduced and alkylated product, our first attempt at the sequence analysis of ASPE by traditional Edman degradation was unsuccessful. Therefore, NMR-based sequencing was used, and the sequence of ASPE was determined using a standard method for small proteins using high-resolution 2D NMR data (900 MHz) and SPARKY (a graphical NMR assignment and integration program for proteins, nucleic acids, and other polymers).11,12 Using a combination of DQF-COSY, TOCSY (80 ms), NOESY (100 and 300 ms), and HSQC, 33 1H spin systems were identified in the CαH-NH and CαH-CαH regions. These were then classified into 10 spin system classes corresponding to specific amino acid residues (Table 2). The results obtained showed that ASPE is composed of 33 amino acids. The CαH-NH region of its TOCSY spectrum revealed all intraresidue scalar connectivities (Figure 1A). In addition to the 33 major 1H spin systems, five more 1H spin systems were observed in the NH-NH region (δH 6.5–7.6 ppm). These were putatively attributed to side chain amide (Asn or Gln) or aromatic (Phe or Tyr) protons. Sequential NMR assignments were made to determine the locations of all residues using NOE correlations. Sequential dαN(i,i+1) connectivities in the CαH-NH fingerprint region of the NOESY spectrum are shown in Figure 1B. Due to the absence of a protonated amide group, proline locations were determined using the connectivities of dαα(i−1,i), dNα(i−1,i), dαδ(i−1,i), and dNδ(i−1,i) (i: proline residue) (Figures S7 and S8).11
Table 2.
1H Spin Systems and Sequential Assignments of ASPE Using DQF-COSY, TOCSY, NOESY, and HSQC Spectra (in CD3OH, 900 MHz)
| 1H spin systems | amino acids | residue no. |
|---|---|---|
| AX | Gly | 3, 5, 24, 28 |
| AMX | Asp, Asn, Cys, Ser | 1, 8, 9, 13, 15, 16, 21, 25, 30 |
| A3B3MX | Val | 10 |
| A3MX | Thr | 20 |
| A3B3MPTX | Leu | 19 |
| A3MPT(B3)X | Ile | 22, 29, 32, 33 |
| AM(PT)X | Glu, Gln | 4, 6, 7, 11 |
| A2(T2)MPX | Pro | 2, 14, 17, 18, 23, 26 |
| AMX + AMM′XX′ | Phe | 12 |
| AMX +AA′XX′ | Tyr | 27, 31 |
Figure 1.
(A) CαH-NH region of the TOCSY spectrum of ASPE (in CD3OH, mixing time = 80 ms, 900 MHz) showing intraresidue scalar connectivities. (B) Sequential dαN(i,i+1) connectivities in the CαH-NH fingerprint region of the NOESY spectrum (in CD3OH, mixing time = 300 ms, 900 MHz).
As shown in Table 2, the residues of AMX and AM(PT)X 1H spin systems required further classification. Although they shared the same spin system (AM(PT)X), Glu and Gln were easily distinguished because Gln has two amide protons (NεH) on its side chain, which show significant intraresidue NOE correlations with CαH, CβH, CγH, or NH. Thus, residue 7 was determined to be Gln, and residues 4, 6, and 11 were determined to be Glu. Differentiation of Asn from other AMX group residues (Asp, Cys, and Ser) was achieved using a similar method, and residue 13 was determined to be Asn. Ser can be identified using its CβH chemical shift values. Because they are affected by the side chain hydroxy group, CβH2 proton signals of Ser are much more downfield shifted (δH > 3.5 ppm) than those of other AMX group residues (δH < 3.5 ppm). By comparing CβH chemical shift values, ASPE was concluded to have no Ser, which was corroborated by amino acid composition analysis (Table 1). The identification of six Cys among the remaining eight AMX residues was achieved using long-range NOE correlations. Because ASPE contains three intramolecular disulfide bonds, notable CβH–CβH or CαH–CβH NOEs were expected between each pair of cysteines (dββ < 4.0 Å, 95.7% of cysteines form a pair; dββ < 5.0 Å, 88.8%).13 CβH–CβH NOEs were observed between the residues 8/21 and 15/30; and CαH–CβH NOEs were observed between the residues 1/16, indicative of three disulfide pairings (Cys1/Cys16, Cys8/Cys21, and Cys15/Cys30). Additional CαH–CβH NOEs of 1/15 and 15/16 inconsistent with the proposed disulfide patterns were also observed, but these possibilities were eliminated by further analysis of the possible disulfide arrangements using calculated structures without disulfide bond restraints (Table S1).14,15 Residues 9 and 25 did not show any NOEs between each other or with other AMX group residues and, thus, were determined to be Asp. Therefore, the full sequence of ASPE was determined to be CPGEGEQCDVEFNPCCPPLTCIPGDPYGICYII. The theoretical molecular weight (monoisotopic MW = 3538.5) of the ASPE sequence identified by 2D NMR was identical to that determined by MALDI-TOF MS (m/z 3539.5 [M + H]+). This sequence result was also consistent with the amino acid composition analysis (Table 1). Sequence alignments of ASPE versus reported asteropsins A–D are shown in Figure 2. 1H and 13C chemical shift values of ASPE are shown in the Supporting Information (Tables S2 and S3). The initial failure of Edman analysis was found to be due to the unexpected resistance of ASPE to dithiothreitol reduction, which leads to a mixture of partial reduction products that are difficult to separate. This chemical stability of ASPE as compared with asteropsins A–D could be due to its lack of a flexible N-terminal random coil (vide infra). Nevertheless, the complete reduction product eventually obtained was purified and sequenced by Edman degradation and yielded the same sequence as that obtained by NMR analysis.
Figure 2.
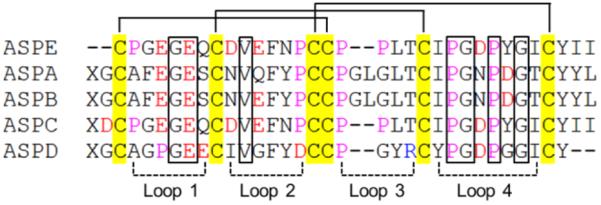
Sequence alignment of ASPE with asteropsins A–D (ASPA, ASPB, ASPC, and ASPD). The disulfide bonds are connected by solid lines. The loops indicate residues that compose polypeptide backbones between two Cys residues. Residues: red = acidic, yellow = Cys, purple = Pro. X = pyroglutamic acid. Conserved structure-maintaining residues are marked with boxes. Sequence alignment was performed using ClustalX 2.0 (BMBL-EBI).
Secondary Structure
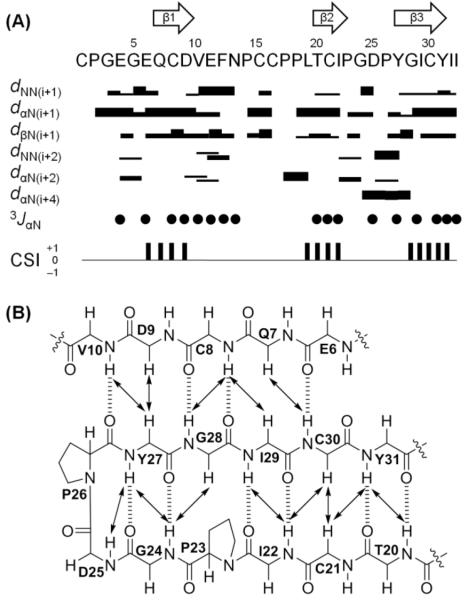
The secondary structure of ASPE was determined using a combination of NOE distance constraints, 3JαN values, and chemical shift indices16,17 and supported the assignment of three antiparallel β-sheets composed of Glu7-Asp9, Thr20-Pro23, and Tyr27-Tyr31 (Figure 3). Turns were identified using the characteristic distance connectivities of backbone protons together with a distance between Cα(i) and Cα(i + 3) of <7 Å.11,18 Types of β-turns were classified as described by Wilmot and Thornton.19 As a result, a short type I β-turn composed of Gly24 and Asp25 was identified. As was expected, the secondary structure of ASPE was consistent with that of previously isolated ASPC, with which ASPE shows high sequence identity (Figure 2).
Figure 3.
Secondary structural elements of ASPE. (A) Summary of sequential and medium-range NOE correlations (|i − j| < 5), 3JαN values, and chemical shift indices (CSI). NOE intensities are grouped into four classes (2.5, 3.0, 4.0, and 5.0 Å), which are represented by the thickness of solid lines, where thicker lines indicate stronger NOE correlations. Filled circles indicate positions where 3JαN values are >8 Hz. Consensus results of CSI values derived from CαH, Cα, and Cβ chemical shifts of ASPC are indicated by a ternary index with values of −1, 0, and +1. The arrows at the top of the figure indicate the positions of β-sheets as determined by combinations of strong sequential dαN, weak dNN, and large 3JαN values and a CSI value of +1 (downfield shift). (B) Long-range NOE correlations (|i − j| ≥ 5) and H-bonds of the triple-stranded antiparallel β-sheet region. NOE correlations and H-bonds are indicated by solid arrows and dashed lines, respectively.
The cis–trans conformations of the Pro residues of ASPE were defined using NOE constraints and Δβγ (δ [13Cβ] − δ [13Cγ]) chemical shift differences.11,20 If Δβγ is <4.8 ppm, the peptide bond conformation is determined to be trans, whereas if Δβγ is >9.15 ppm, the conformation is cis. In the range from 4.8 to 9.15 ppm, the prediction is ambiguous but resolved using NOE constraints. The trans form allows much closer distances between dαδ(i−1,i) and dNδ(i−1,i) (i: proline residue), whereas the cis form favors short distances between dαα(i−1,i) and dNα(i−1,i). The Δβγ values of Pro2, Pro14, Pro17, Pro18, Pro23, and Pro26 were 4.6, 5.2, 3.0, 7.2, 8.7, and 11.2 ppm, respectively. In the NOESY spectrum, significant NOEs of dαδ(1,2), dαδ(13,14), dαδ(16,17), dαα(22,23), and dαα(25,26) were observed, which strongly suggested trans configurations for Pro2, Pro14, and Pro17 and cis configurations for Pro23 and Pro26 (Figure S8). Pro18 had an ambiguous Δβγ value (7.2 ppm) and no corresponding NOEs, but its conformation was predicted to be trans based on its 13Cβ chemical shift of 28.7 ppm, which was much more upfield than the expected minimum 13Cβ value of cis-proline (30.7 ppm).20 Furthermore, structure calculation results supported trans-Pro18 due to its lower energy than the cis conformation. ASPE has two highly conserved cis prolines (Pro23 and Pro26) located at the end of the second and before the third β-strands, respectively. This conservatism was also observed in our previous study of asteropsins A–D and is characteristic of sponge-derived asteropsin peptides.8,9
Tertiary Solution Structure
The tertiary structure of ASPE was initially calculated by CYANA 2.121 using distance, dihedral angle, and H-bond constraints and further refined by simulated annealing within CNS 1.3.22 Twenty structures with the lowest energies and no residual restraint violations were selected to represent the solution structure of ASPE (Figure 4). Structure qualities were validated using the PSVS server (http://psvs-1_4-dev.nesg.org/);23 statistics are provided in Table 3. The Ramachandran plot for ASPE obtained using Richardson Lab’s Molprobity (integrated in PSVS) showed 93.7% in the most favored region, with 6.3% in the allowed region. The root-mean-square-deviations (RMSDs) of backbone and heavy atoms (residues 1–33) were 0.16 and 0.59 Å, respectively.
Figure 4.
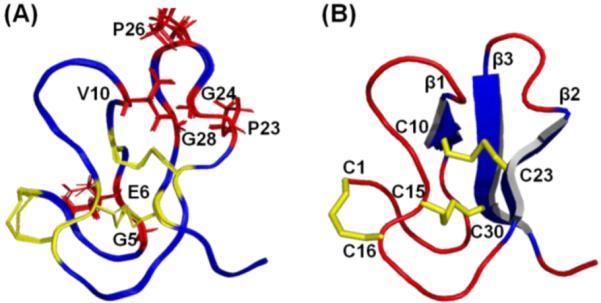
Solution structure of ASPE. (A) Overlapped images of the 20 lowest-energy NMR structures. The seven conserved structure-maintaining residues are labeled and colored red, and their side chains are represented by sticks. The six Cys residues and three disulfide bonds are colored yellow. The root-mean-square-deviations of backbone and heavy atoms (residues 1–33) were 0.16 and 0.59 Å, respectively. (B) Solution structure of ASPE with the lowest energy [PDB ID: 2M3J]. The three disulfide bonds and three β-sheets are colored yellow and blue, respectively. The six Cys residues are also labeled. The figure was drawn using PYMOL.
Table 3.
Structural Statistics for the 20 Lowest-Energy Solution Structures of ASPE As Validated by PSVS (the Protein Structure Validation Suite)
| Experimental constraints | |
|---|---|
| total NOE | 517 |
| intraresidue [i = j] | 101 |
| sequential [|i − j| = 1] | 187 |
| medium range [1 < |i − j| < 5] | 63 |
| long range [|i − j| ≥ 5] | 166 |
| dihedral angles | 17 |
| hydrogen bonds | 15 |
| Violations | |
| distance (>0.1 Å) | 0 |
| dihedral angle (>1°) | 0 |
| van der Waals (<1.6 Å) | 0 |
| RMSD from idealized geometrya | |
| bond lengths (Å) | 0.011 |
| bond angles (deg) | 0.8 |
| RMS of distance violation (Å) | 0.01 |
| RMS of dihedral angle violation (deg) | 0.1 |
| Average pairwise RMSD values (Å)a | |
| all backbone atoms | 0.16 |
| all heavy atoms | 0.59 |
| Ramachandran plot statistics from Richardson’s lab (%) | |
| most favored regions | 93.7 |
| allowed regions | 6.3 |
| disallowed regions | 0 |
RMSD values were given as the mean value.
The antiparallel β-sheets of ASPE are supported by two (Cys15/Cys30 and Cys8/Cys21) central disulfide bridges; the third disulfide bridge (Cys1/Cys16) lies closer to the surface at the N-terminus. Similar to asteropsins A–D, ASPE possesses a conserved sequence pattern {−CI−GIEII(−CII−)β1VIII−CIIICIV−(−CV−PIV)β2GV−PVI(−GVII−CVI−)β3−}. The first β-sheet is always located between GlyI-GluII and ValIII, the second β-sheet ends with a cis-ProIV followed by GlyV, and the third β-sheet always starts after another cis-ProVI and contains a conserved GlyVII (Figure 5A). Accordingly, ASPE has a tertiary structure that is similar to those of asteropsins A–D (backbone RMSD < 1.2 Å) (Figure 5B). We propose the six disulfide-cross-linked Cys, together with the seven highly conserved residues, are responsible for the structural maintenance of the asteropsins and that the residues in other locations may contribute to biological activities.9 With the exception of the N-terminal post-translational modification, ASPE shares properties with the other asteropsins, such as the absence of basic residues, a highly acidic nature, conserved structurally important residues (including two cis-prolines), and a highly conserved tertiary structural framework. Thus, ASPE was determined to be a new member of the asteropsin peptide family.
Figure 5.
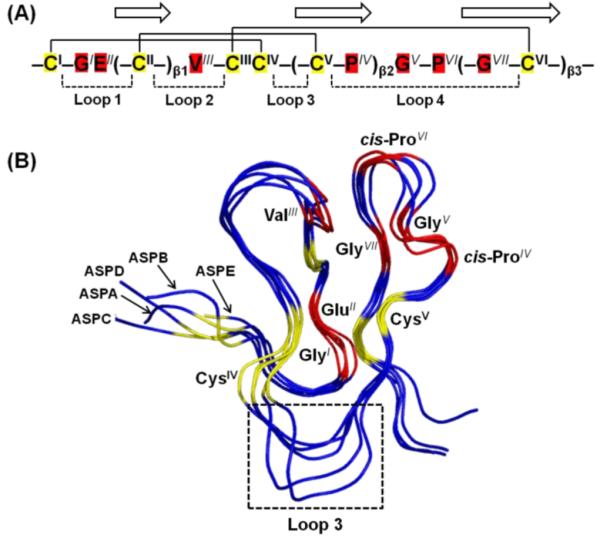
(A) Conserved structure-maintaining sequence pattern of asteropsins A–E. Residues with a superscript represent conserved residues. The three disulfide bonds are connected by solid lines, and the three β-strands are indicated by arrows. The loops indicate residues composing the polypeptide backbones between two Cys residues. (B) Structure alignments of asteropsins A−E. The six Cys residues and seven conserved structure-maintaining residues are labeled and colored yellow and red, respectively. The flexible loop 3 region is boxed. The backbone RMSDs of ASPE in comparison with asteropsins A–D were 0.98, 1.04, 0.68, and 1.17, respectively. The figure was drawn using PYMOL.
Enzymatic Stability and Cytotoxicity
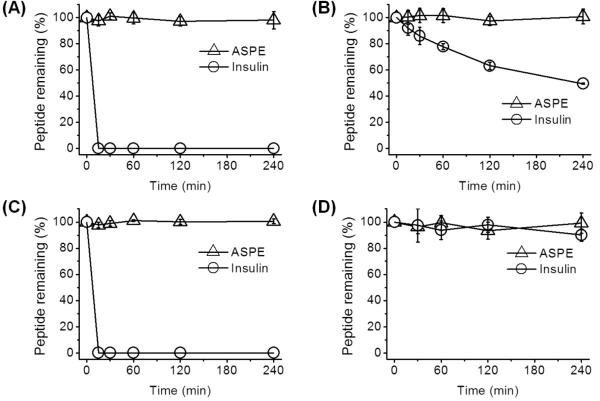
Its lack of basic residues makes ASPE inherently stable to trypsin, which provides advantages for oral administration as compared with other linear knottin subfamilies. Considering the potential applications of ASPE as an oral drug delivery agent,3,4 we evaluated its stability against chymotrypsin, elastase, and pepsin. Enzymatic degradation studies were performed at concentrations found in human intestinal fluid.24 Insulin was used as a standard to estimate enzyme activities. ASPE was found to be almost 100% stable toward chymotrypsin, elastase, and pepsin for up to 4 h, while insulin was completely degraded in less than 5 min by chymotrypsin and pepsin and more than 50% degraded by elastase within 4 h (Figure 6A–C). In addition, ASPE showed remarkable stability (~100%) in human plasma for up to 4 h (Figure 6D). Furthermore, cytotoxicity assays showed that ASPE was nontoxic to human normal cells (HK-2, human kidney proximal tubular epithelial cells; MCF-10A, human fibrocystic mammary epithelial cells) (Figure 7).
Figure 6.
Stabilities of ASPE (Δ) to enzymatic degradation by (A) chymotrypsin, (B) elastase, or (C) pepsin, and its stability in (D) human plasma. Insulin (○) was used as a standard substrate. Points represent the means ± SDs of three experiments.
Figure 7.
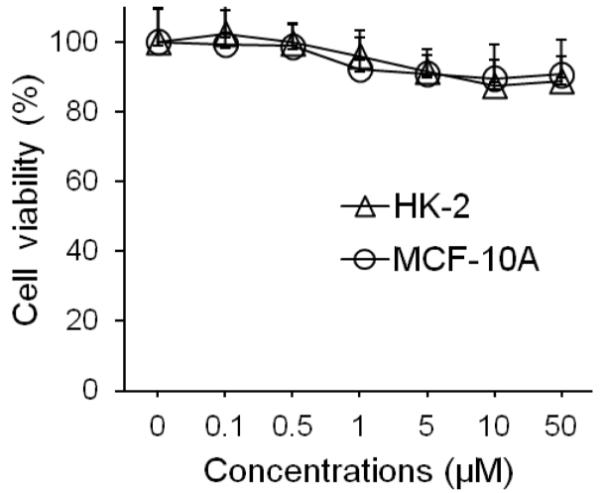
Cytotoxicity assay of ASPE. ASPE was found to be nontoxic to both HK-2 (Δ, a human normal kidney proximal tubular epithelial cell line) and MCF-10A (○, a human fibrocystic mammary tissue epithelial cell line) cells treated at concentrations up to 50 μM for 48 h. Viabilities were determined using an MTT assay.
Knottin family peptides are considered as emerging scaffolds for the in vivo application of peptide-based drugs. However, only cyclotides have been popularly utilized in drug design and peptide engineering for oral administration because the gastrointestinal stabilities of linear knottins are much lower.3-7 Asteropsins are the only linear knottin subfamily that has been found to resist proteolysis by chymotrypsin, elastase, pepsin, and trypsin.9 Furthermore, asteropsins do not require subsequent cyclization,25 which means that their synthesis is substantially easier than that of cyclotides. Unlike asteropsins A–D, ASPE lacks the modified N-terminal pGlu, but this does not adversely affect its conserved tertiary structural framework or its stability to enzymes in the gastrointestinal tract or human plasma. We believe that these findings provide important information regarding the straight-forward recombinant synthesis of orally effective asteropsin derivatives by peptide engineering.
Here, we describe an unusual knottin, ASPE, obtained from the marine sponge Asteropus sp. The primary, secondary, and tertiary structures of ASPE were independently determined by high-resolution 2D NMR spectroscopy in a manner that provides a useful example of the structure elucidation of peptides inaccessible using the traditional Edman degradation method. ASPE was found to be remarkably stable to enzymes of the gastrointestinal tract (chymotrypsin, elastase, pepsin, and trypsin) and in human plasma. Furthermore, ASPE had no measurable cytotoxic effect on human normal cells. Thus, we suggest that ASPE could be utilized as a stable scaffold during oral peptide drug development.
EXPERIMENTAL SECTION
General Experimental Procedures
The NMR spectra were recorded at 900 MHz using a Bruker BioSpin GmbH spectrometer. Chemical shifts were reported with reference to the respective solvent peaks and residual solvent peaks (δH 3.30 and δC 49.0 for CD3OH). MALDI-TOF MS data were obtained using an Applied Biosystems 4700 proteomics analyzer. HPLC was performed on a Gilson 321 pump equipped with a Gilson UV–vis 155 detector. The gastro-intestinal enzymes (chymotrypsin, elastase, and pepsin) and human plasma used in the stability assay were purchased from Sigma Aldrich Chemical Co.
Animal Material and Peptide purification
The marine sponge Asteropus sp. (2.4 kg, wet weight) was collected by hand using scuba (20 m depth) in 2006 of the coast of Geoje Island (Korea) and stored at −20 °C until used. The specimen (sample no. J06B-2) was identified as Asteropus species by C. J. Sim, Hannam University. It has a ball-like shape or appears as several joined mounds and spheres with an overall irregular shape, commonly up to 10–15 cm in diameter. The surface has a slightly rough texture with orange to orange-red color. The inner tissues are dark gray. A voucher specimen of the sponge was deposited at the Natural History Museum, Hannam University, Daejon, Korea.
The frozen sponge (2.4 kg, wet weight) was extracted with MeOH at room temperature (rt), and the extract (166 g) was partitioned between H2O and CH2Cl2 (1:1, v/v). The aqueous layer was further partitioned with BuOH and water (1:1, v/v), and the organic layer (5.1 g) was subjected to step-gradient MPLC (ODS-A, 120 Å, S-30/50 mesh) using 20–100% MeOH as eluent. ASPE (9.5 mg) was purified by reversed-phase HPLC equipped with a UV detector (YMC ODS-H80 column 250 mm × 10 mm, i.d. 4 μm, 80 Å; wavelength 220 nm) using 62% MeOH + 0.1% TFA as eluent at a flow rate of 1 mL/min.
Reduction and Alkylation of the Peptide
A portion of ASPE (100 μg) was dissolved in 100 μL of denaturation buffer (7 M guanidine hydrochloride in 0.4 M Tris-acetate-EDTA buffer, pH 8.3), 20 μL of 45 mM dithiothreitol (DTT) was added and incubated at 60 °C for 90 min, and then iodoacetamide (40 μL, 100 mM) was added and incubated at rt for 45 min. The reaction mixture was purified by reversed-phase HPLC using a UV detector (YMC ODS column 250 mm × 4.6 mm, i.d. 5 μm; wavelength 220 nm) and a linear gradient (30–80% solvent B; solvent A: H2O + 0.1% TFA, solvent B: 90% ACN + 0.1% TFA) to afford a hexacarboxamidomethyl derivative (m/z 3909.5 [M + Na]+), which indicated the presence of three intramolecular disulfide bonds.
MALDI-TOF MS Determination
ASPE (0.1 mg) was dissolved in DMSO and further diluted 10-fold using an α-cyano-4-hydroxycinnamic acid matrix solution (7 mg/mL in 50% ACN, 0.1% TFA). Sample/matrix solution (1 μL) was then spotted onto a MALDI plate and inserted in the instrument (Applied Biosystems 4700 proteomics analyzer).
Amino Acid Composition Analysis
ASPE (0.1 mg) was dissolved in 200 μL of 6 N HCl and hydrolyzed at 110 °C for 24 h, and the HCl was completely removed using a vacuum dryer. The tryptophan residue was sought, but was not detected, by digesting the peptide sample with 20 mL of 4 M methanesulfonic acid. PITC-derivatized free amino acids were prepared and applied to a Pico-Tag Free Amino Acid Analysis column (Waters Nova-Pak C18, 300 mm × 39 mm, i.d. 4 μm; wavelength 254 nm) attached to an HP 1100 HPLC system. Amino acid composition analysis was performed at KBSI (Korea Basic Science Institute, Seoul).
NMR Spectroscopy
ASPE was dissolved in Cd3OH (Sigma Aldrich Chemical Co.), degassed, and topped with argon to minimize H2O absorption. Residual hydroxy signal suppression was achieved using standard presaturation methods. Standard experimental parameters were used for TOCSY (mixing time = 80 ms), NOESY (mixing time = 100 and 300 ms), DQF-COSY, and HSQC acquisitions using a Bruker 900 MHz at 298 K using the internal lock signal as a reference. Processing and chemical shift analysis were conducted using SPARKY (ver. 3.114, UCSF)12 and spectra image rendering using MestReNova (ver. 6.2.0, MestreLab Research S.L.). NMR (900 MHz) measurements were performed at KBSI.
Structure Calculations
Interproton distance constraints of ASPE were obtained from 100 and 300 ms mixing time NOESY spectra recorded in Cd3OH. DQF-COSY, TOCSY, NOESY, and HSQC spectra were analyzed using SPARKY.12 Cross-peaks were categorized into four classes by peak intensity (2.5, 3.0, 4.0, and 5.0 Å), which corresponded to strong, medium, weak, and very weak correlations, respectively. Pseudoatoms were applied for methyl, nonstereospecifically assigned methylene, and aromatic protons using a standard method.11 Dihedral angle constraints were generated from 3JαN values > 8.0 Hz in DQF-COSY spectra. Hydrogen bond restraints were identified using long-range NOE correlations. Chemical shift indices were used to determine the secondary structure.16,17
Solution structure calculations were initially performed using CYANA 2.121 and distance, dihedral angle, and hydrogen bond constraints and were further refined by simulated annealing within CNS 1.3.22 A final set of 200 structures was calculated using CNS 1.3, and the 20 structures with lowest energies and no residual restraint violations were used to represent the solution structure of ASPE. The calculated three-dimensional structures were then analyzed using PYMOL.26 Structure qualities were validated using the PSVS (protein structure validation software suite) server (http://psvs-1_4-dev.nesg.org/).23 The solution structure of ASPE has been deposited in the RCSB Protein Data Bank (2M3J).
Enzymatic Degradation by Chymotrypsin, Elastase, and Pepsin
Enzymatic degradation studies by chymotrypsin and elastase were performed using concentrations in the range present in human intestinal fluid.24 ASPE (100 μL; 1 mg/mL in 100 mM Tris-HCl buffer, pH 7.6) was added to 200 μL of chymotrypsin (0.76 mg/mL in 100 mM Tris-HCl buffer containing 10 mM CaCl2, pH 7.6) or elastase (0.0625 mg/mL in 100 mM Tris-HCl buffer containing 1% KCl, pH 7.6). For pepsin degradation, the peptide sample was prepared in 0.08 M HCl (pH adjusted to 2 with 1 M NaOH) containing 30% MeOH. The peptide solution (100 μL; 1 mg/mL) was added to 200 μL of pepsin (2.4 mg/mL in 0.08 M HCl, pH 2). Peptide–enzyme solutions were incubated at 37 °C and shaken (160 rpm) during the sampling period. At predetermined times (0, 15, 30, 60, 120, and 240 min), aliquots (40 μL) were withdrawn and the enzymatic reaction was stopped immediately by adding 0.1% TFA (40 μL) to the intestinal protease solutions or by adding 0.1 M NaOH (40 μL) to the pepsin solution. Insulin (1 mg/mL, prepared in 0.1 M NaHCO3 for intestinal proteases and in 0.08 M HCl for pepsin) was used as a standard to estimate enzyme activities. Reaction mixtures were analyzed by reversed-phase HPLC using a UV detector (YMC ODS column 250 mm × 4.6 mm, i.d. 5 μm; wavelength 220 nm) at a flow rate of 0.5 mL/min by linear gradient elution (30–80% solvent B; solvent A: H2O + 0.1% TFA, solvent B: 90% ACN + 0.1% TFA).
Plasma Stability
To 400 μL of human plasma was added 100 μL of ASPE (1 mg/mL in 100 mM Tris-HCl buffer, pH 7.6). The ASPE− plasma solution was then incubated at 37 °C with shaking (160 rpm) during the sampling period. At difierent times (0, 30, 60, 120, and 240 min), reaction samples (50 μL) were removed and quenched by adding MeOH (50 μL). The precipitates so obtained were removed by centrifuging at 13 500 rpm for 20 min. Supernatants were analyzed by reversed-phase HPLC using a UV detector (YMC ODS column 250 mm × 4.6 mm, i.d. 5 μm; wavelength 220 nm) at a flow rate of 0.5 mL/min using a linear gradient (30–80% solvent B; solvent A: H2O + 0.1% TFA, solvent B: 90% ACN + 0.1% TFA).
Cell Cultures
HK-2 cells (human normal kidney proximal tubular epithelial cells) obtained from the American Type Culture Collection were cultured in keratinocyte-SFM medium (Gibco) supplemented with 0.05 mg/mL bovine pituitary extract (Gibco) and 5 ng/mL human recombinant epidermal growth factor (Gibco). MCF10A cells (spontaneously immortalized cells derived from diploid primary human breast epithelial cells without viral or chemical intervention) were kindly provided by Dr. A. Moon (Duksung Women’s University, Seoul). MCF10A cells were cultured in Dulbecco’s modified Eagle’s medium (DMEM)/F12 supplemented with 5% horse serum, 0.5 g/mL hydrocortisone, 10 g/mL insulin, 20 ng/mL epidermal growth factor, 0.1 g/mL cholera enterotoxin, 100 units/mL penicillin–streptomycin, 2.5 mM l-glutamine, and 0.5 g/mL fungizone. Cultures were maintained in a humidified incubator with a 5% CO2/95% air atmosphere at 37 °C and fed with fresh medium at 48 h intervals. Experiments were performed with cells grown to 70–80% confluence. Cytotoxicity Assay. Cell viabilities were determined using a 3-(4,5-dimethylthiazol-2-yl)-2,5-diphenyltetrazolium bromide (MTT) assay. The MTT assay relies primarily on the mitochondrial metabolic capacity of viable cells and reflects intracellular redox state. According to this method, viable cells reduce a yellow tetrazolium salt (MTT) to purple formazan. HK-2 and MCF10A cells were cultured in 96-well plates at a density of 2 × 10³ cells per well for 48 h and then treated with ASPE at various concentrations. An MTT solution (5 mg/mL, 20 μL/well) was then added and incubated at 37 °C for 4 h, and the formazan crystals so obtained were dissolved in DMSO. Ratios of viable cells to dead/necrotic/apoptotic cells were determined by measuring absorbance at 540 nm using a VERSA Max microplate reader (Molecular Devices Corp.).
Supplementary Material
ACKNOWLEDGMENTS
This study was supported by Basic Science Research Program of the National Research Foundation of Korea (NRF) funded by the Korean Ministry of Education, Science, and Technology (grant no. 2012043039).
Footnotes
Supporting Information
1H, DQF-COSY, TOCSY, NOESY, and HSQC NMR spectra (Figures S1–S5); MALDI-TOF MS spectrum (Figure S6); intraresidue and the dαα(i−1,i) and dαδ(i−1,i connectivities of the Pro residues (Figures S7 and S8); a picture of the marine sponge Asteropus sp. (Figure S9); analysis of possible disulfide bonding patterns (Table S1); and 1H and 13C chemical shifts (Tables S2 and S3). This material is available free of charge via the Internet at http://pubs.acs.org.
Accession Codes
The solution structure of ASPE and related files have been deposited in the RCSB PDB (Protein Data Bank) and BMRB (Biological Magnetic Resonance Bank) as accession numbers 2M3J and 18965, respectively.
Notes
The authors declare no competing financial interest.
REFERENCES
- 1.Pichereau C, Allary C. Eur. BioPharm. Rev. 2005:88–91. Winter. [Google Scholar]
- 2.Kolmar H. Curr. Opin. Pharmacol. 2009;9:608–614. doi: 10.1016/j.coph.2009.05.004. [DOI] [PubMed] [Google Scholar]
- 3.Getz JA, Rice JJ, Daugherty PS. ACS Chem. Biol. 2011;6:837–844. doi: 10.1021/cb200039s. [DOI] [PMC free article] [PubMed] [Google Scholar]
- 4.Wong CT, Rowlands DK, Wong CH, Lo TW, Nguyen GK, Li HY, Tam JP. Angew. Chem., Int. Ed. 2012;51:5620–5624. doi: 10.1002/anie.201200984. [DOI] [PubMed] [Google Scholar]
- 5.Werle M, Schmitz T, Huang HL, Wentzel A, Kolmar H, Bernkop-Schnürch A. J. Drug Target. 2006;14:137–146. doi: 10.1080/10611860600648254. [DOI] [PubMed] [Google Scholar]
- 6.Werle M, Kafedjiiski K, Kolmar H, Bernkop-Schnürch A. Int.J. Pharm. 2007;332:72–79. doi: 10.1016/j.ijpharm.2006.09.028. [DOI] [PubMed] [Google Scholar]
- 7.Werle M, Kolmar H, Albrecht R, Bernkop-Schnürch A. Amino Acids. 2008;35:195–200. doi: 10.1007/s00726-007-0569-1. [DOI] [PubMed] [Google Scholar]
- 8.Li H, Bowling JJ, Fronczek FR, Hong J, Jabba SV, Murray TF, Ha NC, Hamann MT, Jung JH. Biochim. Biophys. Acta. 2013;1830:2591–2599. doi: 10.1016/j.bbagen.2012.11.015. [DOI] [PMC free article] [PubMed] [Google Scholar]
- 9.Li H, Bowling JJ, Su M, Hong J, Lee BJ, Hamann MT, Jung JH. Biochim. Biophys. Acta. 2014;1840:977–984. doi: 10.1016/j.bbagen.2013.11.001. [DOI] [PMC free article] [PubMed] [Google Scholar]
- 10.Takada K, Hamada T, Hirota H, Nakao Y, Matsunaga S, van Soest RWM, Fusetani N. Chem. Biol. 2006;13:569–574. doi: 10.1016/j.chembiol.2006.05.010. [DOI] [PubMed] [Google Scholar]
- 11.Wüthrich K. NMR of Proteins and Nucleic Acids. J. Wiley; New York: 1986. [Google Scholar]
- 12.Goddard TD, Kneller DG. SPARKY 3. University of California; San Francisco, CA; http://www.cgl.ucsf.edu/home/sparky/ [Google Scholar]
- 13.Klaus W, Broger C, Gerber P, Senn H. J. Mol. Biol. 1993;232:897–906. doi: 10.1006/jmbi.1993.1438. [DOI] [PubMed] [Google Scholar]
- 14.Hill JM, Alewood PF, Craik DJ. Biochemistry. 1996;35:8824–8835. doi: 10.1021/bi960073o. [DOI] [PubMed] [Google Scholar]
- 15.Chan LY, Wang CK, Major JM, Greenwood KP, Lewis RJ, Craik DJ, Daly NL. J. Nat. Prod. 2009;72:1453–1458. doi: 10.1021/np900174n. [DOI] [PubMed] [Google Scholar]
- 16.Wishart DS, Sykes BD, Richards FM. Biochemistry. 1992;31:1647–1651. doi: 10.1021/bi00121a010. [DOI] [PubMed] [Google Scholar]
- 17.Wishart DS, Sykes BD. J. Biomol. NMR. 1994;4:171–180. doi: 10.1007/BF00175245. [DOI] [PubMed] [Google Scholar]
- 18.Lewis PN, Momany FA, Scheraga HA. Biochim. Biophys. Acta. 1973;303:211–229. doi: 10.1016/0005-2795(73)90350-4. [DOI] [PubMed] [Google Scholar]
- 19.Wilmot CM, Thornton JM. Protein Eng. 1990;3:479–493. doi: 10.1093/protein/3.6.479. [DOI] [PubMed] [Google Scholar]
- 20.Schubert M, Labudde D, Oschkinat H, Schmieder P. J. Biomol. NMR. 2002;24:149–154. doi: 10.1023/a:1020997118364. [DOI] [PubMed] [Google Scholar]
- 21.Guntert P. Methods Mol. Biol. 2004;278:353–378. doi: 10.1385/1-59259-809-9:353. [DOI] [PubMed] [Google Scholar]
- 22.Brünger AT, Adams PD, Clore GM, DeLano WL, Gros P, Grosse-Kunstleve RW, Jiang JS, Kuszewski J, Nilges M, Pannu NS, Read RJ, Rice LM, Simonson T, Warren GL. Acta Crystallogr. D: Biol. Crystallogr. 1998;54:905–921. doi: 10.1107/s0907444998003254. [DOI] [PubMed] [Google Scholar]
- 23.Bhattacharya A, Tejero R, Montelione GT. Proteins. 2007;66:778–795. doi: 10.1002/prot.21165. [DOI] [PubMed] [Google Scholar]
- 24.Bernkop-Schnürch A. J. Controlled Release. 1998;52:1–16. doi: 10.1016/s0168-3659(97)00204-6. [DOI] [PubMed] [Google Scholar]
- 25.Clark RJ, Fischer H, Dempster L, Daly NL, Rosengren KJ, Nevin ST, Meunier FA, Adams DJ, Craik DJ. Proc. Natl. Acad. Sci. U.S.A. 2005;102:13767–13772. doi: 10.1073/pnas.0504613102. [DOI] [PMC free article] [PubMed] [Google Scholar]
- 26.The PyMOL Molecular Graphics System. 2010. version 1.3. Schrödinger, LLC.
Associated Data
This section collects any data citations, data availability statements, or supplementary materials included in this article.


