Abstract
Purpose
The aim of this study was to compare the ability of 18F-FDG PET and iron contrast-enhanced MRI with a novel USPIO (P904) to assess change in plaque inflammation induced by atorvastatin and dietary change in a rabbit model of atherosclerosis using a combined PET/MR scanner.
Materials and methods
Atherosclerotic rabbits underwent USPIO-enhanced MRI and 18F-FDG PET in PET/ MR hybrid system at baseline and were then randomly divided into a progression group (high cholesterol diet) and a regression group (chow diet and atorvastatin). Each group was scanned again 6 months after baseline imaging. R2* (i.e. 1/T2*) values were calculated pre/post P904 injection. 18F-FDG PET data were analyzed by averaging the mean Standard Uptake Value (SUVmean) over the abdominal aorta. The in vivo imaging was then correlated with matched histological sections stained for macrophages.
Results
18F-FDG PET showed strong FDG uptake in the abdominal aorta and P904 injection revealed an increase in R2* values in the aortic wall at baseline. At 6 months, SUVmean values measured in the regression group showed a significant decrease from baseline (p =0.015). In comparison, progression group values remained constant (p =0.681). R2* values showed a similar decreasing trend in the regression group suggesting less USPIO uptake in the aortic wall. Correlations between SUVmean or Change in R2* value and macrophages density (RAM-11 staining) were good (R2 =0.778 and 0.707 respectively).
Conclusion
This experimental study confirms the possibility to combine two functional imaging modalities to assess changes in the inflammation of atherosclerotic plaques. 18F-FDG-PET seems to be more sensitive than USPIO P904 to detect early changes in plaque inflammation.
Keywords: Inflammation Imaging, MRI, PET, Animal experimentations Statin
1. Introduction
Rupture of atherosclerotic plaques may trigger the onset of clinical events such as myocardial infarction or ischemic stroke. Macrophages are inflammatory cells that have been shown to play a critical role in plaque formation and contribute to plaque instability and rupture [1]. Inflammation exerts detrimental effects by degrading the fibrous cap, increasing apoptosis of the resident smooth muscle cells and increasing neovascularization in the plaque. The beneficial effects of several therapeutics, such as statins, on plaque inflammation have been previously established both in clinical and preclinical settings [2,3]. Therefore, there is increasing interest in the development of non-invasive imaging techniques to visualize macrophage burden, and to monitor plaque activity as well as the efficacy of therapeutic interventions. 18F-Fluorodeoxyglucose positron emission tomography (18F-FDG-PET), used in combination with computed tomography (CT) or magnetic resonance imaging (MRI), and iron contrast-enhanced MRI with ultra small super paramagnetic iron oxides (USPIOs) are two established methods that have been used to visualize the inflammation/macrophage burden in both preclinical and clinical settings [4,5].
The aim of this study was to compare the ability of 18F-FDG PET and iron contrast-enhanced MRI with a novel USPIO (P904) to assess change in plaque inflammation induced by atorvastatin and dietary change in a rabbit model of atherosclerosis.
2. Methods
2.1. Animal protocol
The Mount Sinai Institute of Animal Care and Use Committee approved all experiments.
Atherosclerotic lesions were induced in the aorta of New Zealand White rabbits (n =14; mean age 3 months; mean body weight, 3.0–4.0 kg; Covance, Princeton, NJ) by combination of high cholesterol diet and aortic denudation. Aortic injury was induced under general anesthesia by an intramuscular injection of ketamine (20 mg/kg; Fort Dodge Animal Health, Overland Park, KS) and xylazine (5 mg/kg; Bayer, Shawnee Mission, KS) with a 4F Fogarty embolectomy catheter from the aortic arch to the iliac bifurcation. Procedure was performed 2 weeks after starting the high cholesterol diet and repeated 4 weeks later.
Rabbits were fed a high-cholesterol diet (Purina rabbit chow, 0.3% cholesterol; Research Diets, New Brunswick, NJ) for a minimum of 4 months and subsequently were randomly divided into 2 groups. The first group (progression, n =7) was fed a 0.15% cholesterol diet and the second group (regression, n =7) was fed a chow diet + 3 mg atorvastatin/kg for a total duration of 6 months. At 6 months after randomization, animals were euthanized for validation studies (i.e histology described below) and for a separate analysis of end points.
2.2. Contrast agent P904
P904 (γ-Fe2O3) is an ultra small paramagnetic iron oxide particle developed by Guerbet (Paris, France). The relaxivities measured in water at 1.42 T and 37 °C were r1 =14 mM−1 s−1 and r2 =87 mM−1 s−1 with a mean hydrated particle diameter of 21 nm. The agent is supplied in suspension at a concentration of 11.9 mg of iron per milliliter. Its plasma half-life in hyperlipidemic rabbits is 3.5 h for a dose of 1000 μmolFe/kg [6]. The injection dose was 50 μmolFe/kg and was performed through a catheter placed in the marginal ear-vein.
2.3. MRI and PET-MRI acquisition
All animals underwent USPIO contrast enhanced MRI with P904 and FDG-PET/MRI at baseline and 6 months after randomization. Imaging was performed under general anesthesia. Rabbits were immobilized with a body-fitting thermosetting plastic holder compatible with both the MRI and PET scanning systems to assure the exact same positioning for both imaging studies.
2.3.1. MR protocol
MR Imaging was performed using a 3T MRI clinical system (Philips 3T Achieva, Philips Healthcare Systems, Best, The Netherlands) using a knee coil for signal reception. The imaging protocol included MRI of the abdominal aorta prior and 24 h after injection of P904, both at baseline and 6 months after randomization. For each imaging time-point, after conventional gradient echo scouts, 2D-time of fiight imaging was performed to better localize the aorta. We applied a gradient echo T2*-weighted sequence for USPIO detection throughout the abdominal aorta with TR =150 ms and with 16 echo times ranging from 4.8 ms to 38.5 ms (30 slices, 3 mm thickness).
2.3.2. PET protocol
18F-FDG PET/MRI was performed 24 h after injection of P904, 3 h after injection of 18F-FDG (1 mCi/kg) using the Philips Ingenuity TF sequential whole-body MR/PET system (Philips Healthcare, Cleveland, OH), which combines the Philips GEMINI TF PET camera and the Philips Achieva 3T X-Series MRI system with a rotating bed that allows accurately registered sequential acquisition of MR and PET images, similar to the standard PET/CT workflow. During PET acquisition the knee coil was removed to avoid attenuation caused by MR coils. PET images were acquired in 3D mode, using time of fiight (TOF) information standard with the GEMINI TF system. Images were reconstructed into a 128 × 128 × 90 matrix with 2 × 2 × 2 mm voxel size, using a 3D RAMLA reconstruction algorithm, with corrections for normalization, dead time, attenuation, scatter, random coincidences, sensitivity and decay.
2.4. Image analysis
2.4.1. MRI USPIO uptake analysis
Pre- and post-USPIO MRI images were manually co-registered according to plaque morphology and distance from the renal arteries. Inner and outer vessel wall contours were delineated manually on T2* weighted sequences. An adjustment by translation and rotation of the ROIs was performed when necessary. T2* maps were generated (Matlab, MathWorks, Natick, MA) in the aortic wall and R2* values (1/T2*) were calculated pre and post P904 injection and averaged in the vessel wall over the entire abdominal aorta. The relative percentage change in the R2* values between pre and post P904 injection were determined as: % change = ([R2*post –R2*pre]/ R2*post) × 100.
2.4.2. FDG uptake analysis
The attenuation correction method implemented on the Philips whole-body PET/MR system is provided by performing a T1-weighted sequence to match the PET dimensions, allowing for anatomical detail and attenuation correction in a similar fashion to a low-dose CT image in a standard PET/CT acquisition. The segmentation algorithm to produce the MR attenuation map, in the case of animal imaging, consists of a 2-segment classification between air and soft tissue (Appendix 1). This method provides a body contour segmentation image of the animal with the interior of the animal assigned a pre-determined soft-tissue attenuation co-efficient value (0.095 cm−1) and air attenuation coefficient value (0 cm−1). An attenuation template of the patient table was included into the final attenuation map during reconstruction, as is standard on the system. The novel bed in the sequential MR/PET system minimized movement between MR and PET acquisitions to ensure co-registration and thus anatomical structures identified by MRI could be correlated with the FDG uptake. FDG-PET/MRI data were analyzed by measuring mean Standardized Uptake Value (SUVmean) in the aortic wall by placing ROIs on axial cross sections of the abdominal aorta and averaging the values for total of 25 consecutive axial slices, beginning from the renal arteries for both progression and regression groups at baseline and 6 months. SUVmean was then averaged over the total number of slices for each group and each imaging time point.
2.5. Histopathology analysis
After the animals were sacrificed, the abdominal aorta was resected and sectioned into 3 mm segments. Specimens were fixed in formalin and embedded in paraffin for histologic analysis. Perls’ stain was used to determine the presence of iron particles, and RAM-11 monoclonal antibody (Dako, Trappes, France) was used to label the macrophages and determine the percentage of total vessel wall area occupied by macrophages.
2.6. Statistical analysis
Results are expressed as mean ± standard error of the mean. Results were analyzed by one-way analysis of variance (ANOVA) and Student’s t-test where appropriate. Unpaired data were compared using unpaired 2-sided t tests; paired data were compared using paired 2-sided t tests. If either normality or equality of variances was rejected, the nonparametric Mann– Whitney test was used. Correlation coefficients were assessed with Spearman rank correlation. A two-tailed value of p < 0.05 was considered statistically significant.
3. Results
3.1. USPIO and FDG uptake
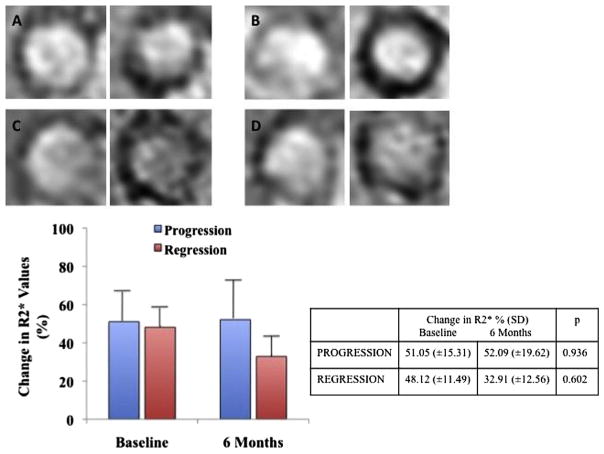
At baseline we observed an increase of R2* values post P904 injection and a strong uptake of FDG in the abdominal aorta indicating atherosclerotic plaque inflammation. At baseline, R2* values and SUVmean were similar in Regression and Progression group (p =0.936 for R2* change, p =0.701 for SUVmean).
At 6 months we observed a lesser increase in R2* values post P904 injection in the regression group compared to baseline (32.91% vs 48.12%) but without significant difference (p =0.602). In the progression group increase in R2* values post P904 injection was similar to that observed at baseline (52.09% vs 51.05%, p =0.936) (Fig. 1).
Fig. 1.
T2* weighted images pre and post USPIO injection for a “progression” rabbit at baseline (A) and at 6 months (B) and for a “regression” rabbit at baseline (C) and at 6 months (D). Graph and table comparing change in R2* show a non-significant decrease in the regression group.
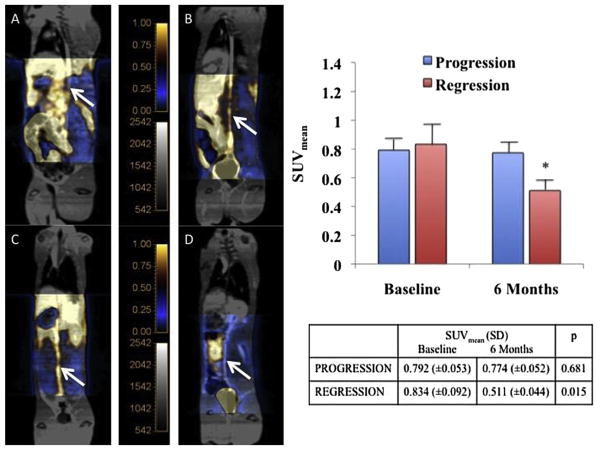
At 6 months, SUVmean values measured in the regression group showed significantly less uptake of FDG in the abdominal aorta compared to baseline (0.511 vs 0.834, p =0.015). In comparison, the progression group showed a similar SUVmean compared to baseline (0.774 vs 0.792, p =0.681) (Fig. 2).
Fig. 2.
Fused 18F-FDG PET/MR images at baseline and at 6 months showing a persistant strong FDG uptake in the abdominal aorta at 6 month in a “progression” rabbit (A,B) and a lesser uptake at 6 months in a “regression” rabbit (C,D). Graph and table comparing the mean SUV evolution in the 2 groups show a significant decrease of SUVmean in the regression group.
3.2. Histology results
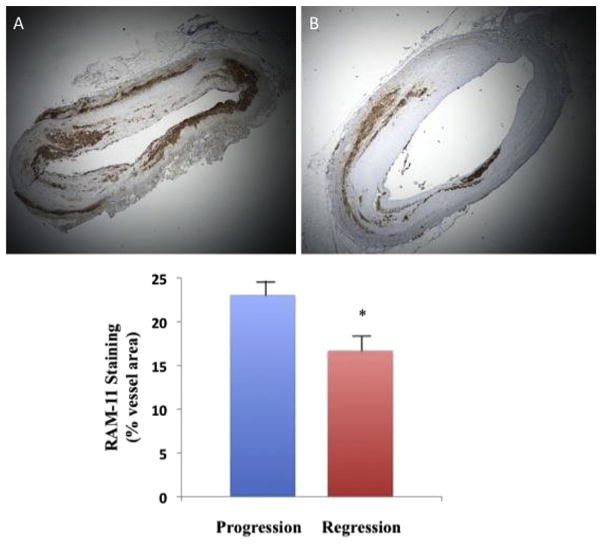
RAM-11 immunohistochemistry revealed a significant difference in macrophage content in the plaques of the regression group versus the progression group measured by 23.11% (±1.91) of vessel area in progression group versus 16.72% (±1.10) of vessel area in regression group (p =0.003) (Fig. 3).
Fig. 3.
RAM 11 staining on histology slices showing a massive inflltration of macrophages in progression group (A, ×2 magnification) and a lower inflltration in regression group (B, ×2 magnification). Graph comparing the percentage of wall area occupied by RAM 11 staining show a significant difference in the two groups.
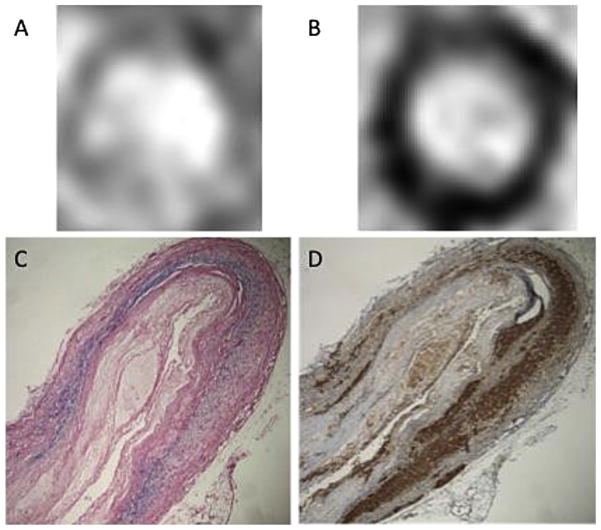
P904 USPIO detected by Perls iron staining proved to co-localize with macrophages stained in the aortic wall (Fig. 4). Immunostaining with RAM11 showed a good correlation between change in R2* values and macrophages content (R2 =0.707, R2 =0.820 in the regression group and R2 =0.569 in the progression group).
Fig. 4.
T2* weighted images pre (A) and post USPIO injection (B) show a loss of signal in the arterial wall in a rabbit from the progression group. Co-localization between Perls iron staining (C) and Ram 11 staining (D) (×4 magnification).
The SUVmean also showed a good correlation with the macro-phage burden stained with RAM11 in the aortic wall (R2 =0.778, R2 =0.776 in the regression group and R2 =0.778 in the progression group) (Fig. 5).
Fig. 5.
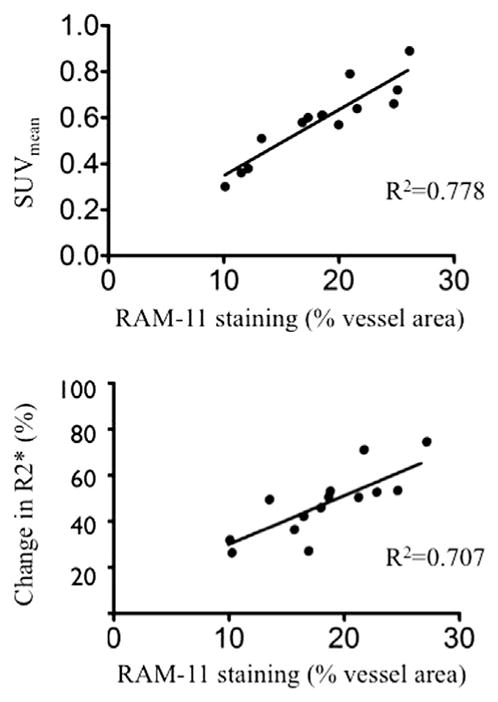
Graph showing correlation between SUVmean and Ram 11 staining and between change in R2* values and Ram 11 staining.
4. Discussion
Combined FDG PET and USPIO contrast enhanced MRI can be used to monitor the effect of statin therapy and dietary change in atherosclerotic rabbits. FDG PET mean SUV reduction in atherosclerotic plaque was significant after 6 months while USPIO MRI signal change also showed a decrease in macrophage inflltration but without statistical significance.
Human prospective studies have already shown the ability of USPIO contrast enhanced MRI or FDG PET to monitor the effect of statin therapy at different doses. Results of the ATHEROMA study, using USPIO enhanced MRI revealed a significant change in signal intensity in carotid plaque after 6 weeks of 80 mg atorvastatin therapy while no significant change was observed for a lower dose (10 mg) [7]. A multicenter PET-CT study also showed a significant reduction in atherosclerotic inflammation at 12 weeks of 10 or 80 mg atorvastatin but with a significant additional reduction with 80 mg relative to 10 mg [8]. However, these human results are not comparable to those obtained in our preclinical experiment mainly for methodological reasons: the USPIO contrast agent and protocol used were different, especially the signal change analysis.
Our study shows a decrease in iron uptake in the aortic vessel wall at 6 month but failed to find a significant difference compared to baseline. To our knowledge there is no gold standard validated technique for quantitative analysis of USPIO signal change and its correlation with macrophage density by histology. Signal to noise ratio (SNR) has been used by several authors with significant differences of the methods for signal normalization or differences of the area measured [9–11]. Others assessed the degree of blooming on T2* weighted images as a semi-quantitative “darkening index” (DI) [12]. In an attempt to improve detection and quantification, several positive contrast approaches after USPIO injection such as GRASP have also been examined [13]. Yet another technique previously described, uses R2* maps to calculate the mean R2* value in the plaque [14]. We chose to use this method to measure USPIO uptake because it has been shown that quantitative R2* mapping allows non-invasive estimations of cellular iron load and number of iron-labeled cells [15]. Drawbacks in the measurement of USPIO signal loss by MRI include the proximity of the lymphatic to the arterial wall. Focal signal loss of the aortic wall on the T2* weighted images can be caused by the accumulation of USPIOs in peri-arterial lymph nodes [12]. Furthermore, the relationship between signal loss on T2* weighted imaging and macrophages density is probably not linear since iron oxide particles induce inhomogeneities in the static magnetic field and cause rapid dephasing of diffusing water protons, including those diffusing further away from the plaque. Using R2* in our study, we demonstrated a good correlation between USPIO signal change on MRI and macrophages density on histology (RAM11). The non-significant decrease of R2* values post P904 injection in the regression group can be explained by the high variability of the measurement and the lack of power related to the small number of rabbits. There is a high variability (high standard deviation) in R2* values in the progression group and the composition of atherosclerotic plaque changes over time and become more heterogenous, especially in the progression group with some black area in T2* weighted pre injection images making the change in R2* probably lower than expected. This observation is confirmed by the difference in correlation (R2* – RAM11) between both progression and regression groups (R2 =0.569 vs. R2 =0.820). Furthermore other USPIO compounds with greater R2* values and/ or longer circulation times could improve the sensitivity of such approach.
Our results also demonstrate the ability of FDG PET MRI to monitor the effect of statin therapy and diet on vascular inflammation. We observed a significant decrease in FDG uptake after 6 months of treatment. A significant change in FDG uptake after dietary change or stabilizing plaque therapy has already been observed in both animal and in human studies [16–19]. Although it has been suggested to use Target to Background Ratio (TBR) as a quantification method for the trial of systemic therapies such statins, we decided to use the mean SUV of the infrarenal abdominal aorta without blood correction [20]. It has been shown that SUV is the most reproducible method for estimation of FDG uptake as compared to vessel-to-blood ratio and metabolic rate of glucose (Ki) [21]. The use of FDG-PET SUV to measure response to anti-inflammatory treatments is also well established [22]. Derlin et al. recently reported that additional correction by division with SUV blood-pool might lead to an overcorrection and concluded that there is no reason to prefer TBR over SUV for the quantification of tracer uptake [23]. More studies looking at the utility of these different parameters are needed.
As expected we observed a significant decrease of macrophage content within the plaques of the group treated with atorvastatin compared to the untreated group. This effect has already been demonstrated in animal models and in human carotid atheroscle-rotic plaques [24,25]. However, in our study, the decrease in plaque macrophage density of the regression group cannot be exclusively related to the statin therapy. The diet was also different between the 2 groups (chow diet in the regression group and high fat diet in the progression group) in order to maximize the difference between the atherosclerotic lesions observed. Riedmuller et al. have shown that atherosclerotic plaques in thoracic aorta of rabbits respond to withdrawal of high cholesterol diet by decrease in number and phenotype of macrophages [26].
Our histological results show a good correlation between the mean SUV and the macrophage density on histology and confirm that vascular macrophage activity can be quantified non-invasively with FDG-PET. The difference in correlation between macrophage density and SUV or USPIO signal change must be interpreted with caution. Even though both modalities are known to detect plaque inflammation, the mechanisms of action are different (macrophage glucose consumption for FDG and macrophage phagocytosis for P904) and type of macrophages detected probably not the same (“activated” macrpophages for USPIO and hypoxia-stimulated macrophages for FDG) [11,27].
Therefore the stage of inflammatory process detected is probably different between these two imaging modalities.
This experimental study shows the possibility to combine two functional imaging modalities to assess changes in the inflammation of atherosclerotic plaques upon therapeutic intervention. Combined MR/PET systems are becoming more widely available both pre-clinically and clinically. Such systems provide the advantages of MRI in tissue characterization (high spatial-resolution of soft tissue) and less radiation than CT. High Resolution MRI has been demonstrated as a reliable tool for noninvasive plaque burden assessment, plaque component characterization and plaque vulnerability/high-risk features. Furthermore new MRI sequences, especially dynamic sequences improve the characterization of neovascularization [28]. In addition to USPIOs, molecular MRI with different targets such as Macrophage Scavenger Receptor, Oxydation-Specific Epitopes or MMPs activity has been developped [29–32]. These approaches could provide additional information on the inflammatory status of the atherosclerotic plaques.
These results FDG-PET seems to be more sensitive than USPIO enhanced MRI to detect early changes in plaque inflammation.
Supplementary Material
Acknowledgments
Partial funding for this research was provided in part by NIH/ NHLBI R01 HL07102, NIH/NBIB R01 EB009638, NIH/NCATS CTSA UL1TR000067 (Imaging Core) and Guerbet Laboratories.
Appendix A. Supplementary data
Supplementary data related to this article can be found at http://dx.doi.org/10.1016/j.atherosclerosis.2013.03.019.
Footnotes
Conflict of interest
E.L., S.B., P.R. and C.C. are employees of Guerbet; Z.A.F. received partial funding from Guerbet.
Contributor Information
A. Millon, Email: antoinemillon@hotmail.com.
S.D. Dickson, Email: sdbioe@gmail.com.
A. Klink, Email: ahmedklink@mac.com.
D. Izquierdo-Garcia, Email: david.izquierdo@gmail.com.
J. Bini, Email: jasbini@gmail.com.
E. Lancelot, Email: lanceloe@guerbet-group.com.
S. Ballet, Email: sebastien.ballet@guerbet-group.com.
P. Robert, Email: philippe.robert@guerbet-group.com.
J. Mateo de Castro, Email: jmateo@cnic.es.
C. Corot, Email: Claire.Corot@guerbet-group.com.
Z.A. Fayad, Email: Zahi.fayad@gmail.com, Zahi.Fayad@mssm.edu.
References
- 1.Ross R. Atherosclerosis is an inflammatory disease. Am Heart J. 1999;138:S419–20. doi: 10.1016/s0002-8703(99)70266-8. [DOI] [PubMed] [Google Scholar]
- 2.Crisby M, Nordin-Fredriksson G, Shah PK, Yano J, Zhu J, Nilsson J. Pravastatin treatment increases collagen content and decreases lipid content, inflammation, metalloproteinases, and cell death in human carotid plaques: implications for plaque stabilization. Circulation. 2001;103:926–33. doi: 10.1161/01.cir.103.7.926. [DOI] [PubMed] [Google Scholar]
- 3.Sukhova GK, Williams JK, Libby P. Statins reduce inflammation in atheroma of nonhuman primates independent of effects on serum cholesterol. Arterioscler Thromb Vasc Biol. 2002;22:1452–8. doi: 10.1161/01.atv.0000030360.72503.56. [DOI] [PubMed] [Google Scholar]
- 4.Rudd JH, Warburton EA, Fryer TD, et al. Imaging atherosclerotic plaque inflammation with [18F]-fluorodeoxyglucose positron emission tomography. Circulation. 2002;105:2708–11. doi: 10.1161/01.cir.0000020548.60110.76. [DOI] [PubMed] [Google Scholar]
- 5.Tang TY, Muller KH, Graves MJ, et al. Iron oxide particles for atheroma imaging. Arterioscler Thromb Vasc Biol. 2009;29:1001–8. doi: 10.1161/ATVBAHA.108.165514. [DOI] [PubMed] [Google Scholar]
- 6.Sigovan M, Boussel L, Sulaiman A, et al. Rapid-clearance iron nanoparticles for inflammation imaging of atherosclerotic plaque: initial experience in animal model. Radiology. 2009;252:401–9. doi: 10.1148/radiol.2522081484. [DOI] [PubMed] [Google Scholar]
- 7.Tang TY, Howarth SP, Miller SR, et al. The ATHEROMA (atorvastatin therapy: effects on reduction of macrophage activity) study. Evaluation using ultrasmall superparamagnetic iron oxide-enhanced magnetic resonance imaging in carotid disease. J Am Coll Cardiol. 2009;53:2039–50. doi: 10.1016/j.jacc.2009.03.018. [DOI] [PubMed] [Google Scholar]
- 8.Tawakol A, Fayad ZA, Mogg R, et al. High dose statin results in a further reduction in atherosclerotic inflammation compared with low dose statin: results of a Multi-Center PET-CT study. Circulation. 2011;124:Abstract 18242. [Google Scholar]
- 9.Kooi ME, Cappendijk VC, Cleutjens KB, et al. Accumulation of ultrasmall superparamagnetic particles of iron oxide in human atherosclerotic plaques can be detected by in vivo magnetic resonance imaging. Circulation. 2003;107:2453–8. doi: 10.1161/01.CIR.0000068315.98705.CC. [DOI] [PubMed] [Google Scholar]
- 10.Tang TY, Howarth SP, Miller SR, et al. Correlation of carotid atheromatous plaque inflammation using USPIO-enhanced MR imaging with degree of luminal stenosis. Stroke. 2008;39:2144–7. doi: 10.1161/STROKEAHA.107.504753. [DOI] [PubMed] [Google Scholar]
- 11.Trivedi RA, Mallawarachi C, King-Im JMU, et al. Identifying inflamed carotid plaques using in vivo USPIO-enhanced MR imaging to label plaque macrophages. Arterioscler Thromb Vasc Biol. 2006;26:1601–6. doi: 10.1161/01.ATV.0000222920.59760.df. [DOI] [PubMed] [Google Scholar]
- 12.te Boekhorst BC, Bovens SM, Nederhoff MG, et al. Negative MR contrast caused by USPIO uptake in lymph nodes may lead to false positive observations with in vivo visualization of murine atherosclerotic plaque. Atherosclerosis. 2010;210:122–9. doi: 10.1016/j.atherosclerosis.2009.10.036. [DOI] [PubMed] [Google Scholar]
- 13.Briley-Saebo KC, Mani V, Hyafil F, Cornily JC, Fayad ZA. Fractionated Feridex and positive contrast: in vivo MR imaging of atherosclerosis. Magn Reson Med. 2008;59:721–30. doi: 10.1002/mrm.21541. [DOI] [PubMed] [Google Scholar]
- 14.Sigovan M, Bessaad A, Alsaid H, et al. Assessment of age modulated vascular inflammation in ApoE−/− mice by USPIO-enhanced magnetic resonance imaging. Invest Radiol. 2010;45:702–7. doi: 10.1097/RLI.0b013e3181f16e5a. [DOI] [PubMed] [Google Scholar]
- 15.Kuhlpeter R, Dahnke H, Matuszewski L, et al. R2 and R2* mapping for sensing cell-bound superparamagnetic nanoparticles: in vitro and murine in vivo testing. Radiology. 2007;245:449–57. doi: 10.1148/radiol.2451061345. [DOI] [PubMed] [Google Scholar]
- 16.Zhou G, Ge S, Liu D, et al. Atorvastatin reduces plaque vulnerability in an atherosclerotic rabbit model by altering the 5-lipoxygenase pathway. Cardiology. 2010;115:221–8. doi: 10.1159/000296017. [DOI] [PubMed] [Google Scholar]
- 17.Worthley SG, Zhang ZY, Machac J, et al. In vivo non-invasive serial monitoring of FDG-PET progression and regression in a rabbit model of atherosclerosis. Int J Cardiovasc Imaging. 2009;25:251–7. doi: 10.1007/s10554-008-9377-2. [DOI] [PubMed] [Google Scholar]
- 18.Vucic E, Dickson SD, Calcagno C, et al. Pioglitazone modulates vascular inflammation in atherosclerotic rabbits noninvasive assessment with FDG-PET-CT and dynamic contrast-enhanced MR imaging. JACC Cardiovasc Imaging. 2011;4:1100–9. doi: 10.1016/j.jcmg.2011.04.020. [DOI] [PMC free article] [PubMed] [Google Scholar]
- 19.Wu YW, Kao HL, Huang CL, et al. The effects of 3-month atorvastatin therapy on arterial inflammation, calcification, abdominal adipose tissue and circulating biomarkers. Eur J Nucl Med Mol Imaging. 2012;39:399–407. doi: 10.1007/s00259-011-1994-7. [DOI] [PubMed] [Google Scholar]
- 20.Rudd JH, Myers KS, Bansilal S, et al. Atherosclerosis inflammation imaging with 18F-FDG PET: carotid, iliac, and femoral uptake reproducibility, quantification methods, and recommendations. J Nucl Med. 2008;49:871–8. doi: 10.2967/jnumed.107.050294. [DOI] [PubMed] [Google Scholar]
- 21.Izquierdo-Garcia D, Davies JR, Graves MJ, et al. Comparison of methods for magnetic resonance-guided [18-F] fluorodeoxyglucose positron emission tomography in human carotid arteries: reproducibility, partial volume correction, and correlation between methods. Stroke. 2009;40:86–93. doi: 10.1161/STROKEAHA.108.521393. [DOI] [PubMed] [Google Scholar]
- 22.Lobatto ME, Calcagno C, Metselaar JM, et al. Imaging the efficacy of anti-inflammatory liposomes in a rabbit model of atherosclerosis by non-invasive imaging. Methods Enzymol. 2012;508:211–28. doi: 10.1016/B978-0-12-391860-4.00011-2. [DOI] [PMC free article] [PubMed] [Google Scholar]
- 23.Derlin T, Habermann CR, Hahne JD, et al. Quantification of [18F]-FDG uptake in atherosclerotic plaque: impact of renal function. Ann Nucl Med. 2011;25:586–91. doi: 10.1007/s12149-011-0503-1. [DOI] [PubMed] [Google Scholar]
- 24.Tahara N, Kai H, Ishibashi M, et al. Simvastatin attenuates plaque inflammation: evaluation by fluorodeoxyglucose positron emission tomography. J Am Coll Cardiol. 2006;48:1825–31. doi: 10.1016/j.jacc.2006.03.069. [DOI] [PubMed] [Google Scholar]
- 25.Puato M, Faggin E, Rattazzi M, et al. Atorvastatin reduces macrophage accumulation in atherosclerotic plaques: a comparison of a nonstatin-based regimen in patients undergoing carotid endarterectomy. Stroke. 2010;41:1163–8. doi: 10.1161/STROKEAHA.110.580811. [DOI] [PubMed] [Google Scholar]
- 26.Riedmüller K, Metz S, Bonaterra GA, et al. Cholesterol diet and effect of long-term withdrawal on plaque development and composition in the thoracic aorta of New Zealand white rabbits. Atherosclerosis. 2010;210:407–13. doi: 10.1016/j.atherosclerosis.2010.01.009. [DOI] [PubMed] [Google Scholar]
- 27.Folco EJ, Sheikine Y, Rocha VZ, et al. Hypoxia but not inflammation augments glucose uptake in human macrophages: implications for imaging atherosclerosis with 18 fluorine-labeled 2-deoxy-D-glucose positron emission tomography. J Am Coll Cardiol. 2011;58:603–14. doi: 10.1016/j.jacc.2011.03.044. [DOI] [PubMed] [Google Scholar]
- 28.Calcagno C, Cornily JC, Hyafil F, et al. Detection of neovessels in atherosclerotic plaques of rabbits using dynamic contrast enhanced MRI and 18F-FDG PET. Arterioscler Thromb Vasc Biol. 2008;28:1311–7. doi: 10.1161/ATVBAHA.108.166173. [DOI] [PMC free article] [PubMed] [Google Scholar]
- 29.Amirbekian V, Lipinski MJ, Briley-Saebo KC, et al. Detecting and assessing macrophages in vivo to evaluate atherosclerosis noninvasively using molecular MRI. Proc Natl Acad Sci U S A. 2007;104:961–6. doi: 10.1073/pnas.0606281104. [DOI] [PMC free article] [PubMed] [Google Scholar]
- 30.Briley-Saebo KC, Cho YS, Shaw PX, et al. Targeted iron oxide particles for in vivo magnetic resonance detection of atherosclerotic lesions with antibodies directed to oxidation-specific epitopes. J Am Coll Cardiol. 2011;57:337–47. doi: 10.1016/j.jacc.2010.09.023. [DOI] [PMC free article] [PubMed] [Google Scholar]
- 31.Ouimet T, Lancelot E, Hyafil F, et al. Molecular and cellular targets of the MRI contrast agent p947 for atherosclerosis imaging. Mol Pharm. 2012;9:850–61. doi: 10.1021/mp2003863. [DOI] [PubMed] [Google Scholar]
- 32.Hyafil F, Vucic E, Cornily JC, et al. Monitoring of arterial wall remodelling in atherosclerotic rabbits with a magnetic resonance imaging contrast agent binding to matrix metalloproteinases. Eur Heart J. 2011;32:1561–71. doi: 10.1093/eurheartj/ehq413. [DOI] [PMC free article] [PubMed] [Google Scholar]
Associated Data
This section collects any data citations, data availability statements, or supplementary materials included in this article.


