

Abstract
The dorsolateral prefrontal and posterior parietal cortex are 2 components of the cortical network controlling attention, working memory, and executive function. Little is known about how the anatomical organization of the 2 areas accounts for their functional specialization. In order to address this question, we examined the strength of intrinsic functional connectivity between neurons sampled in each area by means of cross-correlation analyses of simultaneous recordings from monkeys trained to perform working memory tasks. In both areas, effective connectivity declined as a function of distance between neurons. However, the strength of effective connectivity was higher overall and more localized over short distances in the posterior parietal than the prefrontal cortex. The difference in connectivity strength between the 2 areas could not be explained by differences in firing rate or selectivity for the stimuli and task events, it was present when the fixation period alone was analyzed, and according to simulation results, was consistent with a systematic difference either in the strength or in the relative numbers of shared inputs between neurons. Our results indicate that the 2 areas are characterized by unique intrinsic functional organization, consistent with known differences in their response patterns during working memory.
Keywords: cross-correlation, macaque, monkey, neurophysiology, working memory
Introduction
The dorsolateral prefrontal (dlPFC) and posterior parietal cortex (PPC) are 2 nodes of a broader brain network involved in attention, working memory, and executive function (Constantinidis and Procyk 2004; Bisley and Goldberg 2010). It is generally accepted that PFC is a hierarchically superior area in terms of processing of visual information (Felleman and Van Essen 1991; Serre et al. 2007), though neural correlates of working memory and attention have been described both in the PFC (Fuster and Alexander 1971; Funahashi et al. 1989; Miller et al. 1996; Rainer et al. 1998; Everling et al. 2002) and PPC (Constantinidis and Steinmetz 1996; Chafee and Goldman-Rakic 1998; Gottlieb et al. 1998; Bisley and Goldberg 2003; Constantinidis 2006). Differences in the patterns of neuronal activity in the dlPFC and PPC, revealing neurophysiological correlates of their functional specialization, have been demonstrated in the context of behavioral paradigms that require maintaining a stimulus in working memory and filtering distracting stimuli (Katsuki and Constantinidis 2012b; Suzuki and Gottlieb 2013). Neurons in PPC generally represent the location of the most recent stimulus even if it is behaviorally irrelevant (Constantinidis and Steinmetz 1996; Powell and Goldberg 2000); on the other hand, PFC neurons are better able to represent the behaviorally relevant stimulus (di Pellegrino and Wise 1993; Qi et al. 2010; Suzuki and Gottlieb 2013). More recently, functional differences have also been demonstrated in the context of categorization tasks (Merchant et al. 2011; Goodwin et al. 2012; Swaminathan and Freedman 2012).
How is the specialization of these 2 areas of the association cortex achieved? In the sensory pathways, the cortical hierarchy is characterized by stereotypical feed-forward connections transmitting the output of one area into the input layers of the next (Hubel and Wiesel 1962, 1965; Douglas and Martin 2004, 2007). A long-standing theory posits that the elemental transformation of information in each cortical area is essentially the same, leading to progressively larger receptive fields and more complex neuronal properties by virtue of increasing numbers of processing steps, an idea ingrained in current models of cortical function (Edelman and Mountcastle 1978; Cadieu et al. 2007; Serre et al. 2007). However, no obvious hierarchical pattern of information processing is present between the PPC and PFC, as their connections are largely reciprocal rather than strictly serial (Barbas and Pandya 1989; Cavada and Goldman-Rakic 1989; Felleman and Van Essen 1991). Therefore, it is unclear how functional specialization can be achieved beyond the PPC into the frontal lobes.
One possible explanation of the functional specialization of the PFC is that its intrinsic connectivity is unique relative to that of its afferent inputs. By some accounts, prefrontal pyramidal neurons exhibit the most extensive dendritic trees and highest numbers of spines of any cortical neurons (Elston 2000, 2003). Therefore, it is possible that specialized intrinsic connectivity patterns in prefrontal cortex determine, at least in part, its unique functional properties. However, physiological substrates of this idea have not been revealed until now. If the prefrontal circuitry is indeed characterized by a unique organization of its effective synaptic inputs, then the strengths of functional connections inferred from dual recordings should depend differently on distance across the 2 areas. Here, we test this idea.
Methods
Three male, rhesus monkeys (Macaca mulatta) weighing 5–12 kg were used in this study. All surgical and animal-use procedures in this study were reviewed and approved by the Wake Forest University Institutional Animal Care and Use Committee following the National Institutes of Health guidelines.
Surgery and Neurophysiology
Two 20-mm diameter recording cylinders were implanted over the dlPFC and PPC in each animal (Fig. 1A). We performed neuronal recordings using arrays of 2–8 microelectrodes in each cylinder with either glass-coated, tungsten electrodes of 250 μm diameter with an impedance of 1 MΩ measured at 1 kHz (Alpha-Omega Engineering, Nazareth, Israel) or epoxylite-coated tungsten electrodes with a diameter of 125 μm and an impedance of 4 MΩ at 1 KHz (FHC, Bowdoin, ME, USA). A microdrive system (EPS drive, Alpha-Omega Engineering, Nazareth, Israel) was used to position electrodes and advance them into the cortex. The electrical signal was amplified, band-pass filtered between 500 Hz and 8 kHz, and recorded through a modular data acquisition system at 25-μs resolution (APM system, FHC, Bowdoin, ME, USA). Anatomical localization of electrode penetrations was determined based on MR imaging of the brain obtained after implantation of the recording cylinders. Data were collected from areas 46 and 8a in the dlPFC and area 7a in the PPC. All recordings analyzed here were collected from the exposed surface of the cortex, eliminating recordings from sulci. Recording sites analyzed in the PPC sampled the crown of the gyrus posterior to the intraparietal sulcus; sites in the dlPFC were collected at least 1 mm away from the principal sulcus, in the superior convexity of the PFC, and in the surface cortex between the principal and arcuate cortex (Fig. 1A). In addition to anatomical localization, we used 3 more selection criteria to ensure that our analysis focused on horizontal connections across the surface of the cortex: 1) both neurons of a pair must have been recorded at a depth of <2.5 mm from the surface of the cortex; 2) the 2 electrode penetrations of a pair must have met the surface of the cortex no >1 mm apart from each other (i.e., if one electrode traversed >1 mm than the second before entering the cortex, the pair was discarded); 3) pairs of neurons that were recorded at depths >1 mm relative to each other were discarded, even if they otherwise avoided a sulcus.
Figure 1.

Brain areas and tasks. (A) Schematic diagram of the monkey brain. The areas of recordings are highlighted. AS, arcuate sulcus; IPS, intraparietal sulcus; PS, principal sulcus; STS, superior temporal sulcus. (B) Successive frames illustrate the sequence of stimulus presentations in the Delayed Match-to-Sample task. Following the cue presentation, a match or nonmatch stimulus appeared. The monkeys were required to remember the location of cue stimulus and release a lever when a subsequent stimulus appeared at the cued location. (C) Schematic illustration of the Match/Nonmatch task. Two choice targets were presented at the end of a trial, and the monkey was required to saccade to a green target (colored in gray in the figure); in case the 2 stimuli were matching and to a blue target (colored in black) otherwise.
Behavioral Tasks
The monkeys sat 60 or 68 cm away from a monitor in a dark room with their head fixed, as described in detail previously (Qi et al. 2010; Meyer et al. 2011). An infrared eye position-tracking system (model RK-716; ISCAN, Burlington, MA, USA) sampled and recorded eye position at 240 Hz. Monkeys were required to maintain their gaze on the fixation target throughout a trial; breaks in fixation aborted the trial. The visual stimulus presentations were controlled by in-house software (Meyer and Constantinidis 2005), developed in the MATLAB computational environment (Mathworks, Natick, MA, USA). Two monkeys were trained with a Delayed Match-to-Sample task (Fig. 1B), and 1 monkey was trained with a Match–Nonmatch task (Fig. 1C). In the Delayed Match-to-Sample task (Fig. 1B), monkeys were trained to remember the location of a cue and to release a lever when a subsequent stimulus appeared at the location of the cue. The cue stimulus consisted of a 1.5° square in green or red color and was displayed at 1 of 9 locations on a 3 × 3 grid with 15° separation between locations. In half the trials an array of multiple stimuli was presented, one of which differed in color and constituted the cue. After the monkeys pulled the lever and kept their eye fixated for 0.5 s, a cue was presented for 0.5 s followed by a delay period of 1.0 s and a pseudorandom sequence of 0–2 nonmatch stimulus presentations, each lasting 0.5 s and separated by delay periods of 0.5 s. When a stimulus appeared at the same location as the cue, the animals were required to release the lever within 0.5 s after the match stimulus disappeared in order to receive a reward. The trial was immediately aborted if the monkeys released the lever at any other time during the trial. Variations of the task with only 4 instead of 9 spatial locations used in a block of trials and a reaction-time version of the task in which the monkey was required to release the lever as quickly as possible when a target was present in the display were used in some sessions (Katsuki and Constantinidis 2012a). In the Match–Nonmatch task (Fig. 1C), a 2° white stimulus appeared in 1 of 9 locations arranged on a 3 × 3 grid of 10° separation between adjacent stimuli. A trial started with a 1-s fixation interval followed by a first stimulus presentation lasting for 0.5 s. After the first stimulus presentation, there was a 1.5-s delay period, and then a second stimulus appeared at the location identical or diametrically opposite to the first stimulus, also for 0.5 s. After another delay period (1.5 s), choice targets were presented, and the monkey was required to make a saccade to a green target if the two stimuli matched, and to a blue target if they did not.
Neuron Selection
Recorded spike waveforms were sorted into separate units using an automated cluster analysis method based on the KlustaKwik algorithm (Harris et al. 2000); this relied on principal component analysis of the waveforms and was implemented in MATLAB. Neurons with significant elevation of firing rate during the presentation of visual stimuli were identified by comparing the firing rate in the 0.5-s interval of a stimulus presentation with the 1- or 0.5-s interval of fixation (paired t-test; P < 0.05). Neurons with a significant change in activity in other task epochs were evaluated in a similar way. Only trials from correct behavioral responses to the task were used in the analysis presented in this article.
Cross-Correlation Analysis
To estimate the strength of intrinsic neural connections of each brain area, cross-correlation analysis was performed on pairs of neurons recorded simultaneously from separate electrodes spaced 0.18–1.5 mm apart from each other. Only neuron pairs containing >1000 spikes in total, and at least 100 spikes in each neuron were used for this analysis. Cross-correlation histograms (CCHs) were constructed from the spike trains of each pair of neurons (Perkel et al. 1967), using all available spikes from all recorded trials and conditions, as well as for separate periods, such as the fixation period. Since previous studies have identified CCH peaks of varying widths (Nowak et al. 1995), we relied on time scales of ±50 and ±200 ms with bins of 1 and 4 ms, respectively. CCH peaks almost always were centered at time zero, a finding indicating that the 2 neurons we recorded from shared common inputs (Moore et al. 1970; Smith and Kohn 2008). We therefore identified peaks at the central 5 and 20 ms of the ±50 and ±200 ms CCHs, respectively.
Strength was computed as the area under the peak, subtracting the expected value of the CCH under the assumption that the 2 spike trains are independent, and expressed as a percentage of the total number of spike counts. For cortical areas such as the dlPFC and PPC, where the influence of a stimulus on the millisecond timing of spikes during the duration of a trial lasting several seconds is minimal, a simple estimation of the expected value of the CCH can be obtained from the baseline of the CCH, defined as the average of half the bins in the flanks of the CCH (Constantinidis et al. 2001). In order to more robustly account for potential effects of stimulus presentations or other factors covarying during the time course of a trial that could simultaneously increase firing rates in both neurons of a pair, we also corrected CCHs with 3 alternative methods. First, we calculated a shift predictor by shifting the order of trials (Dickson and Gerstein 1974). This shift was performed within the set of trials recorded using the same stimulus location, so that trials of the 2 neurons involving the same location were always paired with each other. Cross-correlation strength for each pair of neurons was then obtained by subtracting this shift predictor on a bin-by-bin basis from the raw CCH and dividing the value under the center 5 ms by the total number of spike counts. Second, we implemented a method that relies on constructing surrogate spike trains (Smith and Kohn 2008). Each trial was segmented in 50 ms bins, and these bins were then shuffled between trials to produce spike trains with an equal number of trials as the raw data, but with temporal structures beyond 50 ms destroyed within each trial. Shuffling was repeated 100 times for each trial. Third, we created surrogate spike trains by varying randomly the time of each spike in a trial by sampling a replacement spike time from a uniform distribution spanning 50 ms around the time of the original spike. This method also destroyed temporal structures beyond 50 ms, without the need to shuffle the order of trials. All methods yielded very similar results; we relied on the last predictor method for most analyses, unless stated otherwise.
Individual pairs of neurons with significant CCH peaks were identified in the following manner. The value of the center 4 ms bin of the ±200 ms CCH was computed in the raw data, and in predictors randomly constructed 100 times. The empirical mean and standard deviation of the predictor was determined. Pairs of neurons with a raw CCH peak exceeding the predictor by a number of standard deviations corresponding to the α = 0.001 level were deemed to be significant, similar to prior studies reporting significant peaks among dlPFC neurons (Constantinidis et al. 2001).
To test the influence of firing rate on cross-correlation strength, we calculated the geometric mean of discharge rates for each neuron pair. This was defined as the square root of the product of mean discharge rates of each neuron, across all conditions used to construct the CCH. Cross-correlation strengths were then analyzed as a function of the geometric mean rates.
Noise Correlation
Noise correlation (also known as spike-count correlation) represents the correlation of normalized firing rates between a pair of neurons around their mean firing rate for a stimulus or task condition (Zohary et al. 1994). We restricted our analysis of noise correlation to the fixation period alone to avoid the confound of covariations in firing rate that occurs when 2 neurons are activated in the same time intervals (Brody 1998). All noise-correlation analyses relied on the same pairs of neurons used in cross-correlation analysis. For each pair of neurons, we computed the firing rate during the fixation interval in each trial. We then computed the Pearson correlation coefficient between these normalized firing rate values. Noise correlation can be thought of as the integral of the CCH peaks across all time lags (Bair et al. 2001).
Signal Correlation
Signal correlation represents an estimate of the similarity between the tuning of 2 neurons; high positive signal correlation values represent neurons with similar preferences for stimulus locations. The mean firing rates obtained during the cue period for each location were used for this analysis. The signal correlation was then computed as the Pearson correlation coefficient between the mean firing rates of 2 neurons, as we have done previously (Constantinidis et al. 2001). Only stimulus presentations involving a single stimulus shown at 1 of the 9 cue locations were used. In some sessions, neurons were tested with 4 instead of 9 stimulus locations; these were excluded from the signal correlation analysis. The relationship between the signal correlation and cross-correlation strength from the same pair of neurons was examined in each case.
Temporal Correlation
Temporal correlation represents an estimate of the similarity between the firing rates of 2 neurons over the time course of a behavioral trial (Constantinidis et al. 2001). To determine the temporal correlation for a pair of neurons, all trials from each neuron were first averaged together regardless of stimulus location or feature, and the mean firing rate was computed for successive 0.5 s windows spanning the trial. For the Delayed Match-to-Sample task, the windows included the fixation period, cue period, delay period, and match or nonmatch stimulus period. For the Match–Nonmatch task, the 0.5 s windows spanned the fixation period, cue period, delay period, match/non-match period, and second delay period. The Pearson correlation coefficient was calculated between the responses of 2 neurons across corresponding time windows. We also examined the relationship between the signal correlation and cross-correlation strength from the same pair of neurons.
Distance Function
As cross-correlation strength and noise correlation values were expected to depend on distance between electrodes in each cortical area (Lee et al. 1998; Constantinidis and Goldman-Rakic 2002), we fitted exponential functions to strength values across electrode separations. Fitting functions took the form:
where s is the cross-correlation strength, d is the horizontal separation between the 2 electrodes, A, and λ are free parameters of the exponential model, the amplitude and spatial constant, respectively. To avoid the fit being dominated by outliers at short (0.2–0.3 mm) distances, we relied on a robust fitting technique that performs the least-squares minimization iteratively, giving less weight to the data at the tails of the distribution of residual values. This was implemented with the MATLAB “nlinfit” function, using the “robust” option and “fair” weighting function. We compared the exponential functions obtained from different areas using a resampling method (Davison and Hinkley 1997). A permutation test was performed in which the area where a pair of neurons was recorded from was randomly assigned and then the best parameters that fit the exponential were determined. Repetition of the procedure over 10,000 times generated a null distribution of values to which the empirical value could be compared.
Simulations
We simulated the activities of pairs of model neurons in a computer to explore various scenarios that could explain the experimental results. In the standard set of simulations, we varied both the fraction of common input, f, and the mean synaptic weight per shared connection, w. Each member of a pair was an integrate-and-fire neuron (Troyer and Miller 1997; Salinas and Sejnowski 2000; Salinas and Sejnowski 2004) driven by 1000 excitatory and 250 inhibitory inputs, each of which produced spikes with Poisson statistics. Excitatory and inhibitory inputs fired at 10 and 20 spikes/s, respectively. Whenever excitatory (inhibitory) input i produced a spike, the total excitatory (inhibitory) conductance gE (gI) increased by gi, which is the weight of synapse i. Conductances gE and gI decayed exponentially with time constants of 10 and 8 ms, respectively; with these values, the widths of the resulting CCH peaks were on the order of 10–20 ms. In this model, the fluctuations in conductance drive the cell's voltage, V, which evolves according to
where the resting potential is set to 0 mV. Whenever V exceeds a threshold (20 mV), a spike is emitted, and V is clamped to a reset value (10 mV) for a refractory period (1.8 ms). After that, V continues evolving according to the above equation. Other parameters were τ = 20 ms, VE = 74 mV, VI = −10 mV.
For pairs of neurons with a fraction of shared inputs f, 1000 · f (250 · f) of the excitatory (inhibitory) input spike trains were the same. Synaptic weights varied across inputs, but were statistically the same for all neurons; that is, each of the 1000 excitatory weights was drawn independently from a uniform distribution between 0.001 and 0.04, and each inhibitory weight was drawn from a uniform distribution between 0.0044 and 0.176; these values were set so that the firing rates were ∼20 spikes/s and the coefficients of variation (CV, equal to the standard deviation of the interspike intervals divided by their mean) were around 1.1 for all model postsynaptic neurons. The average synaptic weight per shared input, w, is expressed relative to the average weight across all synapses. That is, w = 1 means that an excitatory (inhibitory) common input has, on average, the same weight as any excitatory (inhibitory) nonshared input. For any given value of w, the synaptic weights of all nonshared inputs were appropriately rescaled so that the total (shared plus nonshared) excitatory and inhibitory synaptic weights of each neuron were always the same.
Simulated output spike trains were used to generate CCHs, and the central 5 ms of each histogram were used to compute cross-correlation strength, as was done with the recorded data. Results are averages over multiple neuron pairs that had different synaptic weight realizations but identical f and w values.
In additional runs, some model parameters were varied to estimate their impact on the results: the numbers of input neurons, the firing rates of the input neurons, the synaptic time constants, and the conduction delays between the input spike trains and the postsynaptic neurons. Whenever necessary, the synaptic weights were multiplied by a factor, one for excitatory and another for inhibitory inputs, so that the postsynaptic model neurons always fired at about 20 spikes/s and had a CV of 1.1 approximately.
Results
We analyzed the effective connectivity between pairs of neurons recorded simultaneously in the dorsolateral prefrontal and in the posterior parietal cortex (Fig. 1A) of 3 monkeys trained to perform visual working memory tasks (Fig. 1B,C). The hypothesis that we sought to test is that intrinsic, effective connectivity differs systematically in the 2 areas. Recordings selected for analysis were obtained from the crown of cortical gyri, allowing us to focus on horizontal connections between neurons; electrode penetrations that descended into the principal, arcuate, or intraparietal sulcus were omitted, and thus analysis excluded neurons recorded in the frontal eye field or lateral intraparietal area (see Materials and Methods section). The sample encompassed 1935 pairs of neurons from areas 46 and 8a of the dlPFC and 1078 pairs of neurons recorded from area 7a of the PPC. Pairs of neurons with activity in any task period that met a minimum spike number criterion (>1000 spikes in total) were used for most analyses. These included 1123 neurons from the dlPFC (52, 778, and 293 from the 3 monkeys, respectively) and 632 from the PPC (123, 382, and 293, respectively). All pairs analyzed were recorded from different microelectrodes, separated laterally by 0.18–1.50 mm and advanced to depths no different than 1 mm of each other into the cortical volume (mean and standard deviation of depth difference between electrodes: 0.19 ± 0.25 mm in the dlPFC, 0.23 ± 0.20 mm in the PPC). Although depth estimates are approximate, most neurons in our database were recorded at supragranular layers (85%; of neurons were recorded at depths <1 mm from the surface of the cortex). No significant difference in behavioral performance was observed between the sessions during which the parietal and the prefrontal recordings were obtained. The average performance of 3 monkeys was 87% during the prefrontal recordings, and 86% in the posterior parietal recordings; no significant difference in performance was observed for any of the 3 monkeys analyzed separately (t-test, P > 0.1 in each case).
Effective Connectivity as a Function of Distance
To uncover potential differences in the intrinsic circuitry of the 2 areas, we measured how strong the functional connections between pairs of neurons in each area are, and did this for pairs separated by a range of distances. The strength of the effective connectivity between 2 simultaneously recorded neurons was estimated based on their CCH, which shows the percentage of spikes from the 2 neurons appearing within a few ms of each other, in excess of the expected number assuming that the 2 neurons discharged independently, illustrated as the white bars in Figure 2B (Perkel et al. 1967; Levick et al. 1972; Aertsen et al. 1989; Reid and Alonso 1995; Constantinidis et al. 2001). Almost invariably, when a cross-correlation peak was present, it was centered at time zero. We therefore calculated the cross-correlation strength on the center 5 and 20 ms window of the CCH. The 5 ms strength in particular represents synchronized discharges in the time scale of monosynaptic interactions (±2.5 ms).
Figure 2.

Cross-correlation analysis. (A) Sample rasters and histograms of 2 parietal neurons recorded simultaneously from separate electrodes. Rasters and histogram panels are arranged at locations corresponding to the relative cue stimulus location in the screen. (B) Examples of cross-correlation histograms (CCH). Horizontal dotted white lines represent CCH baseline. The strength of functional interactions between 2 neurons was estimated by calculating the percentage of spikes under the center 5 ms (left) or 20 ms (right) of the CCH (colored in white).
Cross-correlation strength in the 5 ms scale was highly variable across neuronal pairs, but on average declined systematically as a function of horizontal distance between the 2 neurons (Fig. 3A–C) in agreement with prior studies in various cortical areas (Lee et al. 1998; Constantinidis and Goldman-Rakic 2002; Smith and Kohn 2008). Importantly, we found that cross-correlation strength was higher in the PPC than the dlPFC, particularly for short (≤0.3 mm) electrode separations. When we compared mean cross-correlation strength across neuronal pairs that met the minimum spike criteria (N = 1755) grouped by the 2 areas and using distance as a covariate, we found a significant difference between the strength in the 2 areas (ANCOVA, P < 0.05). Modeling the effect of distance as an exponential also yielded a significant difference between the intercepts of the dlPFC and PPC exponential functions. We relied on a robust fitting technique (see Materials and Methods section) to fit an exponential across all neuron pairs of each area, without overweighting outliers (resulting in a curve slightly underestimating the empirical values recorded at distances of 0.2–0.3 mm). A simple exponential fit described well the cross-correlation strength at each distance averaged across monkeys (R2 = 0.90 and 0.65 for the PPC and dlPFC for the binned data shown in Fig. 3D). We then conducted a permutation test, first assigning each pair randomly to 1 of the 2 areas and then fitting an exponential function to the resulting groups of neurons with the same robust technique, to create an empirical distribution of intercepts and space constants for our dataset. The actual difference in intercepts between PPC and PFC we observed corresponded to a probability of P < 0.05. The difference in intercepts between 2 areas was further amplified (P < 0.005) if we relied on an unweighted least-squares minimization technique. When the average cross-correlation strengths were computed using only neuron pairs with ≤0.3 mm electrode separations (Fig. 3D inset), the strength was significantly higher for the PPC than the dlPFC in each of the 3 monkeys based on a t-test (P < 0.05). A more conservative, nonparametric comparison, the Wilcoxon rank-sum test, was still highly significant for 2 of the 3 monkeys (P < 0.005, P = 0.13, and P < 10−5, respectively). The choice of 0.3 mm as the cutoff for this comparison was somewhat arbitrary, dictated mostly by the number of pairs available in our database at distances around this value. The difference between areas remained significant (P < 0.05, based on the Wilcoxon rank-sum test) for 1 of the 2 monkeys for which neuron pairs were available at distances of 0.47–0.65 mm.
Figure 3.
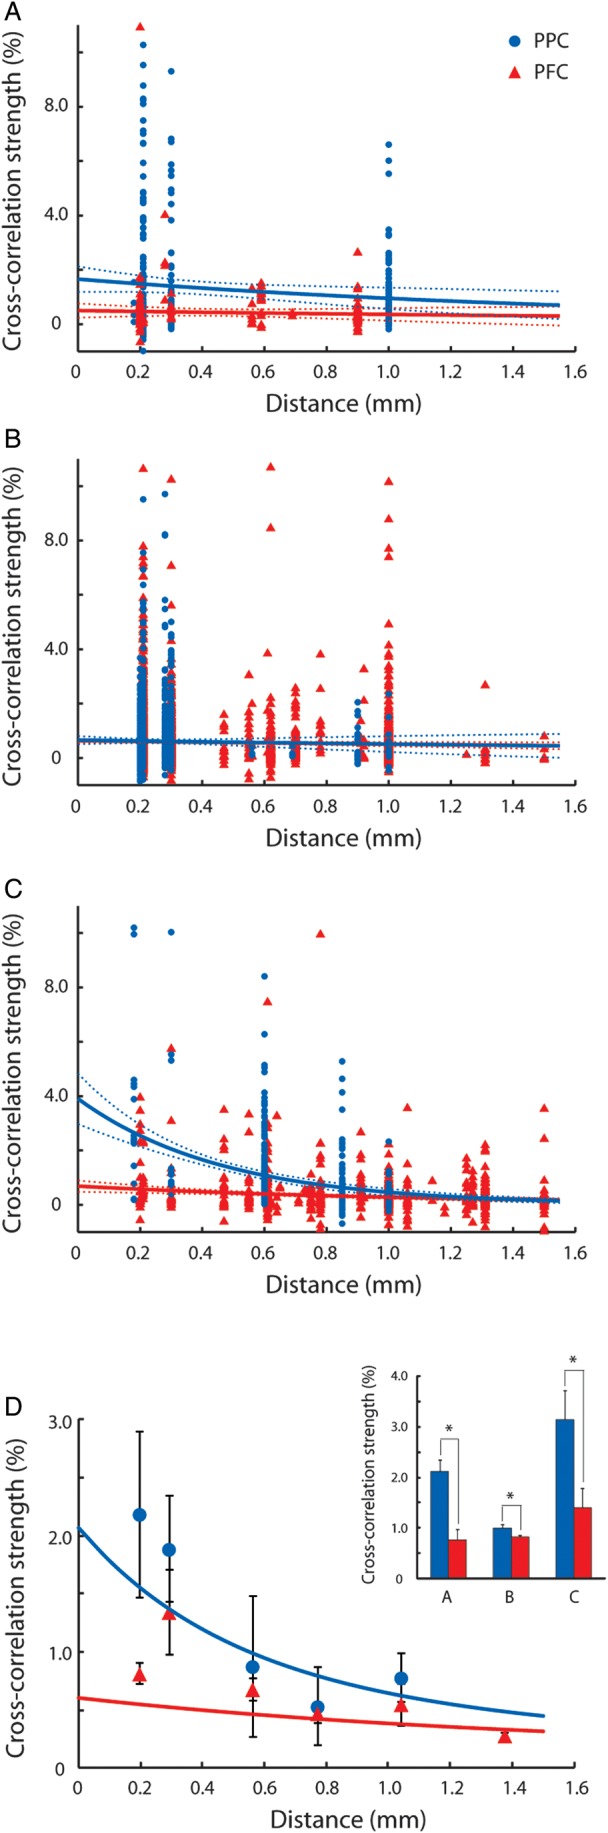
Effective connectivity as a function of distance. (A–C) Cross-correlation strength of prefrontal and parietal cortex as a function of electrode separation plotted for each of 3 animals. Each dot represents data from a pair of neurons. Blue and red dots and lines represent the parietal cortex and the prefrontal cortex, respectively. Dotted lines represent 95% confidence intervals. Up to 10 outliers appear outside the minimum or maximum bounds of the axes in each panel. (D) Cross-correlation strength averaged across monkeys. Data were first binned separately for each monkey, then averaged together at each distance, weighing equally each monkey. Error bars at each point represent standard error of the mean across monkeys. Blue and red curves represent average of curves in panels A–C. Inset illustrates average cross-correlation strength computed for neuron pairs with distances of ≤0.3 mm for each monkey. The center 5 ms of CCH peak was used. Blue and red bars represent the parietal and prefrontal cortex, respectively. Stars indicate statistically significant differences at the 0.05 significance level (t-test).
The results of this analysis were based on all available spikes. To ensure that this difference was not somehow tied to differential effects of the tasks in the 2 areas, we constructed CCH's based on spikes recorded only from the fixation period, prior to the appearance of any stimulus in each trial. Higher cross-correlation strength was observed for PPC than dlPFC neuron pairs within 0.3 mm of each other for the fixation period alone (PPC mean and standard error 2.23 ± 0.12%, PFC 1.19 ± 0.06%), which was a highly significant difference (t-test, P < 10−10).
We also sought to correct for the influence of the stimulus presentation or other factors covarying during the time course of a trial that could simultaneously increase firing rate in a pair of neurons, resulting in inflated CCH values. To ensure that the difference in cross-correlation strength across areas that we observed was not the result of such factors influencing unequally the 2 areas, we relied on several predictor methods (Fig. 4A–C). We first constructed “shift predictors” or CCHs resulting from shifting the order of trials of the 2 neurons, but always pairing trials drawn from the same stimulus presentation (Fig. 4A). We also computed predictors based on surrogate spike trains, constructed by segmenting the length of all trials into 50 ms bins and drawing spikes from corresponding bins from other trials, in essence destroying time structures beyond 50 ms. (Fig. 4B). Finally, we created predictors by randomly shuffling the time of each spike within 50 ms of the actual recorded time (Fig. 4C). In each case, a higher strength in the PPC than the dlPFC for short distances was observed when we quantified cross-correlation strength corrected by these predictors. We rely on the later predictor method for analyses thereon.
Figure 4.

Predictor-corrected effective connectivity. (A) Shift-predictor corrected cross-correlation strength of prefrontal and parietal neuron pairs, averaged across monkeys. (B). Cross-correlation strength as in A, but using a surrogate spike train predictor. (C). Cross-correlation strength as in A, but using a spike train predictor based on jittering the timing of each spike within a 50 ms window. (D) Proportion of pairs with significant cross-correlation peaks, based on the predictor of panel C. Data points represent values averaged across monkeys, weighing each monkey equally.
Another way to evaluate overall differences in pairwise connectivity across areas is to calculate the fraction of significant CCH peaks found at each electrode separation. Like cross-correlation strength, the probability of observing a significant peak increases with the number of inputs shared by the pair of recorded neurons and with their relative strength. We thus identified individual pairs of neurons with significant cross-correlation peaks in the center (4 ms) bin of the ±200 ms CCH, beyond the expected predictor value, evaluated at the α = 0.001 significance level. This analysis indicated that a larger percentage of PPC neurons exhibited significant CCH peaks at short distances, mirroring the average cross-correlation strength (Fig. 4D).
The results reveal a significant difference in functional connectivity in dlPFC versus PPC. The lower overall cross-correlation strength in dlPFC could result from a more widely distributed connectivity (i.e., from a greater percentage of parietal functional inputs originating from short distances, within a few 100 μm of each other), or alternatively, the spatial organization could be the same but the magnitude of the shared functional connections could differ (i.e., the shared inputs could be relatively stronger in PPC, particularly at short distances). Either way, the findings establish for the first time a distinction in the intrinsic connectivity between the PFC and an afferent cortical area.
Influence of Firing Rate
A consideration in comparing correlated discharges is the firing rate of the neurons in each group, as a higher firing rate can inflate the apparent correlation between 2 neurons (de la Rocha et al. 2007). It was important to determine if systematic differences in firing rate could account for the differences in cross-correlation strength we observed in the 2 areas, so we examined the mean firing rate of neurons making up the synchronous pairs recorded in the dlPFC and in the PPC (Fig. 5). We found no significant difference between areas in either the fixation or stimulus presentation period (Fig. 5A, t-test, P > 0.1 for all comparisons). If anything, average firing rate in our sample was slightly higher in the dlPFC. Examining the neurons that made up the pairs recorded within 0.3 mm of each other, where the greatest differences in correlation strength between areas were observed, we again determined no higher firing rate for the PPC, and in fact a significantly higher firing rate (t-test, P < 0.005) for the dlPFC in the stimulus presentation period (Fig. 5B). This suggests that the higher correlation strength we detected over short distances may even be underestimated for the posterior parietal sample, which exhibited lower overall firing rate than the prefrontal sample depicted in Figure 3. An analysis of covariance (ANCOVA) confirmed a significantly higher cross-correlation strength for PPC neurons than dlPFC neurons when firing rate was used as a covariate (ANCOVA, P < 0.05). When we examined pairs of neurons in the 2 areas matched for geometric mean firing rate, we found that the influence of firing rate on cross-correlation strength was greater in the PPC than in the dlPFC (Fig. 5C). As a result, the difference in cross-correlation strength was greatest for the PPC neuron pairs with the highest firing rate, compared with dlPFC neuron pairs with equal firing rate.
Figure 5.

Firing rate of neurons used in cross-correlation analysis. Peristimulus time histogram represents average firing rate for neurons recorded from the posterior parietal cortex (solid) and the prefrontal cortex (dotted). (A) All neurons in our sample. (B) Neurons from pairs with electrode separation ≤0.3 mm. Shaded area along each trace represents 1 standard error of mean computed across neurons. Gray shaded area represents the cue presentation period. (C) Relationship between cross-correlation strength and firing rate. Geometric mean rate was computed for each neuron pair with electrode separation ≤0.3 mm.
Effective Connectivity Over Different Time Scales
The results presented so far relied on analysis of cross-correlation peaks in the center 5 ms of the CCH, which examines the incidence of correlated spikes in the time scale of monosynaptic interactions, i.e. within 2.5 ms of each other. We also investigated whether differences in effective connectivity were evident over longer time scales, which are dominated by polysynaptic interactions (Fig. 6). We examined the strength of cross-correlation interactions relying on the center 20 ms of predictor-corrected CCH peaks, and the noise correlation between pairs of neurons in the 2 areas, which represents correlated firing in the time scale of task epochs (0.5–1.5 s long in our experiment). Pairs of posterior parietal neurons recorded within 0.3 mm of each other exhibited higher values for those measures than did pairs of prefrontal neurons, though only the measure of 20 ms CCH peak reached statistical significance (t-test, P < 10−5); the noise correlation did not (P > 0.05). For these interactions over long time scales, the dependence on distance also became weaker, in agreement with some prior studies that show a weak relationship between electrode distance and noise correlation (Ecker et al. 2010).
Figure 6.

Effective connectivity computed in different time scales. Mean cross-correlation strength and noise correlation averaged across monkeys. Circles/solid lines and triangles/dotted lines represent the parietal cortex and prefrontal cortex, respectively. Curves were fit based on all raw data points and superimposed on the average data points. Error bars represent standard error of the mean across monkeys. (A) Predictor-corrected average cross-correlation strength as a function of electrode separation. The center 20 ms of CCH peak was used. (B) Average noise correlation in the fixation period is plotted as a function of electrode separation.
The decreased difference between areas at longer time scales could in principle be the result of more dispersed correlated firing in dlPFC than PPC. Common input may be comparable in the 2 areas but subject to more jitter between dlPFC neurons (perhaps arising from delays due to axonal conduction, synaptic activation, and dendritic filtering), broadening the CCH around the peak but still resulting in equal overall common input in the 2 areas. To test for this possibility we plotted the predictor-corrected, average CCH across neuron pairs recorded within 0.3 mm of each other (Fig. 7). The results showed that both the height of the peak and the integral of the CCH were lower in the dlPFC than PPC for each of the monkeys, as expected, but importantly, there was no indication of a systematic difference in the width of the mean CCHs. The results suggest that, indeed, there are significant differences in functional connectivity between the 2 areas measured over relatively short time scales (a few tens of ms), but that as polysynaptic interactions integrate inputs over longer time scales, they smear the dependence of effective synaptic strength on neuronal separation.
Figure 7.

Average cross-correlation in each monkey. (A–C) Average cross-correlation histogram for the prefrontal and posterior parietal cortex from pairs of neurons recorded within 0.3 mm from each other, shown separately for each monkey in each panel. Histograms have been smoothed with a 3-point triangular filter.
Dependence of Connectivity on Neuronal Response Properties
Our analysis indicated systematic differences in effective connectivity between local-circuit neurons in the PPC and dlPFC. It is known that neurons with similar spatial tuning exhibit higher effective connectivity (Georgopoulos et al. 1993; Lee et al. 1998; Constantinidis et al. 2001; Smith and Kohn 2008; Cohen et al. 2010), so the differences we observed might be related to the tuning functions or task-related responses of the neurons in PPC versus dlPFC. To investigate this possibility, we examined the dependence of effective connectivity on neuronal functional properties in the 2 areas. First we measured how effective connectivity over short (5 ms) temporal interactions depended on the similarity in task-related responses between neurons (Fig. 8A). We relied on signal correlation as a measure of tuning similarity, defined as the Pearson correlation coefficient of average firing rates across the 9 stimulus locations used during the cue period. Cross-correlation strength was generally higher in both areas for neurons with the highest levels of signal correlation, although the relationship only reached significance for dlPFC (regression analysis, P < 0.005), and not for the PPC (P > 0.1). There was no significant difference in the signal correlation values between areas that could explain the differences in cross-correlation strength that we observed (PPC mean: 0.24, dlPFC mean: 0.21; t-test, P > 0.1), and an ANCOVA using signal correlation as a covariate further indicated that cross-correlation strength varied significantly between the 2 areas when the effect of signal correlation was accounted for (ANCOVA, P < 0.05).
Figure 8.

Relationship between response selectivity and effective connectivity. (A) Average cross-correlation strength versus signal correlation. (B) Average cross-correlation strength versus temporal correlation. Black and gray bars represent the parietal cortex and prefrontal cortex, respectively. Error bars represent standard errors of the mean across neuron pairs.
Previous studies also reported that the similarity in the temporal envelope of responses across task epochs is a predictor of effective connectivity between 2 neurons, at least in the dlPFC (Constantinidis et al. 2002). We therefore computed cross-correlation strength as a function of temporal correlation (Fig. 8B). We found a significant difference in cross-correlation strength values depending on temporal correlation (regression analysis, P < 10−5 for dlPFC, P < 0.005 for PPC). In this case too, there was no significant difference in temporal correlation value between areas (PPC mean: 0.53, dlPFC mean: 0.50; t-test, P > 0.05) and a significant difference in cross-correlation strength values between areas was still present when the effect of temporal correlation was accounted for (ANCOVA, P < 0.05). We also computed a single, combined variable of signal and temporal similarity for each pair of neurons, by calculating the Pearson correlation coefficient on the average firing rates obtained from successive 0.5-s time windows for separate stimulus locations, and tested its influence on effective connectivity. This measure too was significantly predictive of cross-correlation strength, more so for dlPFC (regression analysis, P < 10−5) than PPC (P < 0.05), but there was no significant difference between areas (PPC mean: 0.28, dlPFC mean: 0.26; t-test P > 0.3) and a significant difference in cross-correlation strength was still present between areas when the correlation value was used as a covariate in an ANCOVA (P < 0.05). The same relationships for signal and temporal correlation were generally present for cross-correlation interactions at longer time scales as well (20-ms CCH and noise correlation; data not shown). These results indicated that the similarity in functional properties between neurons was predictive of the strength of effective connectivity in both PPC and dlPFC, but that the difference in the distance relationship we observed between areas could not be explained by systematic differences in these response properties.
Potential Underlying Differences Between Cortical Areas
In a strict sense, a peak in a CCH simply signals a statistical dependence between the spike trains from 2 neurons. However, one of the most likely reasons for such peaks to arise, particularly when they are centered at zero lag, is that the 2 neurons have some inputs in common among those that drive them (Perkel et al. 1967; Aertsen et al. 1989; Brody 1999a, 1999b; Salinas and Sejnowski 2000; Salinas and Sejnowski 2004). In that case, the resulting cross-correlation strength depends heavily on 2 quantities, the fraction of common inputs and the synaptic weights of those common inputs. In turn, this observation suggests 2 possible, straightforward explanations for the pattern of results that we observed. 1) On average, the number of inputs shared by 2 neurons could vary systematically with the physical distance between them. That is, the farther apart 2 neurons are, the fewer input lines they may have in common (schematically illustrated in Fig. 9A–B). 2) Alternatively, what could vary systematically with distance is the input strength or synaptic weight. In that case, the farther apart 2 neurons are, the weaker the common inputs become (contrast Fig. 9A,C). These mechanisms are not unique, but they are reasonable and likely to be in play. Also, they are not mutually exclusive.
Figure 9.

Schematic models of intrinsic functional organization. (A) Diagram illustrates distributions of synaptic inputs onto a pair of prefrontal neurons. (B) Distributions of posterior parietal inputs. Parietal neurons may integrate inputs over a shorter range of distances compared with prefrontal neurons. (C) An alternative model for posterior parietal organization. Spatial distribution of inputs is identical to prefrontal cortex, but long distance connections exhibit proportionally lower functional strengths (represented with dotted lines).
To quantitatively explore the plausibility of these intuitive scenarios, we simulated the responses of pairs of spiking neurons and varied 2 quantities, the fraction of common input, f, and the mean synaptic weight per shared input, w; all other cell properties remained constant (see Materials and Methods section). Simulated CCHs had peaks centered at zero lag, as expected, and given the model parameters used, their widths were on the order of 20 ms. Also as anticipated, the amplitude of the peak increased with increasing f (Fig. 10A) and with increasing w, in agreement with previous theoretical (Melssen and Epping 1987; Ostojic et al. 2009; Trousdale et al. 2012) and experimental (Binder and Powers 2001; Turker and Powers 2002) results. In a first set of simulations, f was varied between 0 and 0.2 while w remained constant; and in this range, the cross-correlation strength changed in an almost perfectly linear fashion with f (Fig. 10B). This result has the following consequence. Suppose that as neurons become more separated, they share fewer numbers of connections, such that f decreases exponentially with distance. Then, the relationship between cross-correlation strength and distance itself would be exponential (Fig. 10C).
Figure 10.

Simulating cross-correlations through shared input. Pairs of integrate-and-fire model neurons were simulated and CCHs were obtained for different values of f and w, where f is the fraction of shared inputs and w the mean synaptic weight per shared input, expressed as a fraction of the mean synaptic weight. (A) Examples of simulated CCHs obtained with f = 0.2 (left) and f = 0.1 (right); w = 1 in both cases. Spike counts were normalized so that the baseline was equal to 1. (B) Cross-correlation strength as a function of f. Gray shades indicate 3 simulation runs with maximum f values of 0.05 (light gray), 0.1 (dark gray), and 0.2 (black). For all points, w = 1. (C) Expected dependence of cross-correlation strength on distance, assuming that f decreases exponentially with distance; space constant was 0.8 mm. Values on the y-axis are the same as in B. Continuous lines are exponential fits to the simulated data points (dots). (D) Cross-correlation strength as a function of w. Gray shades indicate 3 simulation runs with f values of 0.03 (light gray), 0.05 (dark gray), and 0.1 (black). (E) Expected dependence of cross-correlation strength on distance, assuming that w decreases exponentially with distance; space constant was 0.8 mm. Values on the y-axis are the same as in D. Continuous lines are exponential fits to the simulated data points (dots).
In Figure 10C, the 3 exponential curves differ only in their maximum fraction of shared inputs, which is simply the value of f at zero distance. This is enough to reproduce the observed differences between the PPC and dlPFC (Fig. 3D), although it is not the only possibility (see below). The model also provides a rough estimate of the actual maximum fraction of shared inputs needed to account for the magnitudes of the observed correlations: cross-correlation strengths of 1–3% correspond to 5–15% of shared inputs (Fig. 10B). This is under the simplest assumption, which is that the weights of the shared inputs are statistically the same as those of the nonshared (i.e., w = 1).
In a second series of simulations, we explored a slightly more complicated situation in which w varied systematically between 0.25 and 2 while f took 1 of 3 possible values (Fig. 10D, compare data points of different colors). This confirmed that both f and w determine the resulting cross-correlation strength, and that the dependence on w is quadratic (Ostojic et al. 2009). Note that, in this case, cross-correlation strengths of 1–3% occur within a reasonable range of values of w, roughly between 0.7 and 1.5, which correspond to synaptic weights 30% smaller or 50% larger than average (Fig. 10D). Therefore, the experimental results can also be reproduced by variations in w. To see this, suppose that as neurons become more separated, the fraction of shared connections does not change, but the weights of those connections (w) decrease exponentially with distance. Then, the relationship between cross-correlation strength and distance would again be monotonically decreasing, and still close to exponential (Fig. 10E).
In Figure 10E, the 3 curves again differ in the maximum fraction of shared inputs, but this is simply to demonstrate the main conclusion from these simulations: that, in general, differences between 2 such curves—of cross-correlation strength versus distance—of approximately the same magnitude as those seen between dlPFC and PPC may result from moderate differences in f, in w, or in both.
Importantly, the CCH also depends on various other factors, such as 1) the synaptic time constants of the common inputs, 2) jitter in the common spike trains arising from delays in axonal conduction or dendritic filtering, or 3) correlated fluctuations in the firing rates of the common inputs. These, together with f and w, may combine in various ways to produce a given CCH, so their contributions cannot be uniquely inferred from the CCH alone. However, we found no systematic differences between PPC and dlPFC neurons in their response statistics, as measured by their mean firing rates and variability (coefficient of variation, or CV; see Materials and Methods section), and this does constrain the impact that such additional factors may have. To investigate this and determine the robustness of the results in Figure 10, we ran additional simulations varying several model parameters. In all of these runs, while varying a given parameter, the synaptic weights were scaled appropriately to maintain the same mean rate and CV in the model postsynaptic neurons.
First, we verified that the results did not depend on the numbers of neurons used. We varied f either by varying the number of shared inputs while keeping the total number of inputs constant, or vice versa, by varying the total number of inputs while keeping the number of shared inputs fixed. The results were identical in the 2 conditions, demonstrating that what matters is indeed the fraction of shared inputs, f, not the actual numbers of neurons. Similarly, the cross-correlation strength showed the same dependence on w seen on Figure 10D, even though the actual synaptic weights varied across runs (to maintain the firing statistics constant, as mentioned above). Thus, what matters is the relative strength of the shared connections, w, not the actual conductance values.
Second, we repeated our original simulations (Fig. 10) with synaptic time constants that varied by several fold (2–4) with respect to the standard values. This altered the peaks and widths of the simulated CCHs to various degrees; however, in all cases, we found that the dependencies of cross-correlation strength on f (Fig. 10B) and on w (Fig. 10D) did not change appreciably—as long as the statistics of the postsynaptic responses remained fixed. With this condition in place, the particular time constants used had little impact on the values of f and w needed to achieve a particular cross-correlation strength.
Finally, we ran another set of simulations in which conduction delays were included to determine the impact of spike jitter on cross-correlation strength. It is known that higher dispersion in the common spikes driving a pair of neurons widens the CCH and reduces its peak (Brette 2009). Thus, if dlPFC received the same fraction of common inputs as PPC but these had a wider range of conduction delays, the measured cross-correlation strength would be lower in dlPFC, particularly for short time scales (i.e., 5 ms centered around zero lag). To explore this scenario, we ran simulations with spike jitter drawn from various distributions. We found that cross-correlation strength decreased with increasing jitter, as expected, but the effect was moderate. For example, when the jitter was drawn from a Poisson distribution with a mean of 1, 2, or 4 ms, the maximum cross-correlation strength went from 4.1 to 3.8 to 3.6%. A drop of 1% of more, as seen in the data, would require an enormous difference in spike jitter.
In sum, the simulation results indicate that, although a systematic difference in spike jitter cannot be entirely ruled out, the observed differences between dlPFC and PPC are likely due mainly to distinct patterns of anatomical connectivity in the 2 areas, i.e., to differences either in the proportions of shared inputs, in their relative synaptic weights, or both.
Discussion
Our study demonstrates differences in the functional organization of intrinsic effective connectivity of the dlPFC and PPC, 2 nodes of the frontoparietal network involved in spatial attention and working memory (Constantinidis and Procyk 2004; Bisley and Goldberg 2010). We relied on effective connectivity, quantified via the strength of cross-correlation peaks in the millisecond scale, as a way to compare the strength of intrinsic connections between areas. This is a physiological measure that only indirectly relates to the underlying neuronal circuits of each pair analyzed (Aertsen et al. 1989); nonetheless, it provides a means for statistical interareal comparisons. In agreement with prior neurophysiological studies (Lee et al. 1998; Constantinidis and Goldman-Rakic 2002; Smith and Kohn 2008), both PPC and dlPFC demonstrated a decrease in effective connectivity as a function of distance. This decrease in effective connectivity appears to mirror the exponential decay of anatomical connectivity at columnar scales (Markov et al. 2011). The actual values of effective connectivity that we report, on the order of 1–2% of spikes synchronized in the synaptic timescale due to shared inputs between pairs of neurons in the 2 areas, are consistent with the results of modeling relying on biologically realistic assumptions about the amount of convergence of synaptic sources onto single cortical neurons, and in line with prior findings from various cortical areas (Levick et al. 1972; Reid and Alonso 1995; Constantinidis et al. 2001). Importantly, neurons in the PPC shared a larger percentage of their functional inputs when they were located at short (≤0.3 mm) distances, compared with pairs of neurons recorded at equivalent distances from the dlPFC. The effect could not be accounted for by differences in firing rate and was present when we analyzed the fixation period alone, prior to stimulus presentation or other task events. We should make clear that the actual value for what we considered a “short” distance is somewhat arbitrary and was shaped by the database available for this analysis. A difference in effective connectivity between areas was most evident for short cross-correlation lags, comparable to the time scale of monosynaptic interactions, and less so for longer time scales of functional connectivity shaped by polysynaptic interactions. Effective connectivity was also influenced by similarity in stimulus selectivity (signal correlation) and temporal envelope of responses across the task (temporal correlation), but this relationship held true for both areas, so the differences in connectivity are likely to reflect underlying structural differences. These differences in functional connectivity offer mechanistic insights into the specialized functional roles of the 2 areas.
Prefrontal Functional Specialization
The PFC is generally considered the seat of higher cognitive functions (Miller and Cohen 2001) and is placed at the apex of the cortical hierarchy (Felleman and Van Essen 1991; Serre et al. 2007). The dorsolateral aspect of the PFC in particular is viewed as essential for attention, working memory, and executive function (Constantinidis and Procyk 2004; Bisley and Goldberg 2010). Nonetheless, a host of cognitive functions have also been localized in the activity of the PPC (Rawley and Constantinidis 2009). Indeed, human imaging studies reveal concurrent dlPFC and PPC activation in a wide range of tasks requiring spatial attention and working memory (Jonides et al. 1993; Courtney et al. 1997; Owen et al. 1998; Ungerleider et al. 1998; Munk et al. 2002; Raye et al. 2002). Evidence for a functional specialization between these areas has been subtle but accumulating (Katsuki and Constantinidis 2012b). The distinct roles played by the 2 areas are clearly evidenced by effects of lesions in humans and animal models resulting in more severe deficits in working memory after prefrontal damage, as opposed to visuospatial processing and attention after parietal lesions (Curtis and D'Esposito 2004; Husain and Nachev 2007). Differences have also emerged regarding the ability of PFC neurons to encode actively held stimuli, whereas its cortical afferents, including the PPC and inferior temporal cortex, seem to be representing the most recent stimulus to appear, whether it is a stimulus actively held in memory or a behaviorally irrelevant distractor (Miller et al. 1993; Miller et al. 1996; Constantinidis and Procyk 2004). More recently, functional differences have also been observed during stimulus categorization, although it is notable that the relative timing and magnitude of dlPFC and PPC activation differed across categorization tasks (Merchant et al. 2011; Goodwin et al. 2012; Swaminathan and Freedman 2012).
Little is known about how functional specialization between these areas can be achieved. Unlike the case of feed-forward connections transmitting the output of one sensory area into the input layers of the next, no obvious hierarchical pattern of information processing is present between the PPC and PFC, whose connections are essentially reciprocal rather than serial (Barbas and Pandya 1989; Cavada and Goldman-Rakic 1989; Felleman and Van Essen 1991). Several previous studies addressing the unique characteristics of prefrontal circuitry have focused on the effects of prefrontal dopaminergic innervation. Computational models have demonstrated persistent discharges with an increased signal-to-noise ratio in networks that incorporate dopamine inputs, an effect generally attributed to an enhanced NMDA conductance (Yang and Seamans 1996; Durstewitz et al. 2000; Seamans et al. 2001; Chen et al. 2004). The slow time constant of the NMDA receptor can leave the postsynaptic neuron in a depolarized state for a longer interval, facilitating persistent activity (Wang 2001). However, the effects of dopamine modulation are complex, and it is difficult to map specific effects of dopamine onto functional properties in the dlPFC (Katsuki and Constantinidis 2012b). We should point out that our present results did not reveal increased overall functional connectivity in the dlPFC during the execution of working memory tasks, so if dopamine facilitates synaptic transmission as predicted by these models, the effect may be subtle compared with the differences in intrinsic connectivity we report.
Other, more elemental differences between the prefrontal and parietal organization could also account for their functional differences. Longer-range projections between prefrontal neurons and more extensive dendritic trees could result in a larger percentage of inputs of prefrontal neurons received from longer distances, and thus in a smaller fraction of shared connections. In both areas, retrograde injections of anatomical tracers reveal clusters of neurons activated over a range of distances that extend several millimeters (Levitt et al. 1993; Kritzer and Goldman-Rakic 1995). However, prefrontal pyramidal neurons exhibit the most extensive dendritic trees and highest number of spines of any cortical neurons (Elston 2000, 2003), as well as considerable morphological and electrophysiological diversity (Elston et al. 2011; Zaitsev et al. 2012). Our present results illustrate physiological differentiation in effective connectivity between the 2 cortical areas that could be directly attributed to such anatomical differences in intrinsic connections. Specialization of functional classes of interneurons also appears to be present in the 2 cortical areas (Zhou et al. 2012). Furthermore, in recent years, active modulation of the level of correlation generated in neural circuits has been documented (Renart et al. 2010). Therefore, it is possible that the effects we observed were the result of active decorrelation mechanisms that operate to a larger extent at the dlPFC compared with the PPC. It should be noted however that active decorrelation was observed in the primary visual cortex (Ecker et al. 2010) and cannot be an exclusive prefrontal property.
Effective Connectivity in the 2 Cortical Areas
Our analysis relied on a large database of recordings allowing us to uncover systematic differences between the 2 areas by examining the strength of cross-correlation between simultaneously recorded pairs of neurons, an otherwise noisy measure. Although equivalent data have been reported for other cortical areas (Smith and Kohn 2008), direct comparison of the correlation values we report here with those from other experiments is difficult due to confounding factors such as firing rate and duration of the analysis window (Cohen and Kohn 2011). We therefore limit our comparison of the PFC with the PPC of the same animals performing the same tasks. As in prior studies (Constantinidis et al. 2001), the interactions we observed were almost always centered at time zero, suggesting shared input between the 2 neurons we were recording from (Moore et al. 1970). We were therefore able to infer indirectly the properties of cortical ensembles in the 2 areas. Posterior parietal neurons recorded over short distances shared a larger proportion of their functional inputs than prefrontal neurons, suggesting that neuronal ensembles activated at each time point of the task were larger in the dlPFC than the PPC. This result could not have been an artifact of differences in firing rates, as rates were comparable in the 2 areas (and slightly higher overall in dlPFC). The increase in correlated firing could be the result of more extended anatomical connections in the dlPFC (Fig. 9A) compared with the PPC (Fig. 9B). Alternatively, the size of cortical ensembles may be identical in the 2 areas, but longer distance projections may have greater influence in the PFC (Fig. 9A) than in the PPC (Fig. 9C) by virtue of the strength of cortical interactions or the synchronization of their timing (Salinas and Sejnowski 2000). The strength of synaptic connectivity has been directly implicated in the functional properties of simulated cortical networks, including the ability to resist interference by distractors during working memory (Compte et al. 2000); however, the implications of network differences such as those depicted in Figure 9 have not been explicitly studied. Future computational work will be decisive in determining the precise implications of the differences we describe here, as well as in revealing the specific relationships between functional properties and intrinsic organization unique to each area.
Funding
This work was supported by the National Eye Institute of the National Institutes of Health under award numbers R01EY016773 and R01EY017077, and by the Tab Williams Family Endowment Fund.
Notes
We thank Kathini Palaninathan, Keith Roberts, and Justin Rawley with help in experiments; Paul Miranda and Bryce Lambert with assistance in data analysis; David Blake, Albert Compte, Ram Ramachandran, and Terry Stanford for comments on a previous version of this manuscript. Conflict of Interest: None declared.
References
- Aertsen AM, Gerstein GL, Habib MK, Palm G. Dynamics of neuronal firing correlation: modulation of “effective connectivity”. J Neurophysiol. 1989;61:900–917. doi: 10.1152/jn.1989.61.5.900. [DOI] [PubMed] [Google Scholar]
- Bair W, Zohary D, Newsome WT. Correlated firing in macaque visual area MT: time scales and relationship to behavior. J Neurosci. 2001;21:1676–1697. doi: 10.1523/JNEUROSCI.21-05-01676.2001. [DOI] [PMC free article] [PubMed] [Google Scholar]
- Barbas H, Pandya DN. Architecture and intrinsic connections of the prefrontal cortex in the rhesus monkey. J Comp Neurol. 1989;286:353–375. doi: 10.1002/cne.902860306. [DOI] [PubMed] [Google Scholar]
- Binder MD, Powers RK. Relationship between simulated common synaptic input and discharge synchrony in cat spinal motoneurons. J Neurophysiol. 2001;86:2266–2275. doi: 10.1152/jn.2001.86.5.2266. [DOI] [PubMed] [Google Scholar]
- Bisley JW, Goldberg ME. Attention, intention, and priority in the parietal lobe. Annu Rev Neurosci. 2010;33:1–21. doi: 10.1146/annurev-neuro-060909-152823. [DOI] [PMC free article] [PubMed] [Google Scholar]
- Bisley JW, Goldberg ME. Neuronal activity in the lateral intraparietal area and spatial attention. Science. 2003;299:81–86. doi: 10.1126/science.1077395. [DOI] [PubMed] [Google Scholar]
- Brette R. Generation of correlated spike trains. Neural Comput. 2009;21:188–215. doi: 10.1162/neco.2008.12-07-657. [DOI] [PubMed] [Google Scholar]
- Brody CD. Correlations without synchrony. Neural Comput. 1999a;11:1537–1551. doi: 10.1162/089976699300016133. [DOI] [PubMed] [Google Scholar]
- Brody CD. Disambiguating different covariation types. Neural Comput. 1999b;11:1527–1535. doi: 10.1162/089976699300016124. [DOI] [PubMed] [Google Scholar]
- Brody CD. Slow covariations in neuronal resting potentials can lead to artefactually fast cross-correlations in their spike trains. J Neurophysiol. 1998;80:3345–3351. doi: 10.1152/jn.1998.80.6.3345. [DOI] [PubMed] [Google Scholar]
- Cadieu C, Kouh M, Pasupathy A, Connor CE, Riesenhuber M, Poggio T. A model of V4 shape selectivity and invariance. J Neurophysiol. 2007;98:1733–1750. doi: 10.1152/jn.01265.2006. [DOI] [PubMed] [Google Scholar]
- Cavada C, Goldman-Rakic PS. Posterior parietal cortex in rhesus monkey: II. Evidence for segregated corticocortical networks linking sensory and limbic areas with the frontal lobe. J Comp Neurol. 1989;287:422–445. doi: 10.1002/cne.902870403. [DOI] [PubMed] [Google Scholar]
- Chafee MV, Goldman-Rakic PS. Matching patterns of activity in primate prefrontal area 8a and parietal area 7ip neurons during a spatial working memory task. J Neurophysiol. 1998;79:2919–2940. doi: 10.1152/jn.1998.79.6.2919. [DOI] [PubMed] [Google Scholar]
- Chen G, Greengard P, Yan Z. Potentiation of NMDA receptor currents by dopamine D1 receptors in prefrontal cortex. Proc Natl Acad Sci USA. 2004;101:2596–2600. doi: 10.1073/pnas.0308618100. [DOI] [PMC free article] [PubMed] [Google Scholar]
- Cohen JY, Crowder EA, Heitz RP, Subraveti CR, Thompson KG, Woodman GF, Schall JD. Cooperation and competition among frontal eye field neurons during visual target selection. J Neurosci. 2010;30:3227–3238. doi: 10.1523/JNEUROSCI.4600-09.2010. [DOI] [PMC free article] [PubMed] [Google Scholar]
- Cohen MR, Kohn A. Measuring and interpreting neuronal correlations. Nat Neurosci. 2011;14:811–819. doi: 10.1038/nn.2842. [DOI] [PMC free article] [PubMed] [Google Scholar]
- Compte A, Brunel N, Goldman-Rakic PS, Wang XJ. Synaptic mechanisms and network dynamics underlying spatial working memory in a cortical network model. Cereb Cortex. 2000;10:910–923. doi: 10.1093/cercor/10.9.910. [DOI] [PubMed] [Google Scholar]
- Constantinidis C. Posterior parietal mechanisms of visual attention. Rev Neurosci. 2006;17:415–427. doi: 10.1515/revneuro.2006.17.4.415. [DOI] [PubMed] [Google Scholar]
- Constantinidis C, Franowicz MN, Goldman-Rakic PS. Coding specificity in cortical microcircuits: a multiple electrode analysis of primate prefrontal cortex. J Neurosci. 2001;21:3646–3655. doi: 10.1523/JNEUROSCI.21-10-03646.2001. [DOI] [PMC free article] [PubMed] [Google Scholar]
- Constantinidis C, Goldman-Rakic PS. Correlated discharges among putative pyramidal neurons and interneurons in the primate prefrontal cortex. J Neurophysiol. 2002;88:3487–3497. doi: 10.1152/jn.00188.2002. [DOI] [PubMed] [Google Scholar]
- Constantinidis C, Procyk E. The primate working memory networks. Cogn Affect Behav Neurosci. 2004;4:444–465. doi: 10.3758/cabn.4.4.444. [DOI] [PMC free article] [PubMed] [Google Scholar]
- Constantinidis C, Steinmetz MA. Neuronal activity in posterior parietal area 7a during the delay periods of a spatial memory task. J Neurophysiol. 1996;76:1352–1355. doi: 10.1152/jn.1996.76.2.1352. [DOI] [PubMed] [Google Scholar]
- Constantinidis C, Williams GV, Goldman-Rakic PS. A role for inhibition in shaping the temporal flow of information in prefrontal cortex. Nat Neurosci. 2002;5:175–180. doi: 10.1038/nn799. [DOI] [PubMed] [Google Scholar]
- Courtney SM, Ungerleider LG, Keil K, Haxby JV. Transient and sustained activity in a distributed neural system for human working memory. Nature. 1997;386:608–611. doi: 10.1038/386608a0. [DOI] [PubMed] [Google Scholar]
- Curtis CE, D'Esposito M. The effects of prefrontal lesions on working memory performance and theory. Cogn Affect Behav Neurosci. 2004;4:528–539. doi: 10.3758/cabn.4.4.528. [DOI] [PubMed] [Google Scholar]
- Davison AC, Hinkley DV. Bootstrap methods and their application. Cambridge: Cambridge University Press; 1997. [Google Scholar]
- de la Rocha J, Doiron B, Shea-Brown E, Josic K, Reyes A. Correlation between neural spike trains increases with firing rate. Nature. 2007;448:802–806. doi: 10.1038/nature06028. [DOI] [PubMed] [Google Scholar]
- Dickson JW, Gerstein GL. Interactions between neurons in auditory cortex of the cat. J Neurophysiol. 1974;37:1239–1261. doi: 10.1152/jn.1974.37.6.1239. [DOI] [PubMed] [Google Scholar]
- di Pellegrino G, Wise SP. Effects of attention on visuomotor activity in the premotor and prefrontal cortex of a primate. Somatosens Mot Res. 1993;10:245–262. doi: 10.3109/08990229309028835. [DOI] [PubMed] [Google Scholar]
- Douglas RJ, Martin KA. Neuronal circuits of the neocortex. Annu Rev Neurosci. 2004;27:419–451. doi: 10.1146/annurev.neuro.27.070203.144152. [DOI] [PubMed] [Google Scholar]
- Douglas RJ, Martin KA. Recurrent neuronal circuits in the neocortex. Curr Biol. 2007;17:R496–R500. doi: 10.1016/j.cub.2007.04.024. [DOI] [PubMed] [Google Scholar]
- Durstewitz D, Seamans JK, Sejnowski TJ. Dopamine-mediated stabilization of delay-period activity in a network model of prefrontal cortex. J Neurophysiol. 2000;83:1733–1750. doi: 10.1152/jn.2000.83.3.1733. [DOI] [PubMed] [Google Scholar]
- Ecker AS, Berens P, Keliris GA, Bethge M, Logothetis NK, Tolias AS. Decorrelated neuronal firing in cortical microcircuits. Science. 2010;327:584–587. doi: 10.1126/science.1179867. [DOI] [PubMed] [Google Scholar]
- Edelman GM, Mountcastle VB. The mindful brain: cortical organization and the group-selective theory of higher brain function. Cambridge: MIT Press; 1978. [Google Scholar]
- Elston GN. Pyramidal cells of the frontal lobe: all the more spinous to think with. J Neurosci. 2000;20:RC95. doi: 10.1523/JNEUROSCI.20-18-j0002.2000. [DOI] [PMC free article] [PubMed] [Google Scholar]
- Elston GN. The pyramidal neuron in occipital, temporal and prefrontal cortex of the owl monkey (Aotus trivirgatus): regional specialization in cell structure. Eur J Neurosci. 2003;17:1313–1318. doi: 10.1046/j.1460-9568.2003.02552.x. [DOI] [PubMed] [Google Scholar]
- Elston GN, Benavides-Piccione R, Elston A, Manger PR, Defelipe J. Pyramidal cells in prefrontal cortex of primates: marked differences in neuronal structure among species. Front Neuroanat. 2011;5:2. doi: 10.3389/fnana.2011.00002. [DOI] [PMC free article] [PubMed] [Google Scholar]
- Everling S, Tinsley CJ, Gaffan D, Duncan J. Filtering of neural signals by focused attention in the monkey prefrontal cortex. Nat Neurosci. 2002;5:671–676. doi: 10.1038/nn874. [DOI] [PubMed] [Google Scholar]
- Felleman DJ, Van Essen DC. Distributed hierarchical processing in the primate cerebral cortex. Cereb Cortex. 1991;1:1–47. doi: 10.1093/cercor/1.1.1-a. [DOI] [PubMed] [Google Scholar]
- Funahashi S, Bruce CJ, Goldman-Rakic PS. Mnemonic coding of visual space in the monkey's dorsolateral prefrontal cortex. J Neurophysiol. 1989;61:331–349. doi: 10.1152/jn.1989.61.2.331. [DOI] [PubMed] [Google Scholar]
- Fuster JM, Alexander GE. Neuron activity related to short-term memory. Science. 1971;173:652–654. doi: 10.1126/science.173.3997.652. [DOI] [PubMed] [Google Scholar]
- Georgopoulos AP, Taira M, Lukashin A. Cognitive neurophysiology of the motor cortex. Science. 1993;260:47–52. doi: 10.1126/science.8465199. [DOI] [PubMed] [Google Scholar]
- Goodwin SJ, Blackman RK, Sakellaridi S, Chafee MV. Executive control over cognition: stronger and earlier rule-based modulation of spatial category signals in prefrontal cortex relative to parietal cortex. J Neurosci. 2012;32:3499–3515. doi: 10.1523/JNEUROSCI.3585-11.2012. [DOI] [PMC free article] [PubMed] [Google Scholar]
- Gottlieb JP, Kusunoki M, Goldberg ME. The representation of visual salience in monkey parietal cortex. Nature. 1998;391:481–484. doi: 10.1038/35135. [DOI] [PubMed] [Google Scholar]
- Harris KD, Henze DA, Csicsvari J, Hirase H, Buzsaki G. Accuracy of tetrode spike separation as determined by simultaneous intracellular and extracellular measurements. J Neurophysiol. 2000;84:401–414. doi: 10.1152/jn.2000.84.1.401. [DOI] [PubMed] [Google Scholar]
- Hubel DH, Wiesel TN. Receptive fields and functional architecture in two nonstriate visual areas (18 and 19) of the cat. J Neurophysiol. 1965;28:229–289. doi: 10.1152/jn.1965.28.2.229. [DOI] [PubMed] [Google Scholar]
- Hubel DH, Wiesel TN. Receptive fields, binocular interaction and functional architecture in the cat's visual cortex. J Physiol (Lond) 1962;160:106–154. doi: 10.1113/jphysiol.1962.sp006837. [DOI] [PMC free article] [PubMed] [Google Scholar]
- Husain M, Nachev P. Space and the parietal cortex. Trends Cogn Sci. 2007;11:30–36. doi: 10.1016/j.tics.2006.10.011. [DOI] [PMC free article] [PubMed] [Google Scholar]
- Jonides J, Smith EE, Koeppe RA, Awh E, Minoshima S, Mintun MA. Spatial working memory in humans as revealed by PET. Nature. 1993;363:623–625. doi: 10.1038/363623a0. [DOI] [PubMed] [Google Scholar]
- Katsuki F, Constantinidis C. Early involvement of prefrontal cortex in visual bottom-up attention. Nat Neurosci. 2012a;15:1160–1166. doi: 10.1038/nn.3164. [DOI] [PMC free article] [PubMed] [Google Scholar]
- Katsuki F, Constantinidis C. Unique and shared roles of the posterior parietal and dorsolateral prefrontal cortex in cognitive functions. Front Int Neurosci. 2012b;6:17. doi: 10.3389/fnint.2012.00017. [DOI] [PMC free article] [PubMed] [Google Scholar]
- Kritzer MF, Goldman-Rakic PS. Intrinsic circuit organization of the major layers and sublayers of the dorsolateral prefrontal cortex in the rhesus monkey. J Comp Neurol. 1995;359:131–143. doi: 10.1002/cne.903590109. [DOI] [PubMed] [Google Scholar]
- Lee D, Port NL, Kruse W, Georgopoulos AP. Variability and correlated noise in the discharge of neurons in motor and parietal areas of the primate cortex. J Neurosci. 1998;18:1161–1170. doi: 10.1523/JNEUROSCI.18-03-01161.1998. [DOI] [PMC free article] [PubMed] [Google Scholar]
- Levick WR, Cleland BG, Dubin MW. Lateral geniculate neurons of cat: retinal inputs and physiology. Invest Ophthalmol. 1972;11:302–311. [PubMed] [Google Scholar]
- Levitt JB, Lewis DA, Yoshioka T, Lund JS. Topography of pyramidal neuron intrinsic connections in macaque monkey prefrontal cortex (areas 9 and 46) J Comp Neurol. 1993;338:360–376. doi: 10.1002/cne.903380304. [DOI] [PubMed] [Google Scholar]
- Markov NT, Misery P, Falchier A, Lamy C, Vezoli J, Quilodran R, Gariel MA, Giroud P, Ercsey-Ravasz M, Pilaz LJ, et al. Weight consistency specifies regularities of macaque cortical networks. Cereb Cortex. 2011;21:1254–1272. doi: 10.1093/cercor/bhq201. [DOI] [PMC free article] [PubMed] [Google Scholar]
- Melssen WJ, Epping WJ. Detection and estimation of neural connectivity based on crosscorrelation analysis. Biol Cybern. 1987;57:403–414. doi: 10.1007/BF00354985. [DOI] [PubMed] [Google Scholar]
- Merchant H, Crowe DA, Robertson MS, Fortes AF, Georgopoulos AP. Top-down spatial categorization signal from prefrontal to posterior parietal cortex in the primate. Front Syst Neurosci. 2011;5:69. doi: 10.3389/fnsys.2011.00069. [DOI] [PMC free article] [PubMed] [Google Scholar]
- Meyer T, Constantinidis C. A software solution for the control of visual behavioral experimentation. J Neurosci Methods. 2005;142:27–34. doi: 10.1016/j.jneumeth.2004.07.009. [DOI] [PubMed] [Google Scholar]
- Meyer T, Qi XL, Stanford TR, Constantinidis C. Stimulus selectivity in dorsal and ventral prefrontal cortex after training in working memory tasks. J Neurosci. 2011;31:6266–6276. doi: 10.1523/JNEUROSCI.6798-10.2011. [DOI] [PMC free article] [PubMed] [Google Scholar]
- Miller EK, Cohen JD. An integrative theory of prefrontal cortex function. Annu Rev Neurosci. 2001;24:167–202. doi: 10.1146/annurev.neuro.24.1.167. [DOI] [PubMed] [Google Scholar]
- Miller EK, Erickson CA, Desimone R. Neural mechanisms of visual working memory in prefrontal cortex of the macaque. J Neurosci. 1996;16:5154–5167. doi: 10.1523/JNEUROSCI.16-16-05154.1996. [DOI] [PMC free article] [PubMed] [Google Scholar]
- Miller EK, Li L, Desimone R. Activity of neurons in anterior inferior temporal cortex during a short-term memory task. J Neurosci. 1993;13:1460–1478. doi: 10.1523/JNEUROSCI.13-04-01460.1993. [DOI] [PMC free article] [PubMed] [Google Scholar]
- Moore GP, Segundo JP, Perkel DH, Levitan H. Statistical signs of synaptic interaction in neurons. Biophys J. 1970;10:876–900. doi: 10.1016/S0006-3495(70)86341-X. [DOI] [PMC free article] [PubMed] [Google Scholar]
- Munk MH, Linden DE, Muckli L, Lanfermann H, Zanella FE, Singer W, Goebel R. Distributed cortical systems in visual short-term memory revealed by event-related functional magnetic resonance imaging. Cereb Cortex. 2002;12:866–876. doi: 10.1093/cercor/12.8.866. [DOI] [PubMed] [Google Scholar]
- Nowak LG, Munk MH, Nelson JI, James AC, Bullier J. Structural basis of cortical synchronization. I. Three types of interhemispheric coupling. J Neurophysiol. 1995;74:2379–2400. doi: 10.1152/jn.1995.74.6.2379. [DOI] [PubMed] [Google Scholar]
- Ostojic S, Brunel N, Hakim V. How connectivity, background activity, and synaptic properties shape the cross-correlation between spike trains. J Neurosci. 2009;29:10234–10253. doi: 10.1523/JNEUROSCI.1275-09.2009. [DOI] [PMC free article] [PubMed] [Google Scholar]
- Owen AM, Stern CE, Look RB, Tracey I, Rosen BR, Petrides M. Functional organization of spatial and nonspatial working memory processing within the human lateral frontal cortex. Proc Natl Acad Sci USA. 1998;95:7721–7726. doi: 10.1073/pnas.95.13.7721. [DOI] [PMC free article] [PubMed] [Google Scholar]
- Perkel DH, Gerstein GL, Moore GP. Neuronal spike trains and stochastic point processes. II. Simultaneous spike trains. Biophys J. 1967;7:419–440. doi: 10.1016/S0006-3495(67)86597-4. [DOI] [PMC free article] [PubMed] [Google Scholar]
- Powell KD, Goldberg ME. Response of neurons in the lateral intraparietal area to a distractor flashed during the delay period of a memory-guided saccade. J Neurophysiol. 2000;84:301–310. doi: 10.1152/jn.2000.84.1.301. [DOI] [PubMed] [Google Scholar]
- Qi XL, Katsuki F, Meyer T, Rawley JB, Zhou X, Douglas KL, Constantinidis C. Comparison of neural activity related to working memory in primate dorsolateral prefrontal and posterior parietal cortex. Front Syst Neurosci. 2010;4:12. doi: 10.3389/fnsys.2010.00012. [DOI] [PMC free article] [PubMed] [Google Scholar]
- Rainer G, Asaad WF, Miller EK. Selective representation of relevant information by neurons in the primate prefrontal cortex. Nature. 1998;393:577–579. doi: 10.1038/31235. [DOI] [PubMed] [Google Scholar]
- Rawley JB, Constantinidis C. Neural correlates of learning and working memory in the primate posterior parietal cortex. Vol. 91. Neurobiol Learn Mem; 2009. pp. 129–138. [DOI] [PMC free article] [PubMed] [Google Scholar]
- Raye CL, Johnson MK, Mitchell KJ, Reeder JA, Greene EJ. Neuroimaging a single thought: dorsolateral PFC activity associated with refreshing just-activated information. Neuroimage. 2002;15:447–453. doi: 10.1006/nimg.2001.0983. [DOI] [PubMed] [Google Scholar]
- Reid RC, Alonso JM. Specificity of monosynaptic connections from thalamus to visual cortex. Nature. 1995;378:281–284. doi: 10.1038/378281a0. [DOI] [PubMed] [Google Scholar]
- Renart A, de la Rocha J, Bartho P, Hollender L, Parga N, Reyes A, Harris KD. The asynchronous state in cortical circuits. Science. 2010;327:587–590. doi: 10.1126/science.1179850. [DOI] [PMC free article] [PubMed] [Google Scholar]
- Salinas E, Sejnowski TJ. Correlated neuronal activity: high- and low-level views. In: Feng J, editor. Computational Neuroscience: A Comprehensive Approach. Boca Raton: Chapman & Hall/CRC; 2004. pp. 341–374. [Google Scholar]
- Salinas E, Sejnowski TJ. Impact of correlated synaptic input on output firing rate and variability in simple neuronal models. J Neurosci. 2000;20:6193–6209. doi: 10.1523/JNEUROSCI.20-16-06193.2000. [DOI] [PMC free article] [PubMed] [Google Scholar]
- Seamans JK, Durstewitz D, Christie BR, Stevens CF, Sejnowski TJ. Dopamine D1/D5 receptor modulation of excitatory synaptic inputs to layer V prefrontal cortex neurons. Proc Natl Acad Sci USA. 2001;98:301–306. doi: 10.1073/pnas.011518798. [DOI] [PMC free article] [PubMed] [Google Scholar]
- Serre T, Oliva A, Poggio T. A feedforward architecture accounts for rapid categorization. Proc Natl Acad Sci USA. 2007;104:6424–6429. doi: 10.1073/pnas.0700622104. [DOI] [PMC free article] [PubMed] [Google Scholar]
- Smith MA, Kohn A. Spatial and temporal scales of neuronal correlation in primary visual cortex. J Neurosci. 2008;28:12591–12603. doi: 10.1523/JNEUROSCI.2929-08.2008. [DOI] [PMC free article] [PubMed] [Google Scholar]
- Suzuki M, Gottlieb J. Distinct neural mechanisms of distractor suppression in the frontal and parietal lobe. Nat Neurosci. 2013;16:98–104. doi: 10.1038/nn.3282. [DOI] [PMC free article] [PubMed] [Google Scholar]
- Swaminathan SK, Freedman DJ. Preferential encoding of visual categories in parietal cortex compared with prefrontal cortex. Nat Neurosci. 2012;15:315–320. doi: 10.1038/nn.3016. [DOI] [PMC free article] [PubMed] [Google Scholar]
- Trousdale J, Hu Y, Shea-Brown E, Josic K. Impact of network structure and cellular response on spike time correlations. PLoS Comput Biol. 2012;8:e1002408. doi: 10.1371/journal.pcbi.1002408. [DOI] [PMC free article] [PubMed] [Google Scholar]
- Troyer TW, Miller KD. Physiological gain leads to high ISI variability in a simple model of a cortical regular spiking cell. Neural Comput. 1997;9:971–983. doi: 10.1162/neco.1997.9.5.971. [DOI] [PubMed] [Google Scholar]
- Turker KS, Powers RK. The effects of common input characteristics and discharge rate on synchronization in rat hypoglossal motoneurones. J Physiol. 2002;541:245–260. doi: 10.1113/jphysiol.2001.013097. [DOI] [PMC free article] [PubMed] [Google Scholar]
- Ungerleider LG, Courtney SM, Haxby JV. A neural system for human visual working memory. Proc Natl Acad Sci USA. 1998;95:883–890. doi: 10.1073/pnas.95.3.883. [DOI] [PMC free article] [PubMed] [Google Scholar]
- Wang XJ. Synaptic reverberation underlying mnemonic persistent activity. Trends Neurosci. 2001;24:455–463. doi: 10.1016/s0166-2236(00)01868-3. [DOI] [PubMed] [Google Scholar]
- Yang CR, Seamans JK. Dopamine D1 receptor actions in layers V-VI rat prefrontal cortex neurons in vitro: modulation of dendritic-somatic signal integration. J Neurosci. 1996;16:1922–1935. doi: 10.1523/JNEUROSCI.16-05-01922.1996. [DOI] [PMC free article] [PubMed] [Google Scholar]
- Zaitsev AV, Povysheva NV, Gonzalez-Burgos G, Lewis DA. Electrophysiological classes of layer 2/3 pyramidal cells in monkey prefrontal cortex. J Neurophysiol. 2012;108:595–609. doi: 10.1152/jn.00859.2011. [DOI] [PMC free article] [PubMed] [Google Scholar]
- Zhou X, Katsuki F, Qi XL, Constantinidis C. Neurons with inverted tuning during the delay periods of working memory tasks in the dorsal prefrontal and posterior parietal cortex. J Neurophysiol. 2012;108:31–38. doi: 10.1152/jn.01151.2011. [DOI] [PMC free article] [PubMed] [Google Scholar]
- Zohary E, Shadlen MN, Newsome WT. Correlated neuronal discharge rate and its implications for psychophysical performance. Nature. 1994;370:140–143. doi: 10.1038/370140a0. [DOI] [PubMed] [Google Scholar]